- 快召唤伙伴们来围观吧
- 微博 QQ QQ空间 贴吧
- 文档嵌入链接
- <iframe src="https://www.slidestalk.com/Spark/Life_cycle_Inference_on_Unreliable_Event_Data?embed" frame border="0" width="640" height="360" scrolling="no" allowfullscreen="true">复制
- 微信扫一扫分享
Lifecycle Inference on Unreliable Event Data
展开查看详情
1 .Lifecycle Inference on Unreliable Event Data Austin Allshouse, BitSight
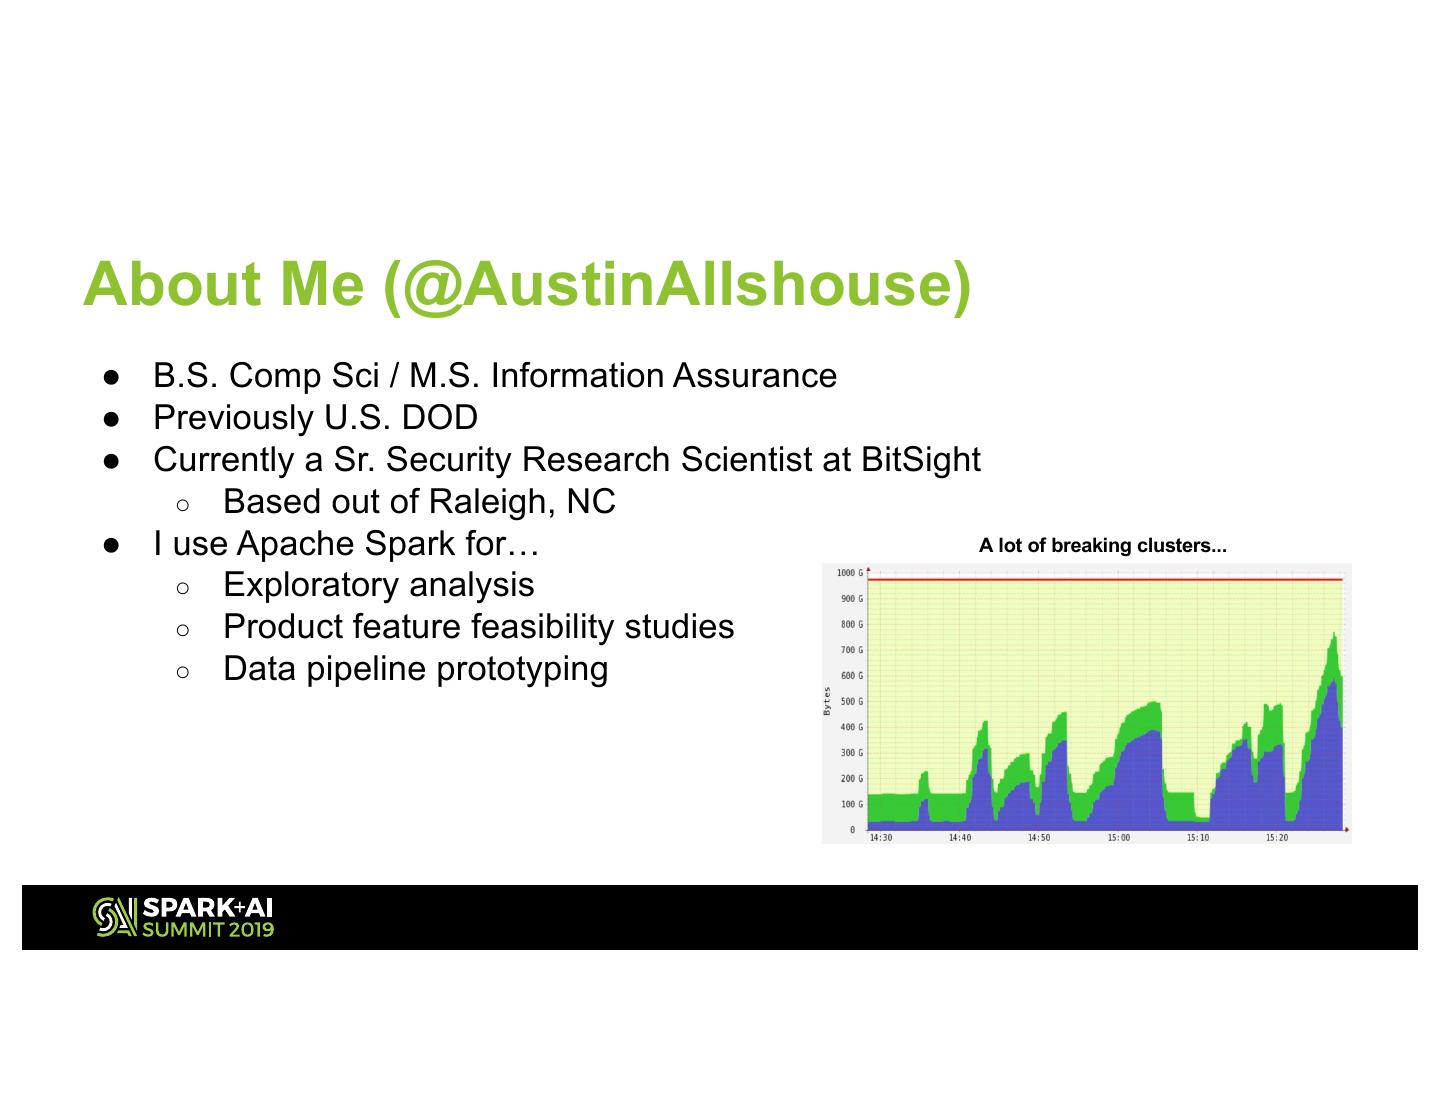
2 .About Me (@AustinAllshouse) ● B.S. Comp Sci / M.S. Information Assurance ● Previously U.S. DOD ● Currently a Sr. Security Research Scientist at BitSight ○ Based out of Raleigh, NC ● I use Apache Spark for… A lot of breaking clusters... ○ Exploratory analysis ○ Product feature feasibility studies ○ Data pipeline prototyping
3 .Overview ● Challenges with extracting associations from on network event data ○ Set within the use case of security ratings ● Discussion of simple techniques for addressing messy event data ● Quick refresher on DataFrame window functions ● Spark DataFrame tradecraft for implementing suggested techniques at scale ○ Dual-window row count differential aggregations ● Review of two lifecycle inference examples on network event log data ○ Consecutive event aggregations ○ Event refresh aggregations
4 .What are Security Ratings? ● WHAT: Objective, outside-in assessment of security posture from externally observable data ○ Using a similar approach to credit ratings for financial risk ○ Continuous monitoring ● WHY: Third party risk management, cyber insurance underwriting, mergers/acquisitions, and security performance management ● HOW: Combining: ○ Organizational digital asset inventories ○ Security event telemetry
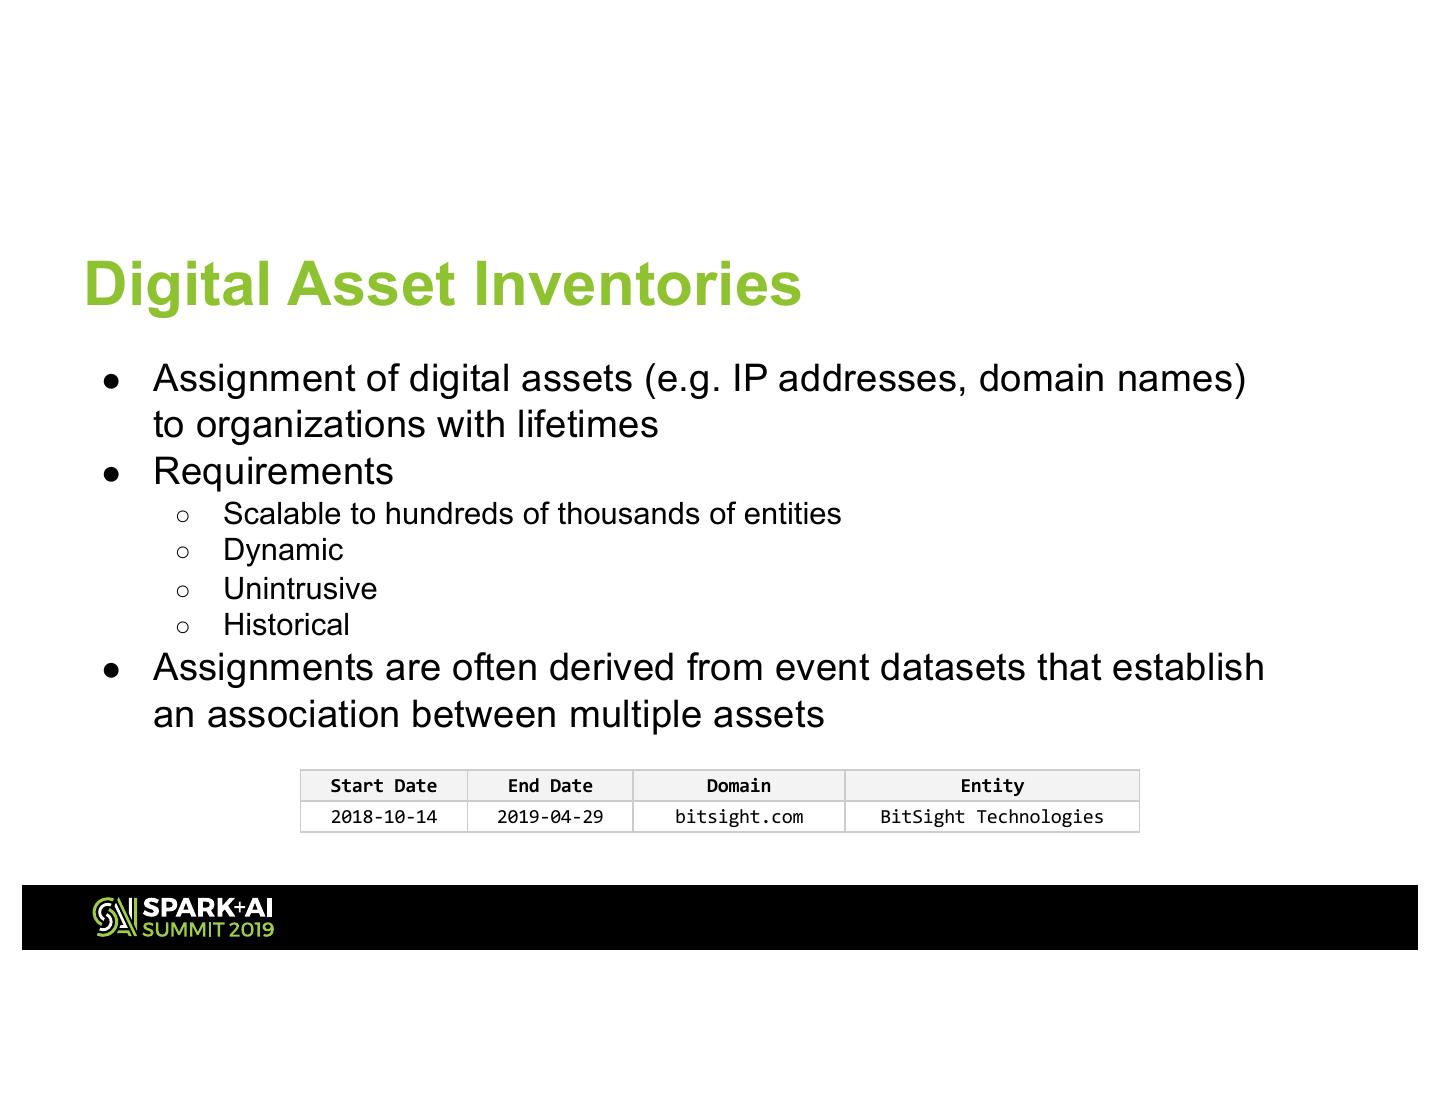
5 .Digital Asset Inventories ● Assignment of digital assets (e.g. IP addresses, domain names) to organizations with lifetimes ● Requirements ○ Scalable to hundreds of thousands of entities ○ Dynamic ○ Unintrusive ○ Historical ● Assignments are often derived from event datasets that establish an association between multiple assets Start Date End Date Domain Entity 2018-10-14 2019-04-29 bitsight.com BitSight Technologies
6 .Easy Mode Derive a lifetime for an association from a series of observations ● Entire event population accessible ● Events sampled on-demand ● Associations are robust ● Data provenance is known/controlled ● Population is homogenous DHCP Logs - Veracious Example of (IP, MAC) Associations
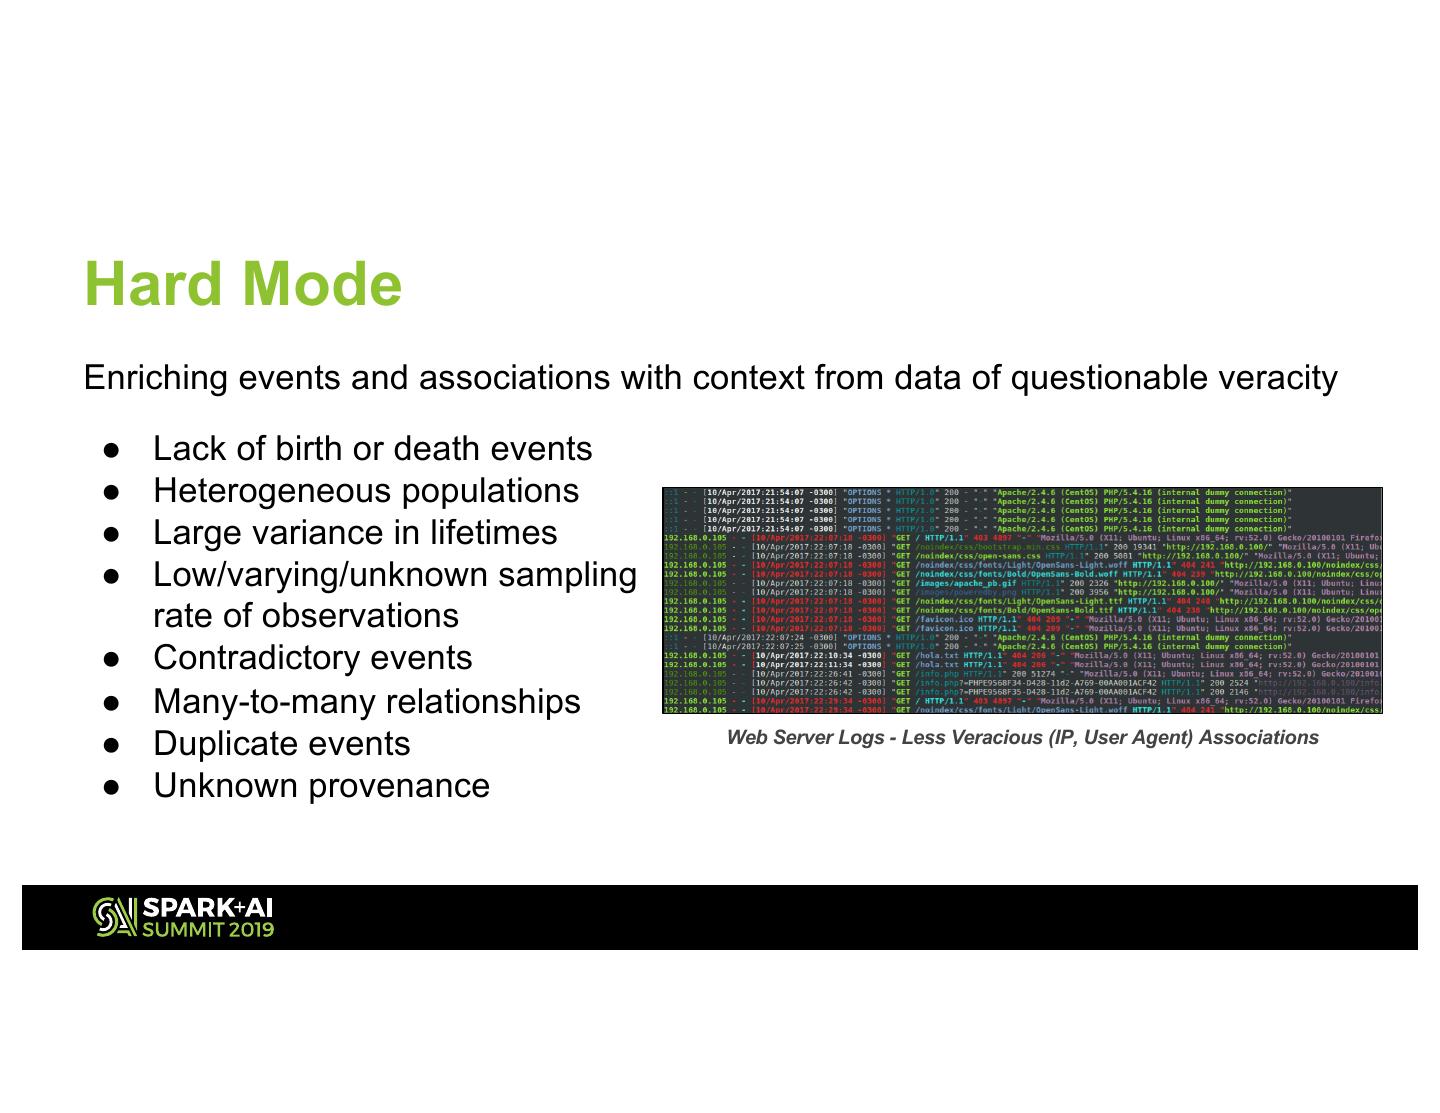
7 .Hard Mode Enriching events and associations with context from data of questionable veracity ● Lack of birth or death events ● Heterogeneous populations ● Large variance in lifetimes ● Low/varying/unknown sampling rate of observations ● Contradictory events ● Many-to-many relationships ● Duplicate events Web Server Logs - Less Veracious (IP, User Agent) Associations ● Unknown provenance
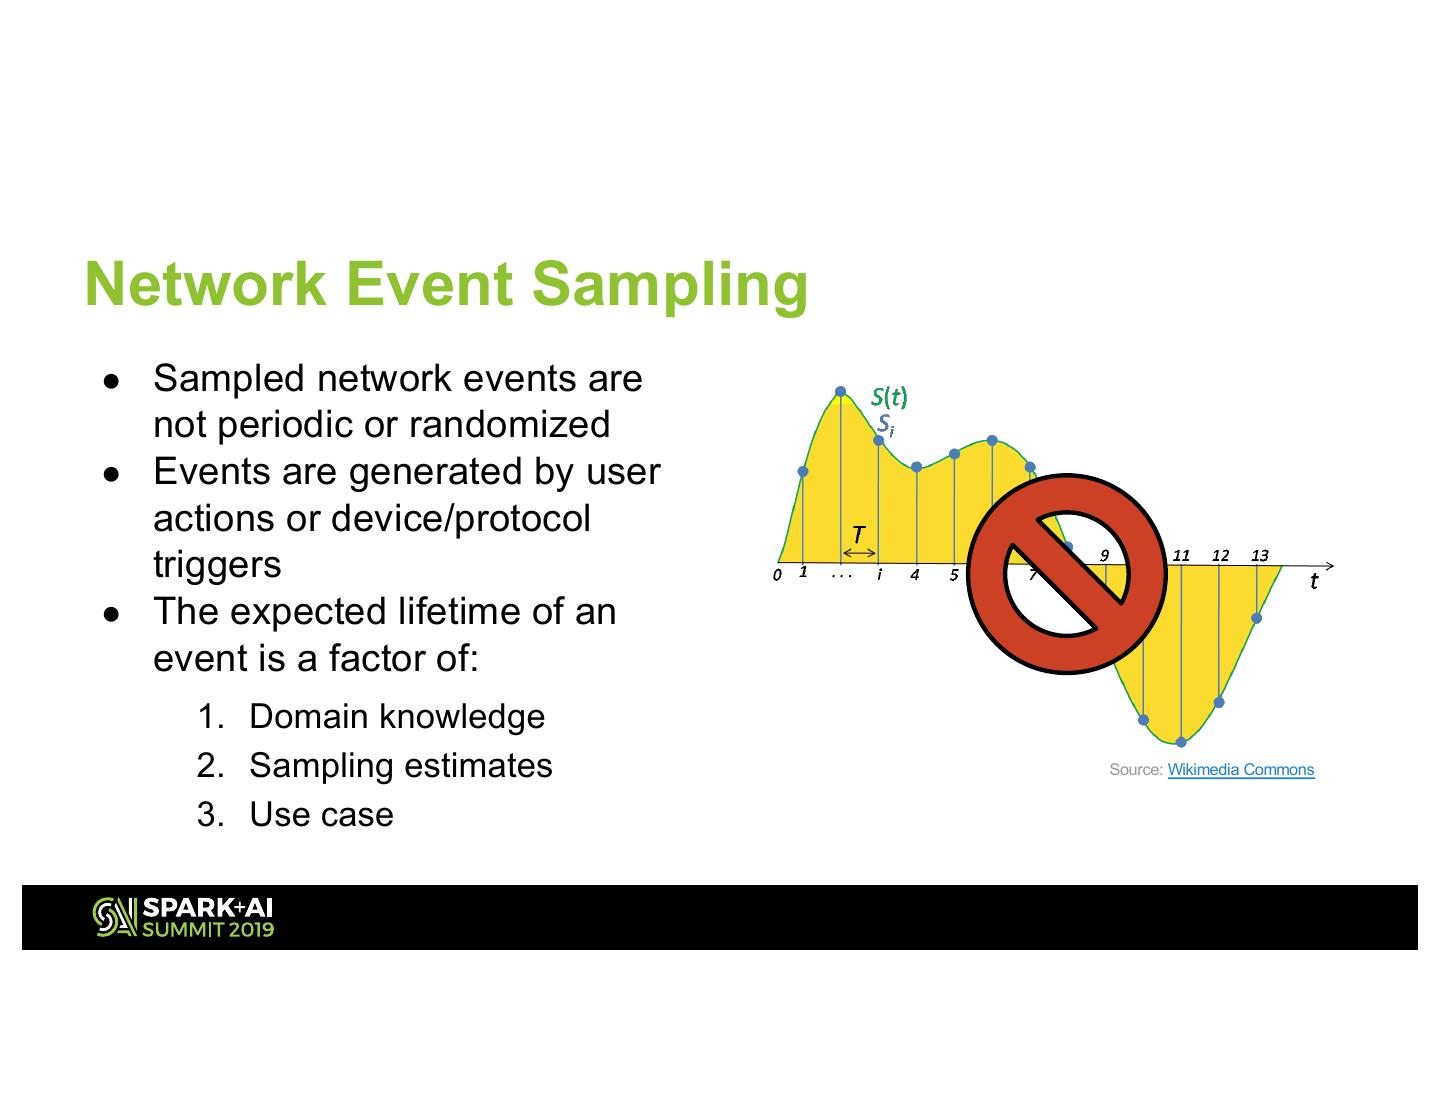
8 .Network Event Sampling ● Sampled network events are not periodic or randomized ● Events are generated by user actions or device/protocol triggers ● The expected lifetime of an event is a factor of: 1. Domain knowledge 2. Sampling estimates Source: Wikimedia Commons 3. Use case
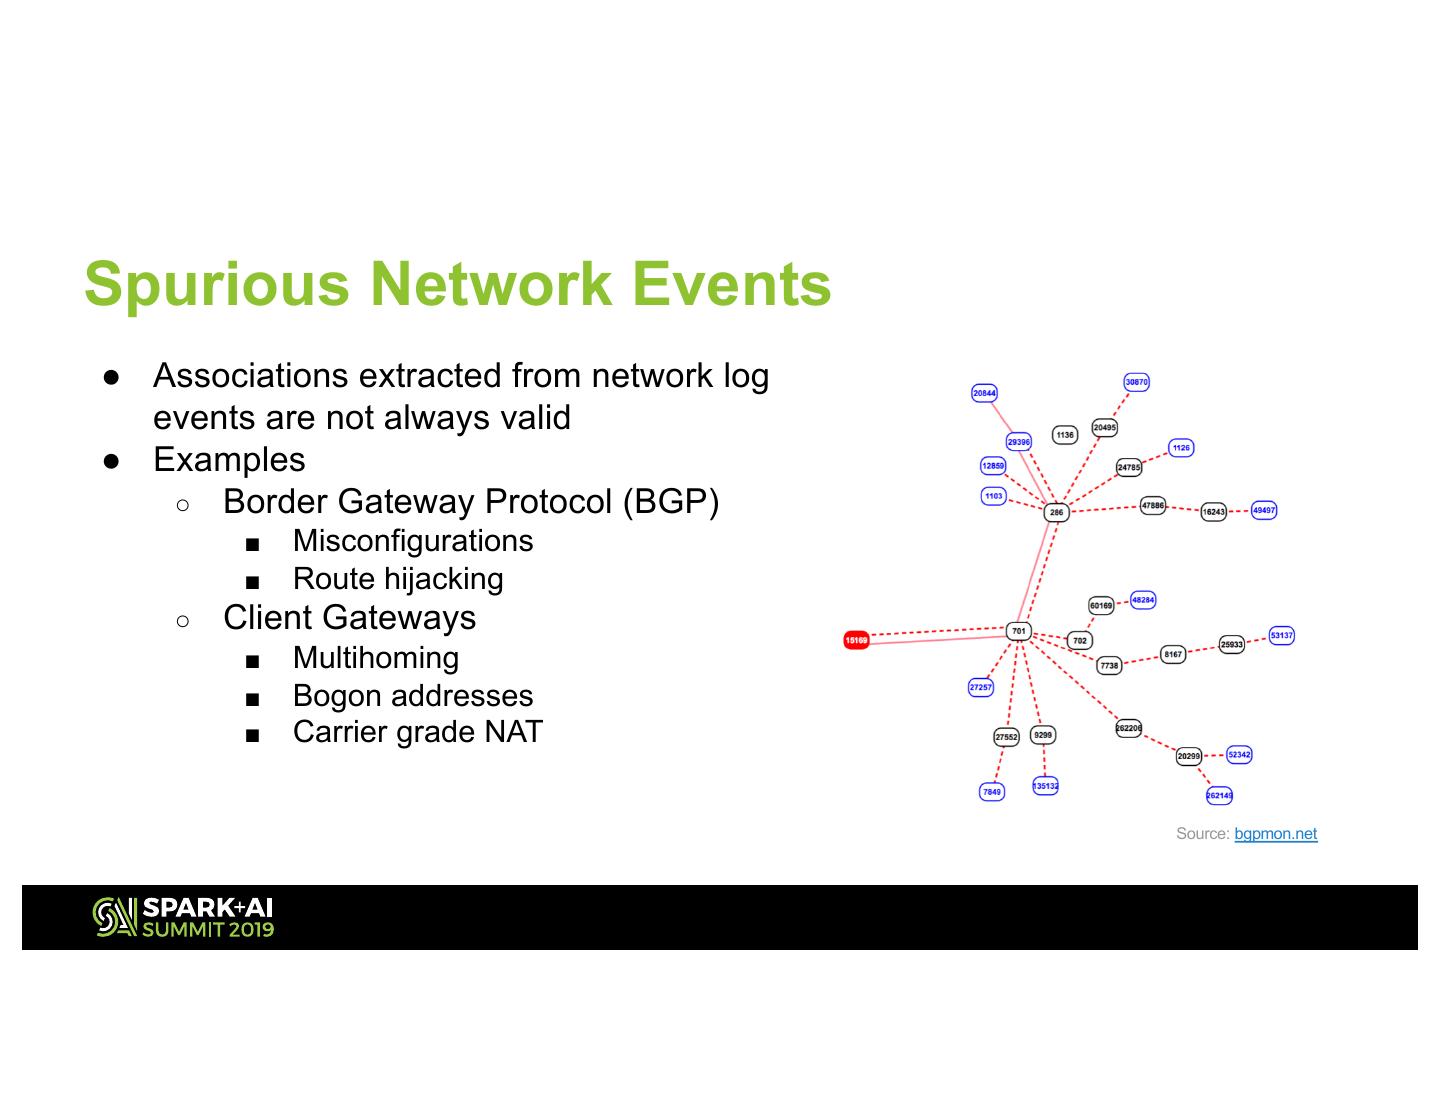
9 .Spurious Network Events ● Associations extracted from network log events are not always valid ● Examples ○ Border Gateway Protocol (BGP) ■ Misconfigurations ■ Route hijacking ○ Client Gateways ■ Multihoming ■ Bogon addresses ■ Carrier grade NAT Source: bgpmon.net
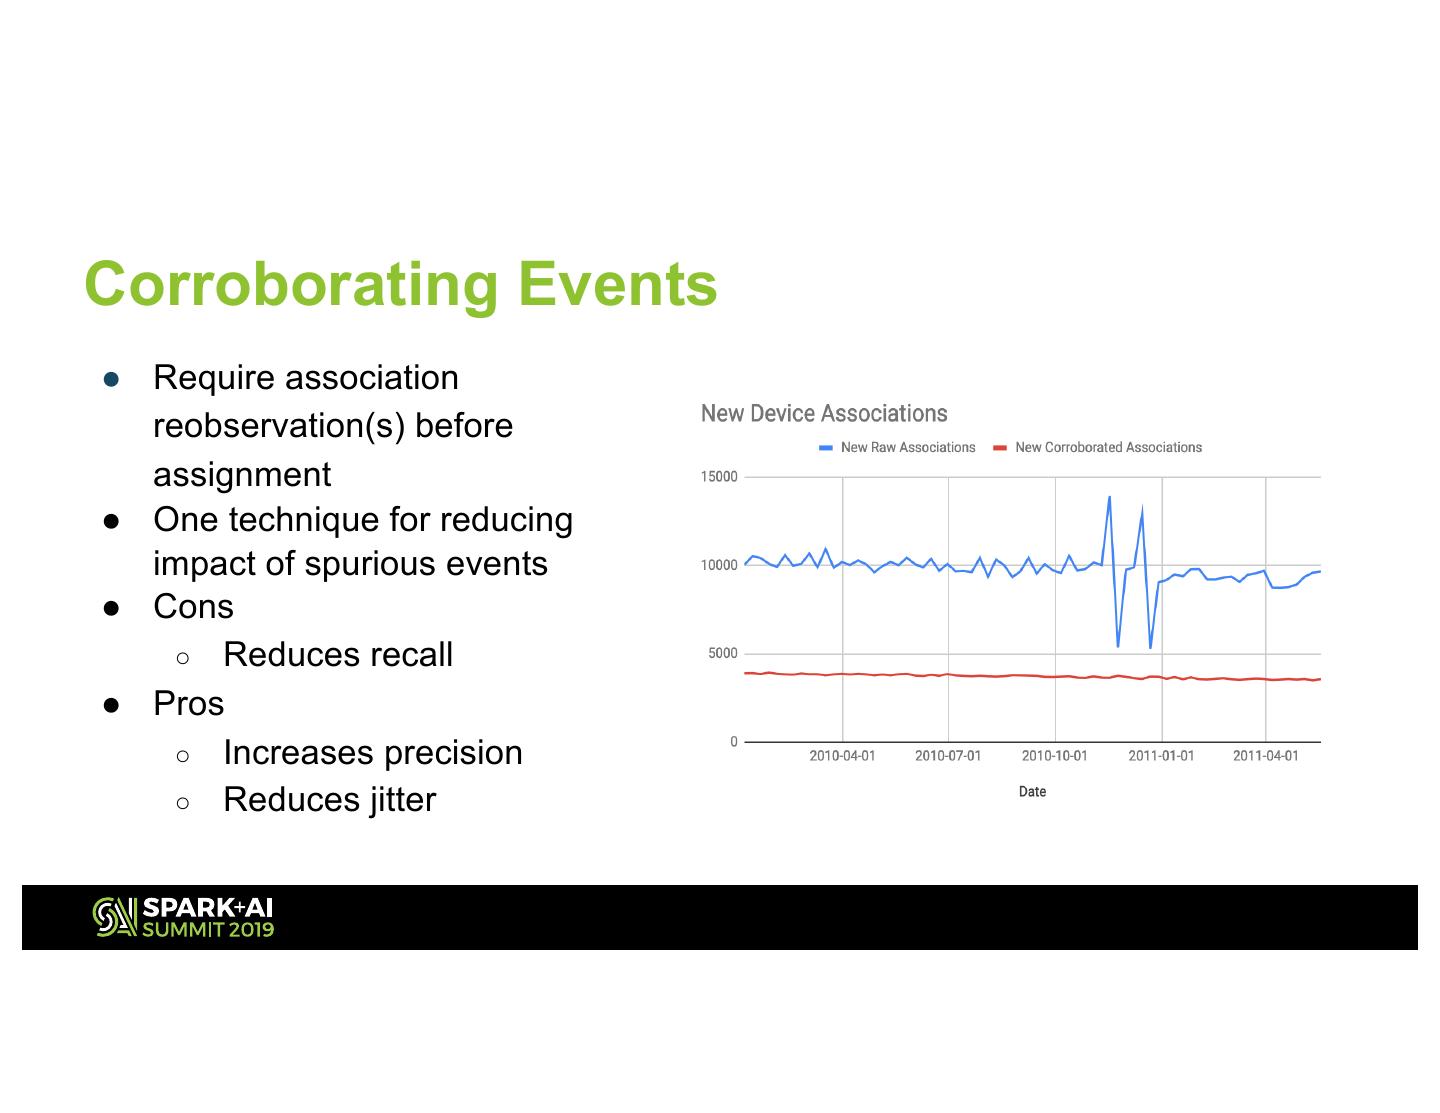
10 .Corroborating Events ● Require association reobservation(s) before assignment ● One technique for reducing impact of spurious events ● Cons ○ Reduces recall ● Pros ○ Increases precision ○ Reduces jitter
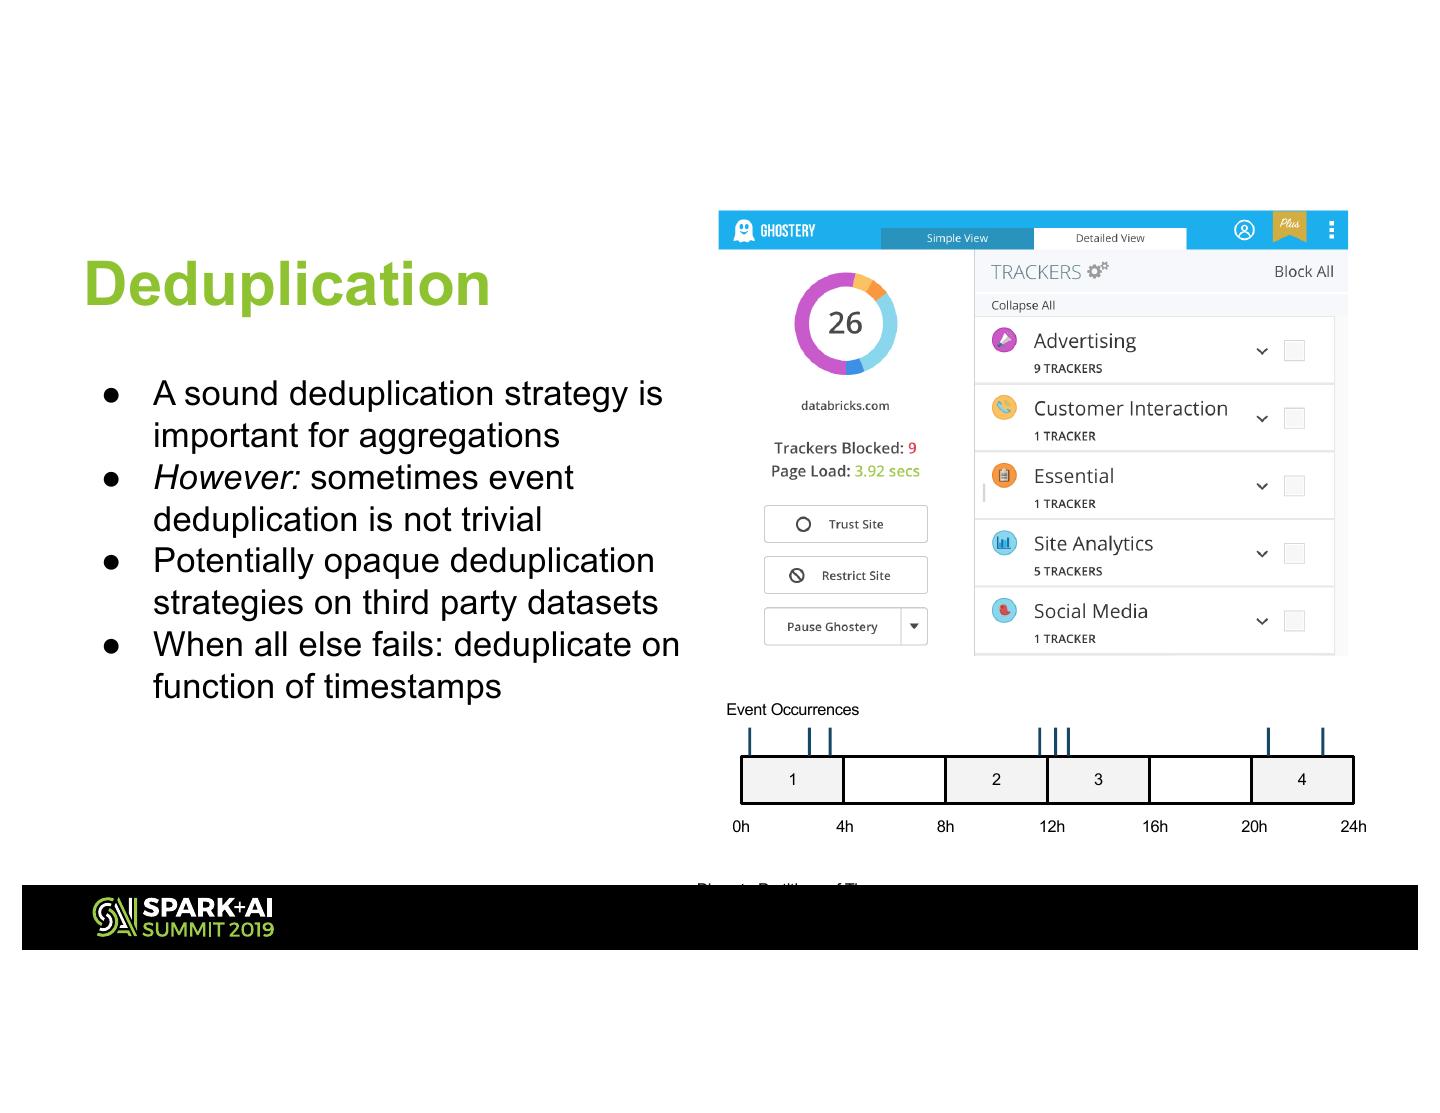
11 .Deduplication ● A sound deduplication strategy is important for aggregations ● However: sometimes event deduplication is not trivial ● Potentially opaque deduplication strategies on third party datasets ● When all else fails: deduplicate on function of timestamps Event Occurrences 1 2 3 4 0h 4h 8h 12h 16h 20h 24h Discrete Partitions of Time
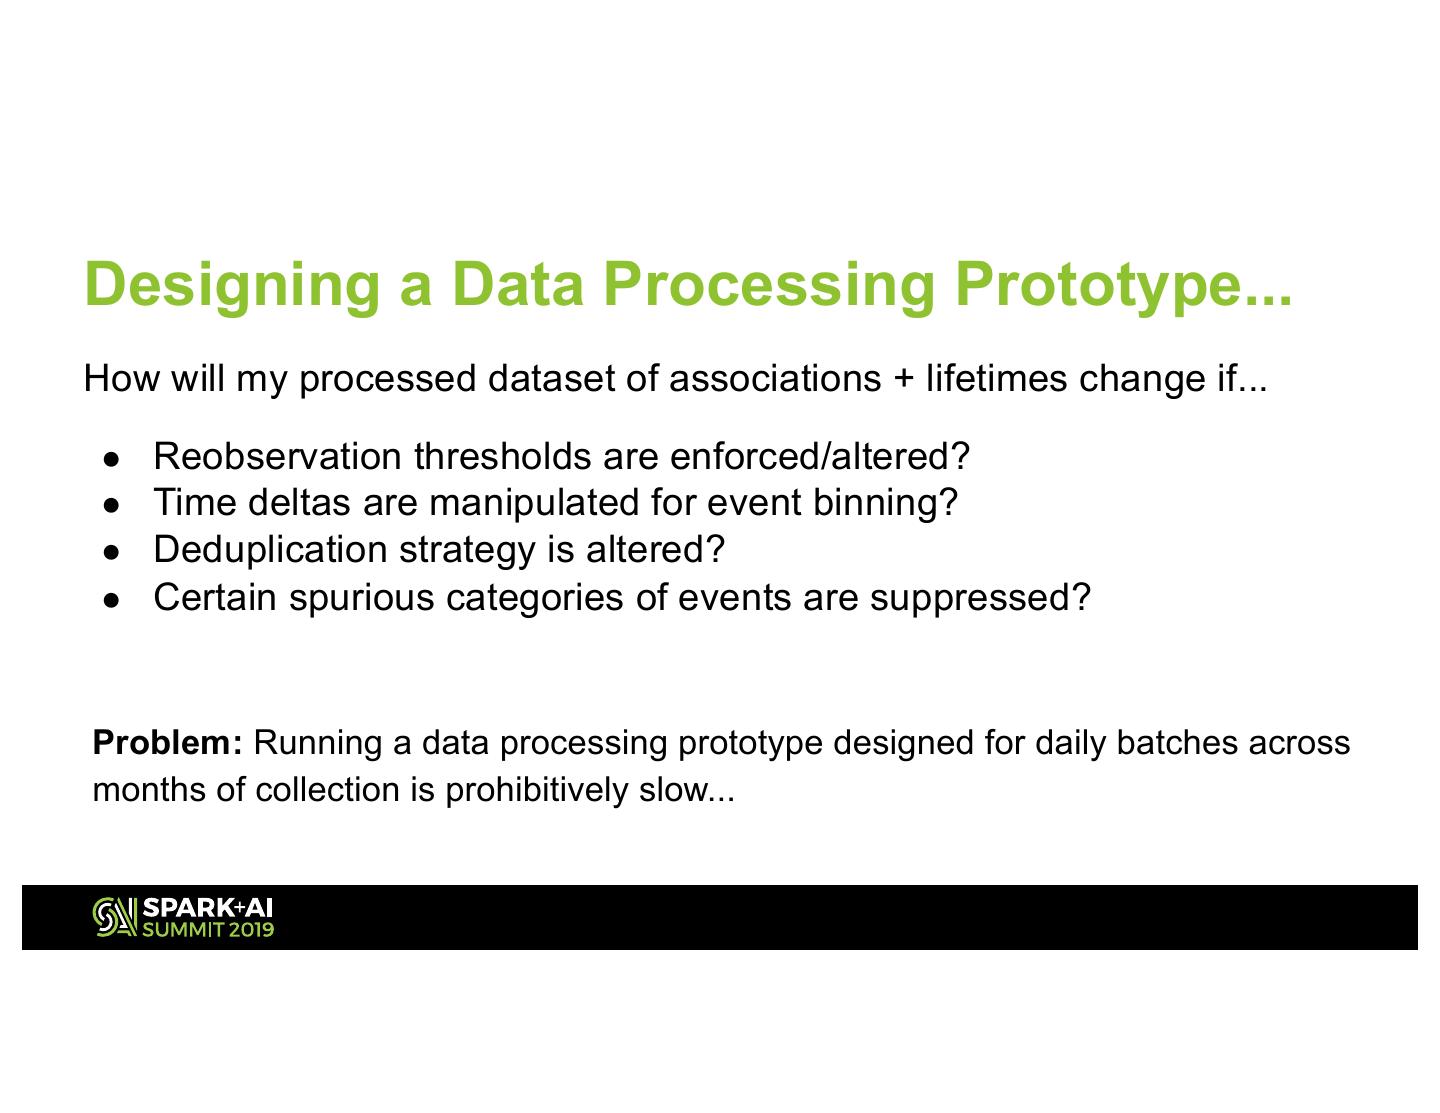
12 .Designing a Data Processing Prototype... How will my processed dataset of associations + lifetimes change if... ● Reobservation thresholds are enforced/altered? ● Time deltas are manipulated for event binning? ● Deduplication strategy is altered? ● Certain spurious categories of events are suppressed? Problem: Running a data processing prototype designed for daily batches across months of collection is prohibitively slow...
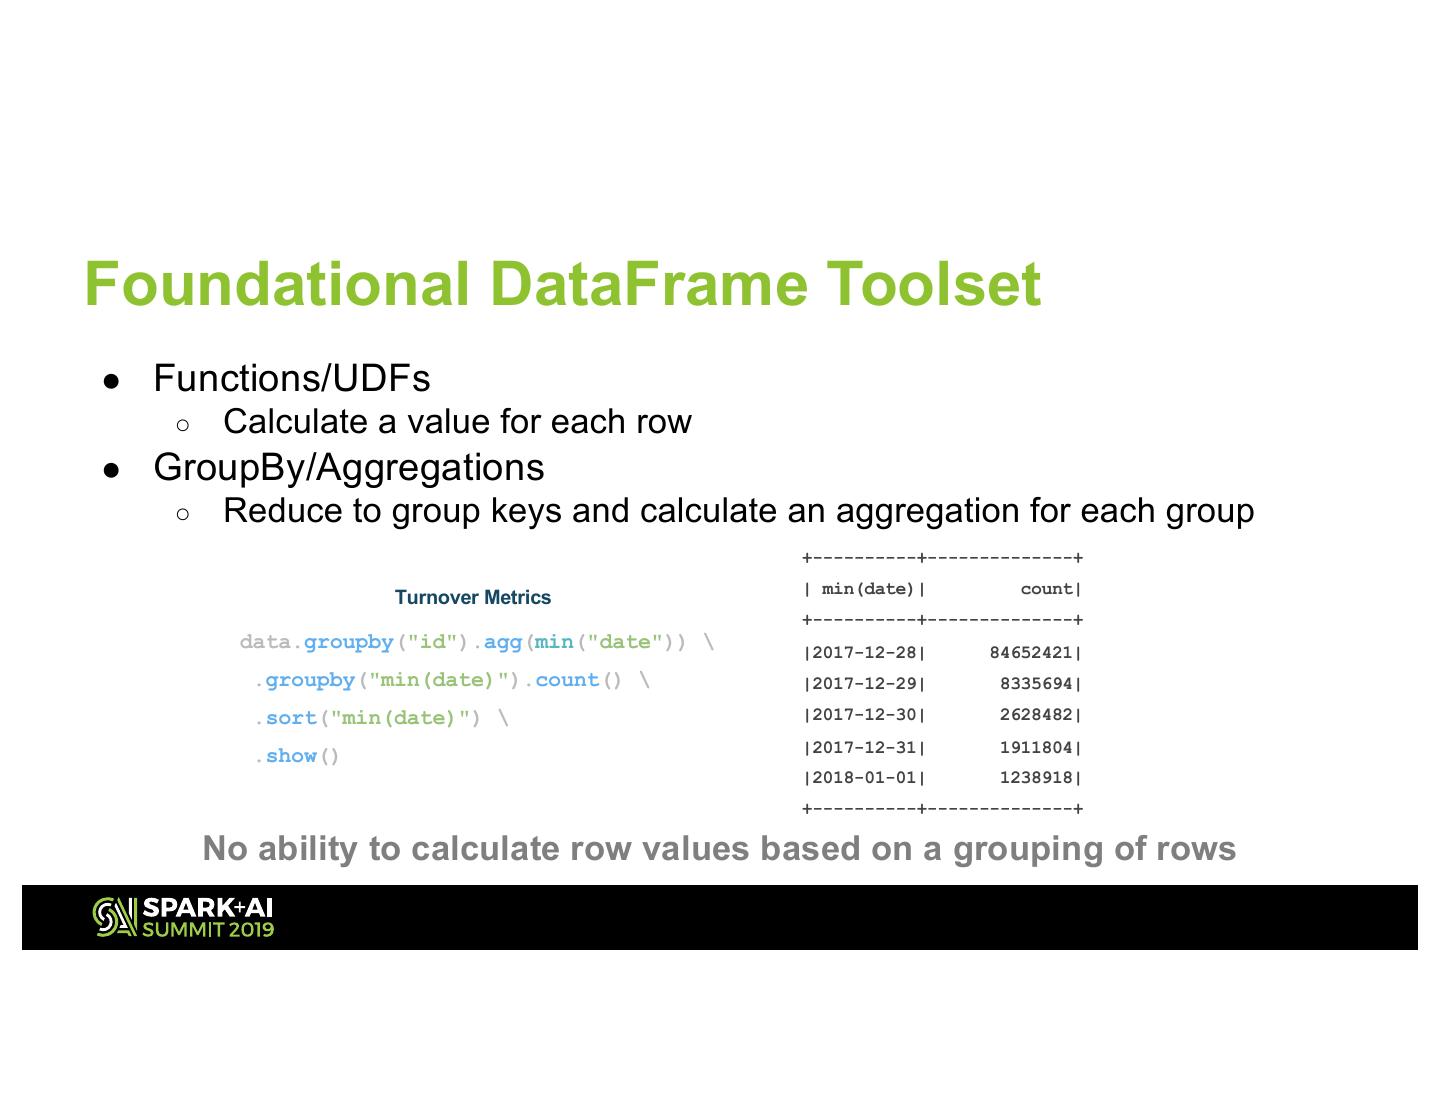
13 .Foundational DataFrame Toolset ● Functions/UDFs ○ Calculate a value for each row ● GroupBy/Aggregations ○ Reduce to group keys and calculate an aggregation for each group +----------+--------------+ | min(date)| count| Turnover Metrics +----------+--------------+ data.groupby("id").agg(min("date")) \ |2017-12-28| 84652421| .groupby("min(date)").count() \ |2017-12-29| 8335694| .sort("min(date)") \ |2017-12-30| 2628482| |2017-12-31| 1911804| .show() |2018-01-01| 1238918| +----------+--------------+ No ability to calculate row values based on a grouping of rows
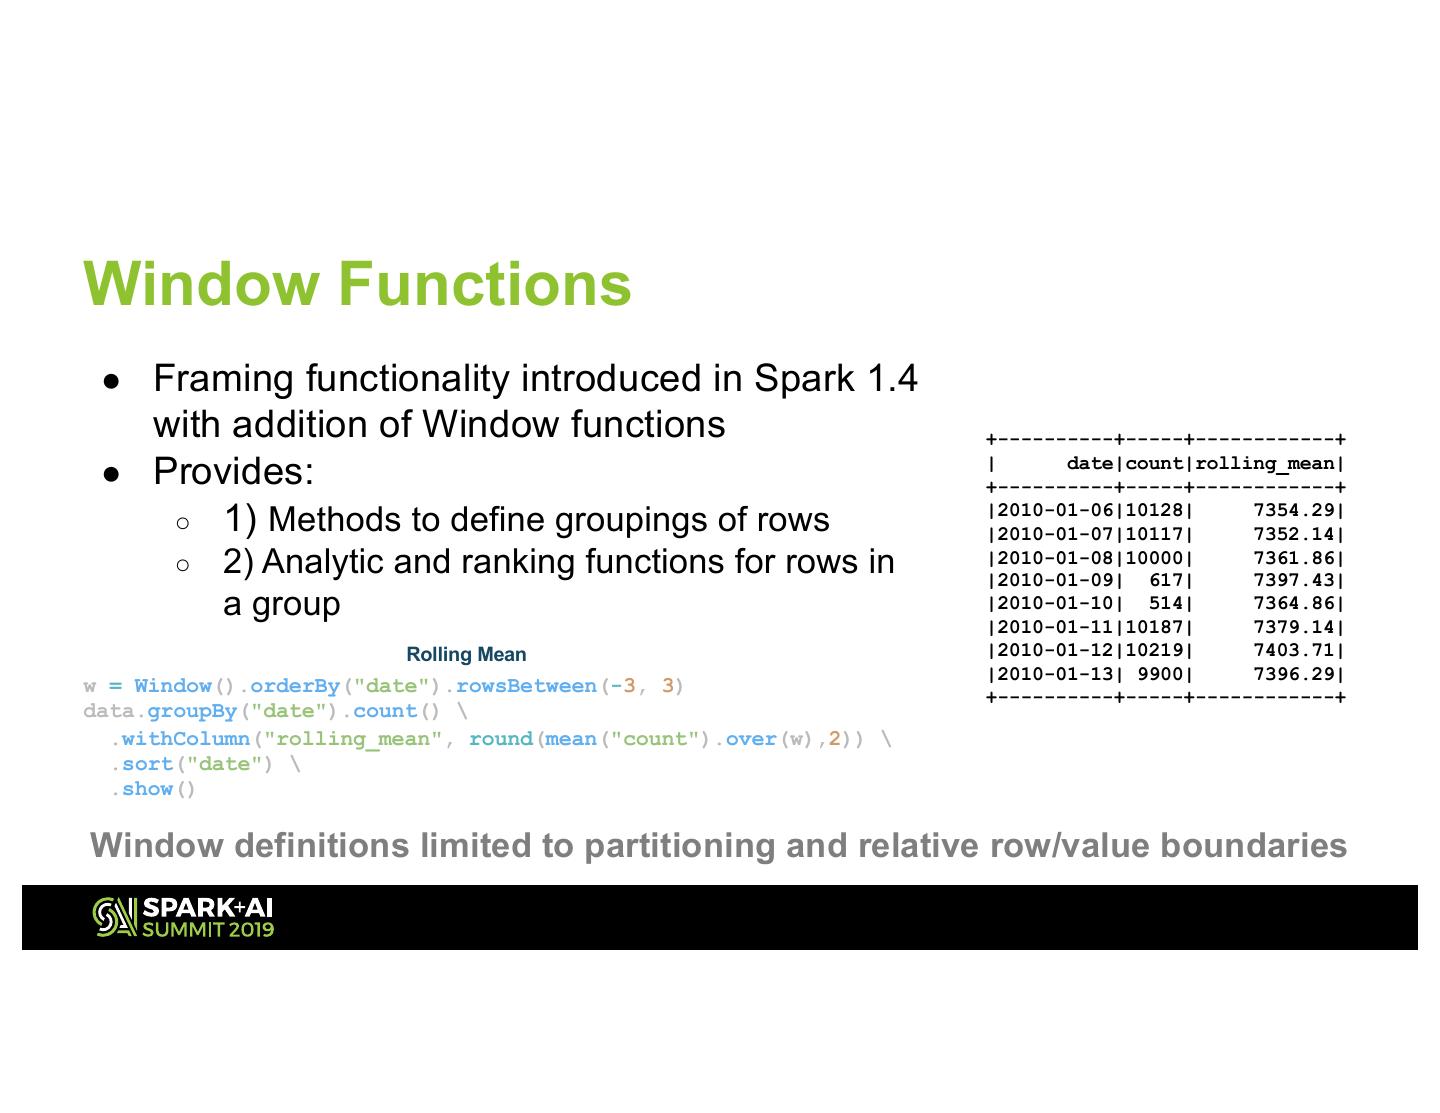
14 .Window Functions ● Framing functionality introduced in Spark 1.4 with addition of Window functions +----------+-----+------------+ ● Provides: | date|count|rolling_mean| +----------+-----+------------+ ○ 1) Methods to define groupings of rows |2010-01-06|10128| 7354.29| |2010-01-07|10117| 7352.14| ○ 2) Analytic and ranking functions for rows in |2010-01-08|10000| |2010-01-09| 617| 7361.86| 7397.43| a group |2010-01-10| 514| 7364.86| |2010-01-11|10187| 7379.14| Rolling Mean |2010-01-12|10219| 7403.71| |2010-01-13| 9900| 7396.29| w = Window().orderBy("date").rowsBetween(-3, 3) +----------+-----+------------+ data.groupBy("date").count() \ .withColumn("rolling_mean", round(mean("count").over(w),2)) \ .sort("date") \ .show() Window definitions limited to partitioning and relative row/value boundaries
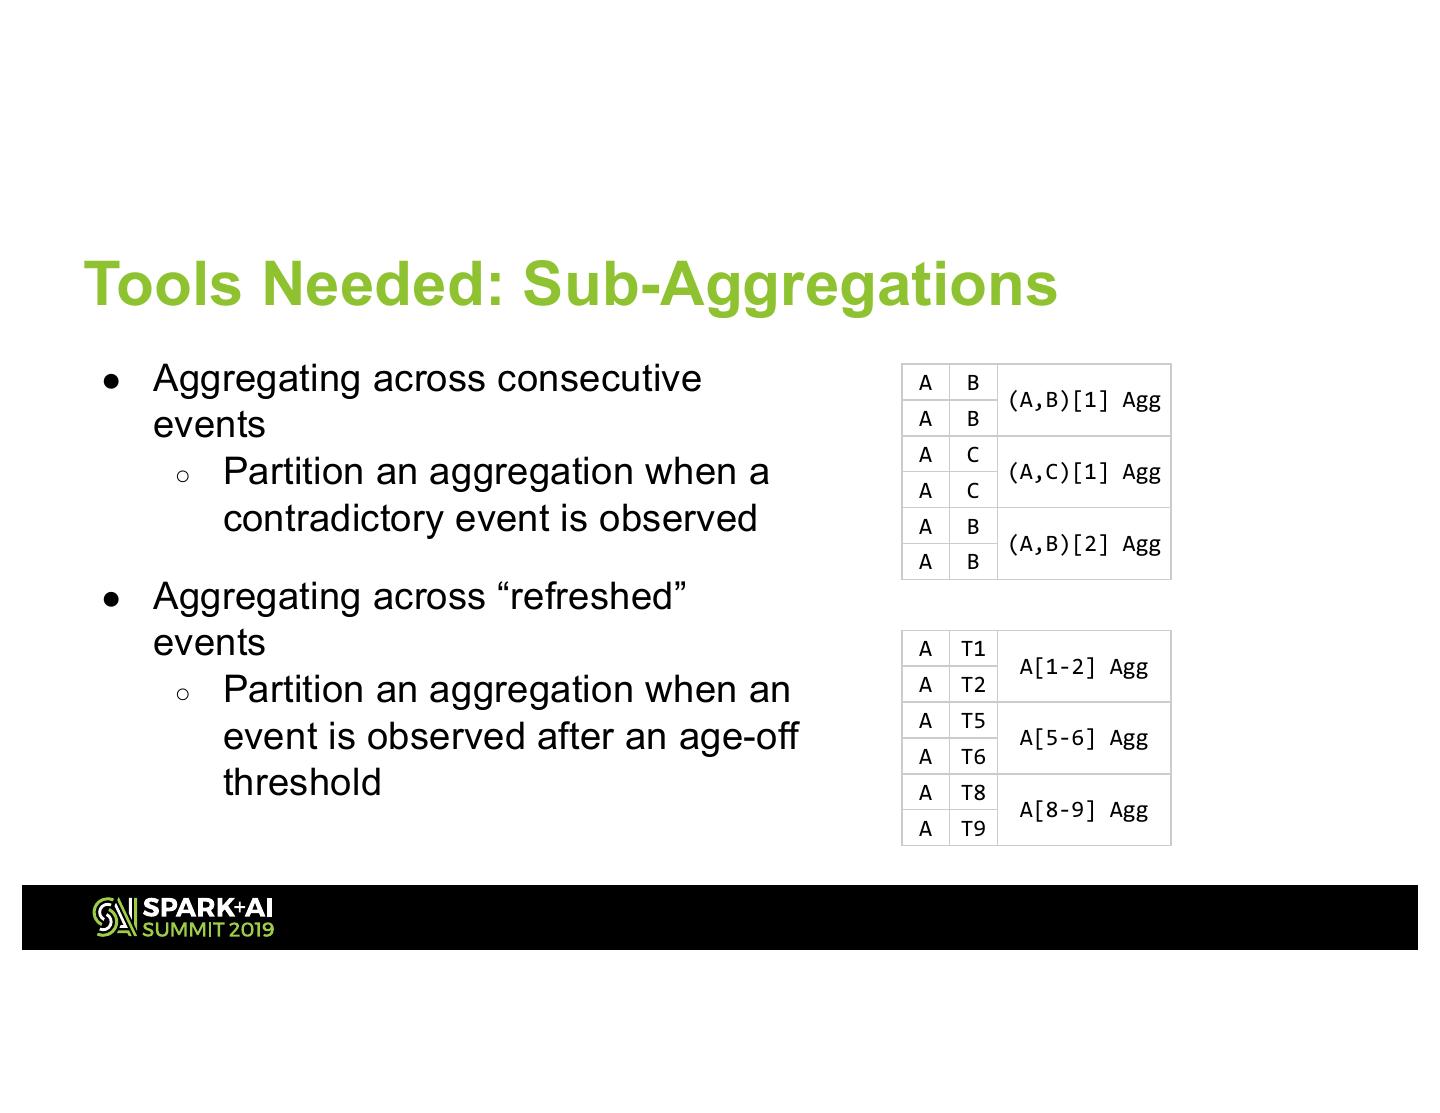
15 .Tools Needed: Sub-Aggregations ● Aggregating across consecutive A B (A,B)[1] Agg events A B A C ○ Partition an aggregation when a (A,C)[1] Agg A C contradictory event is observed A B (A,B)[2] Agg A B ● Aggregating across “refreshed” events A T1 A[1-2] Agg ○ Partition an aggregation when an A T2 A T5 event is observed after an age-off A T6 A[5-6] Agg threshold A T8 A[8-9] Agg A T9
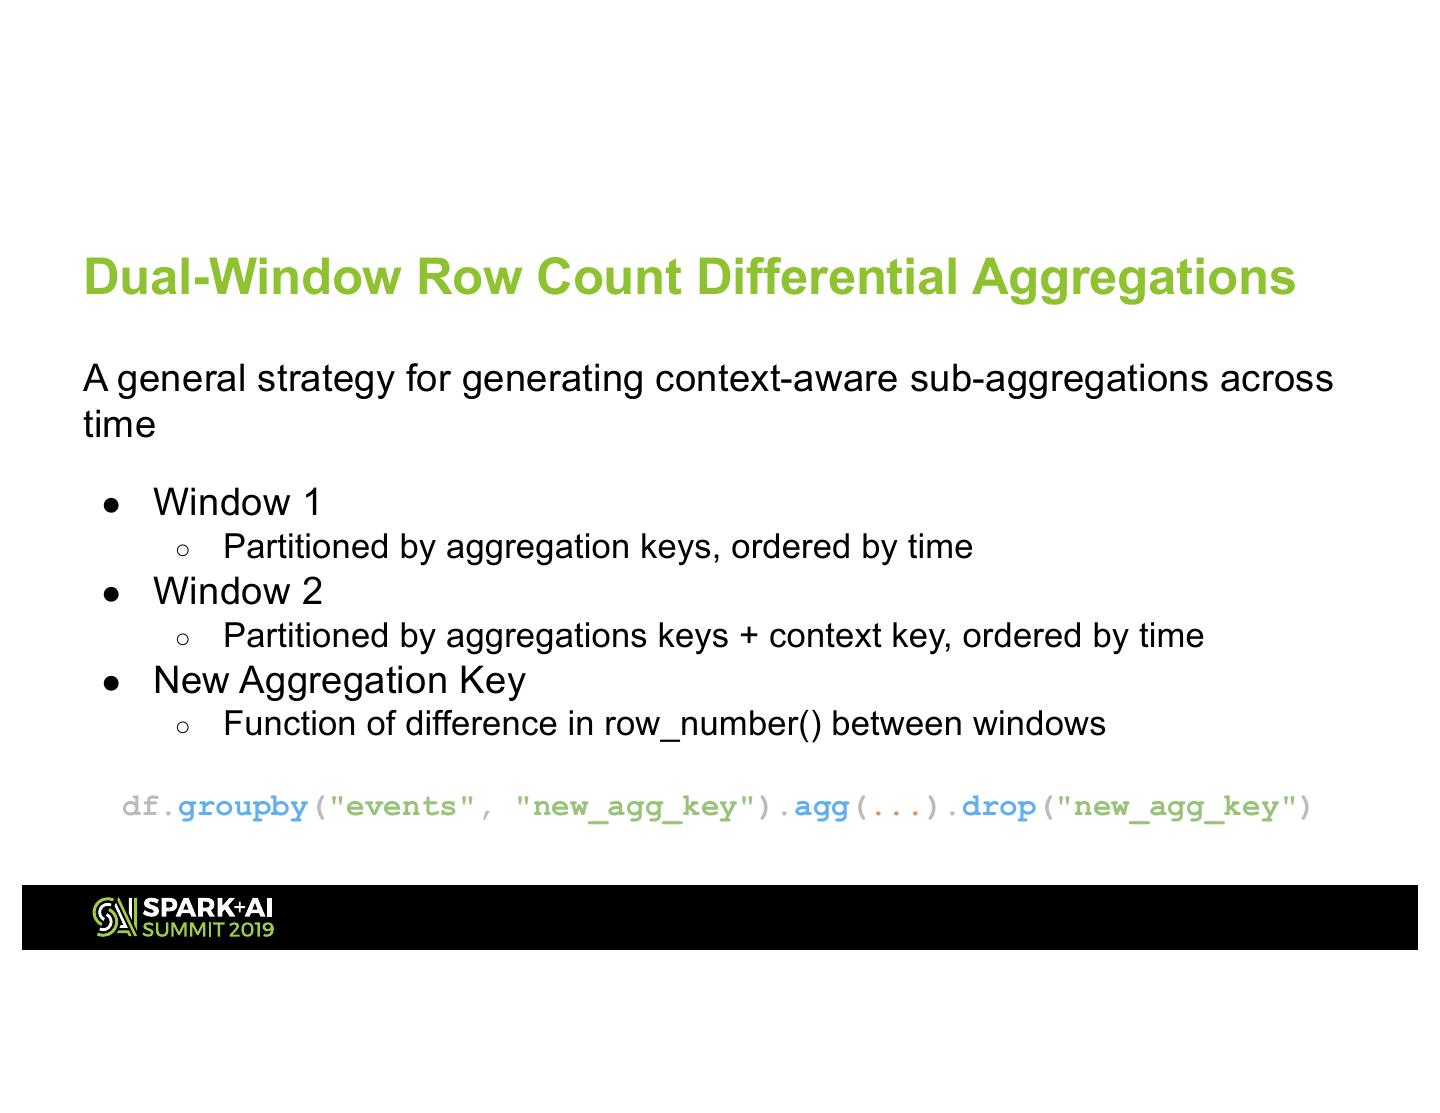
16 .Dual-Window Row Count Differential Aggregations A general strategy for generating context-aware sub-aggregations across time ● Window 1 ○ Partitioned by aggregation keys, ordered by time ● Window 2 ○ Partitioned by aggregations keys + context key, ordered by time ● New Aggregation Key ○ Function of difference in row_number() between windows df.groupby("events", "new_agg_key").agg(...).drop("new_agg_key")
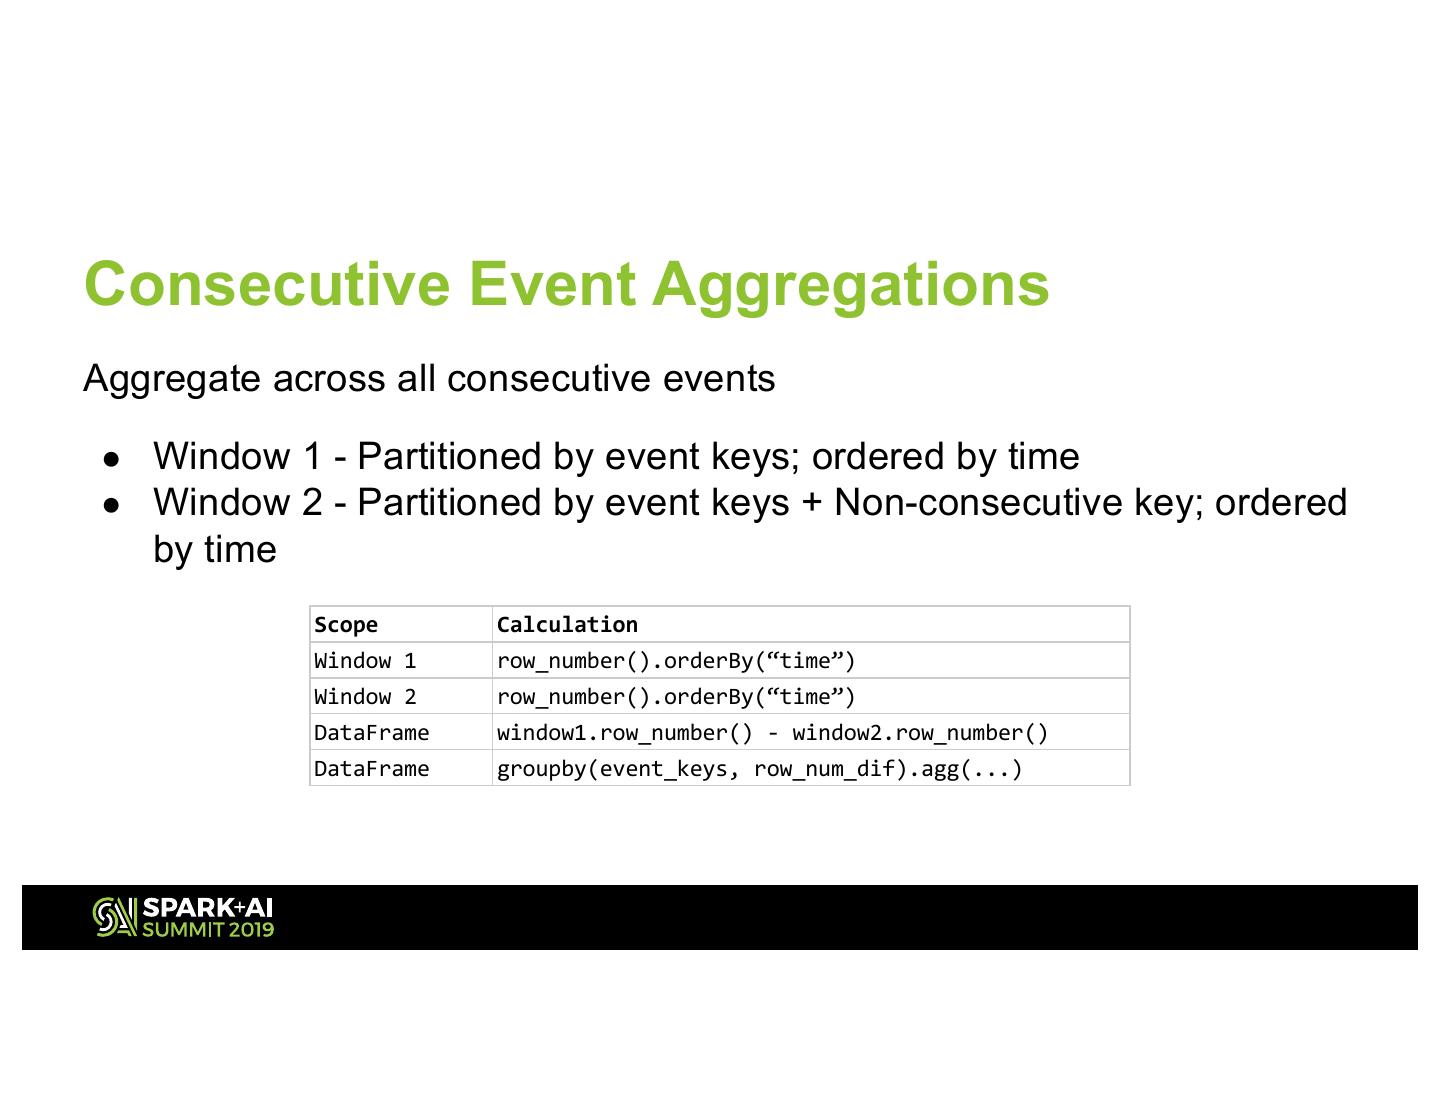
17 .Consecutive Event Aggregations Aggregate across all consecutive events ● Window 1 - Partitioned by event keys; ordered by time ● Window 2 - Partitioned by event keys + Non-consecutive key; ordered by time Scope Calculation Window 1 row_number().orderBy(“time”) Window 2 row_number().orderBy(“time”) DataFrame window1.row_number() - window2.row_number() DataFrame groupby(event_keys, row_num_dif).agg(...)
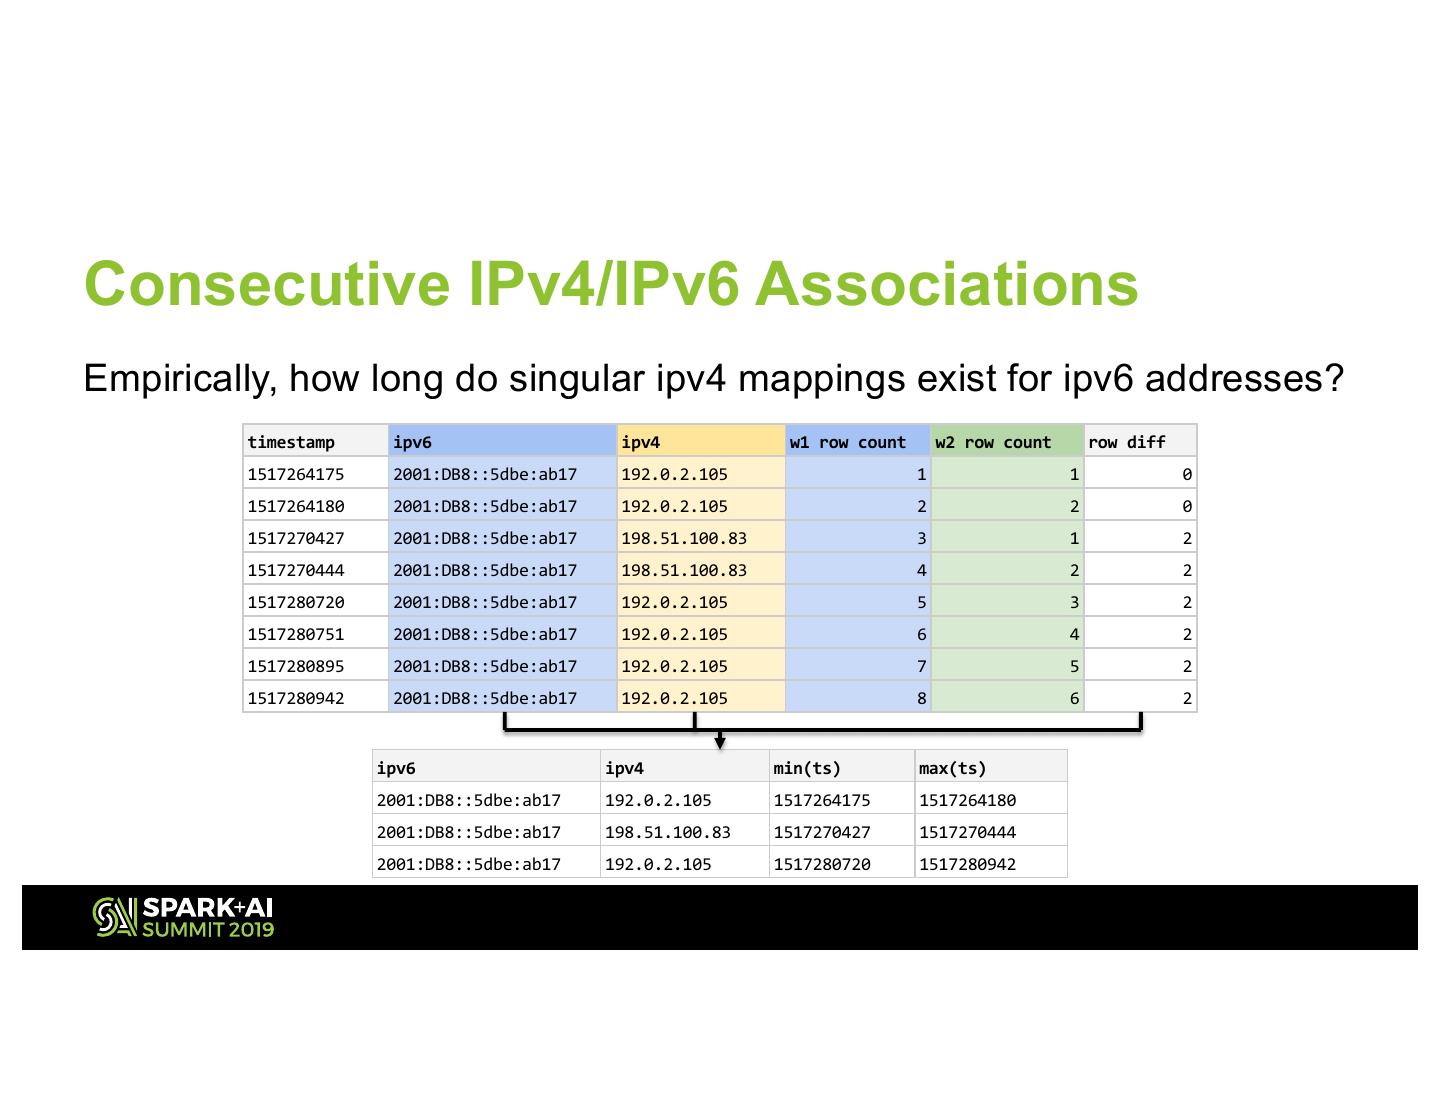
18 .Consecutive IPv4/IPv6 Associations Empirically, how long do singular ipv4 mappings exist for ipv6 addresses? timestamp ipv6 ipv4 w1 row count w2 row count row diff 1517264175 2001:DB8::5dbe:ab17 192.0.2.105 1 1 0 1517264180 2001:DB8::5dbe:ab17 192.0.2.105 2 2 0 1517270427 2001:DB8::5dbe:ab17 198.51.100.83 3 1 2 1517270444 2001:DB8::5dbe:ab17 198.51.100.83 4 2 2 1517280720 2001:DB8::5dbe:ab17 192.0.2.105 5 3 2 1517280751 2001:DB8::5dbe:ab17 192.0.2.105 6 4 2 1517280895 2001:DB8::5dbe:ab17 192.0.2.105 7 5 2 1517280942 2001:DB8::5dbe:ab17 192.0.2.105 8 6 2 ipv6 ipv4 min(ts) max(ts) 2001:DB8::5dbe:ab17 192.0.2.105 1517264175 1517264180 2001:DB8::5dbe:ab17 198.51.100.83 1517270427 1517270444 2001:DB8::5dbe:ab17 192.0.2.105 1517280720 1517280942
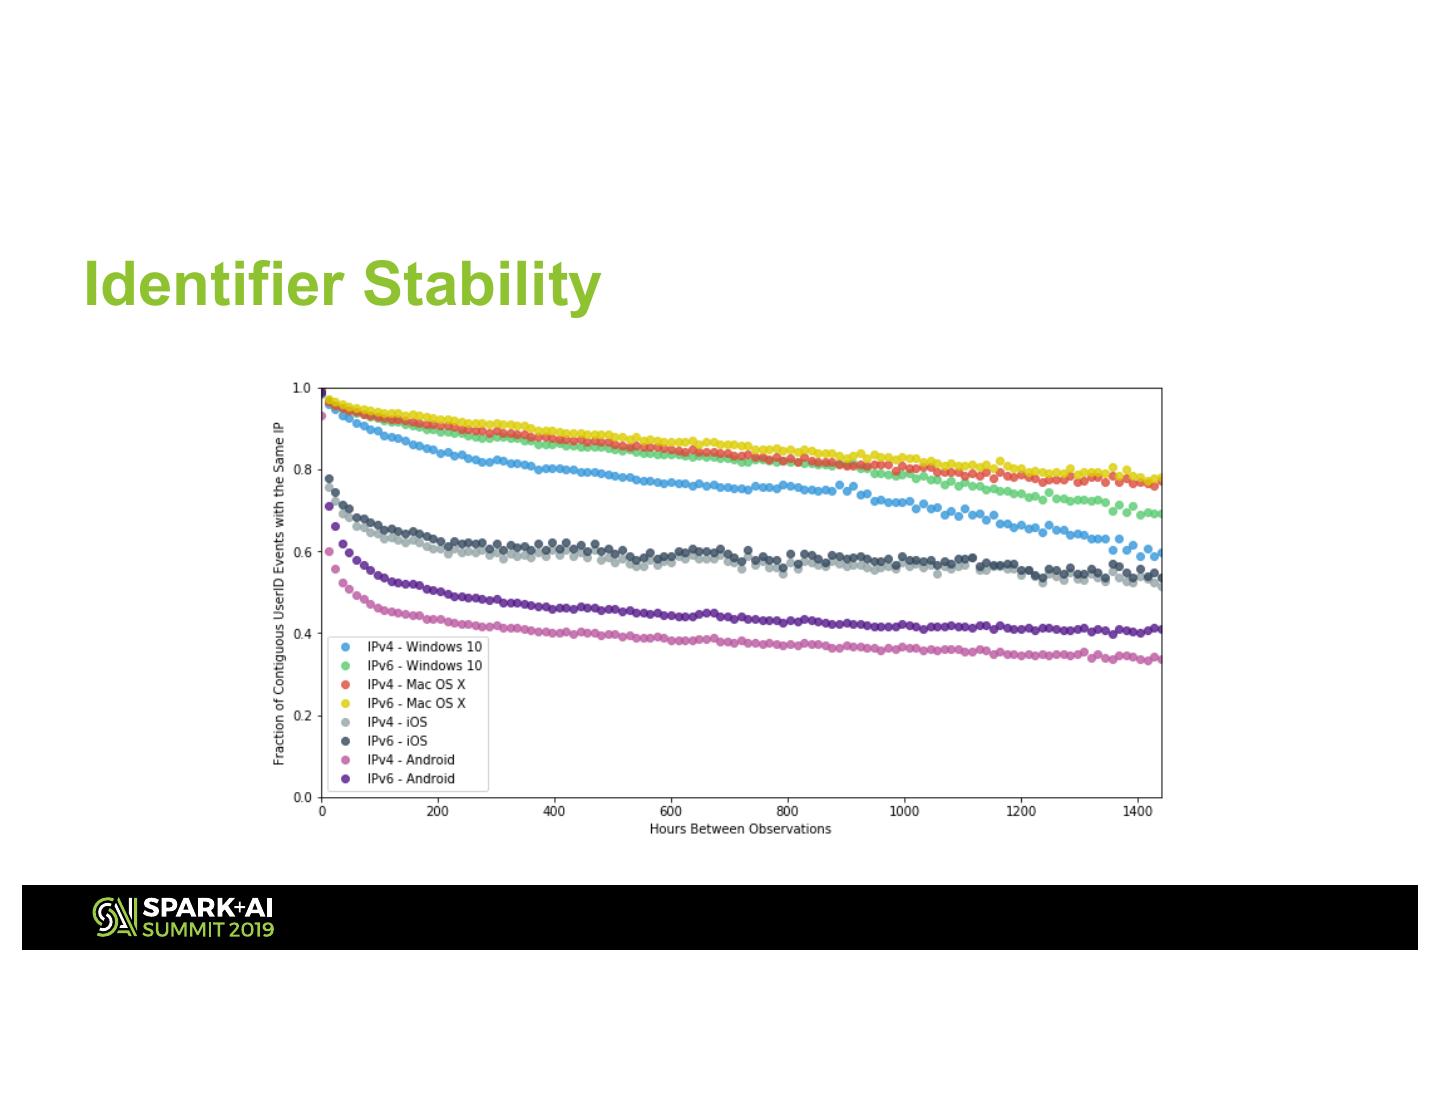
19 .Identifier Stability
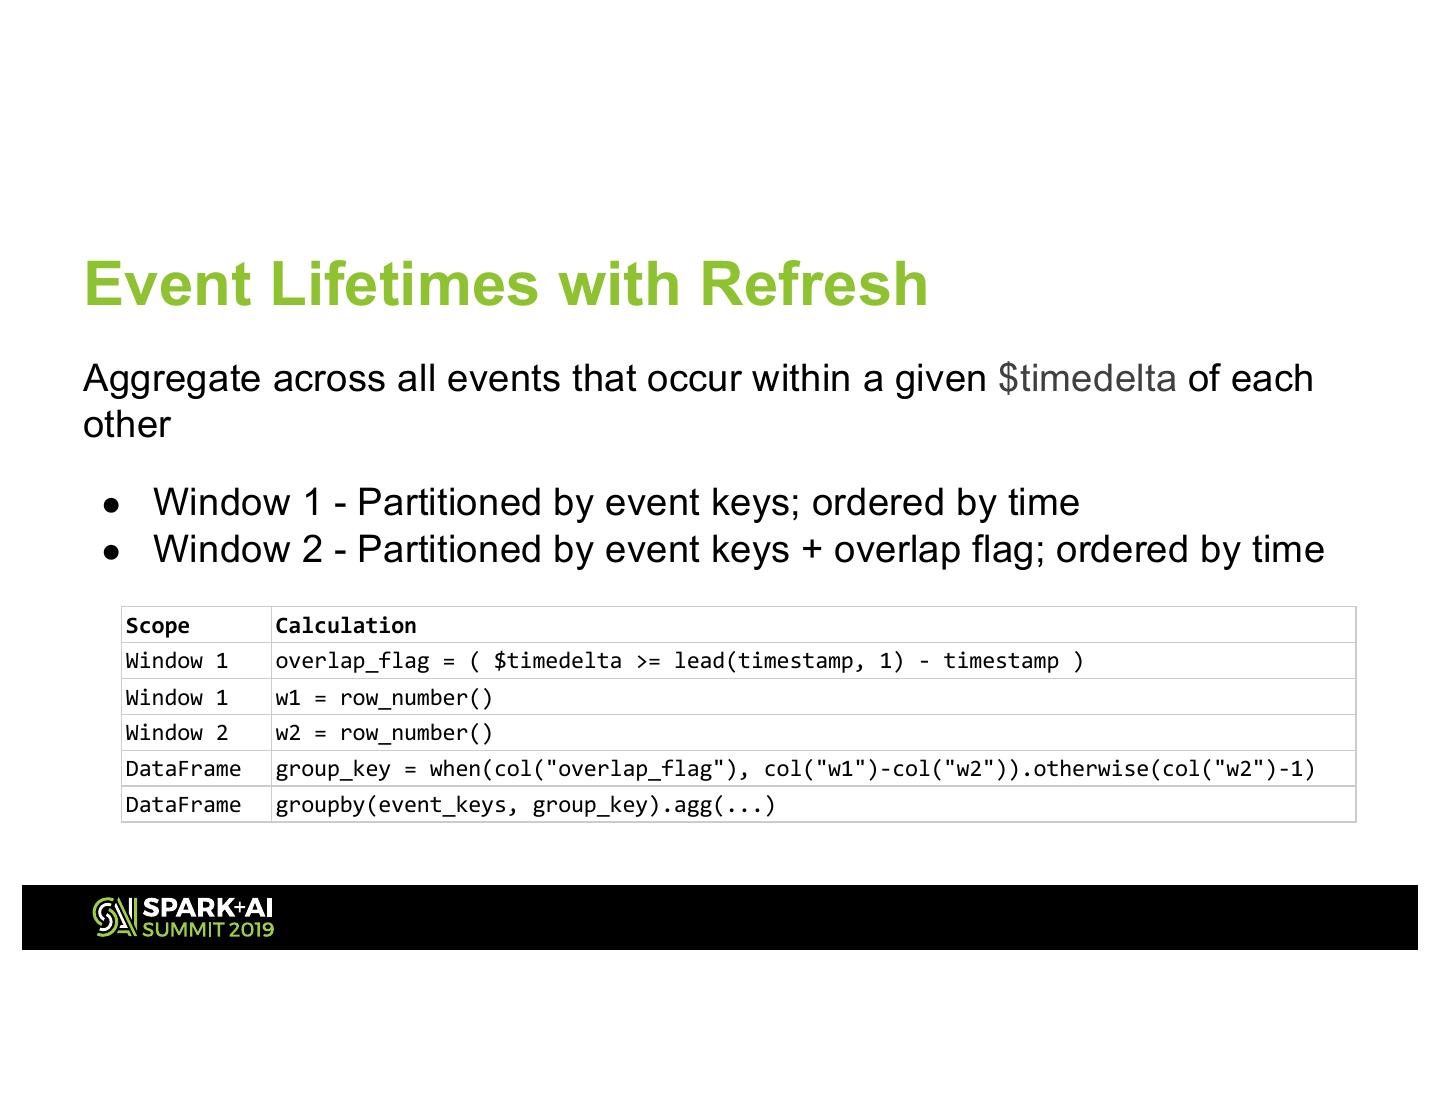
20 .Event Lifetimes with Refresh Aggregate across all events that occur within a given $timedelta of each other ● Window 1 - Partitioned by event keys; ordered by time ● Window 2 - Partitioned by event keys + overlap flag; ordered by time Scope Calculation Window 1 overlap_flag = ( $timedelta >= lead(timestamp, 1) - timestamp ) Window 1 w1 = row_number() Window 2 w2 = row_number() DataFrame group_key = when(col("overlap_flag"), col("w1")-col("w2")).otherwise(col("w2")-1) DataFrame groupby(event_keys, group_key).agg(...)
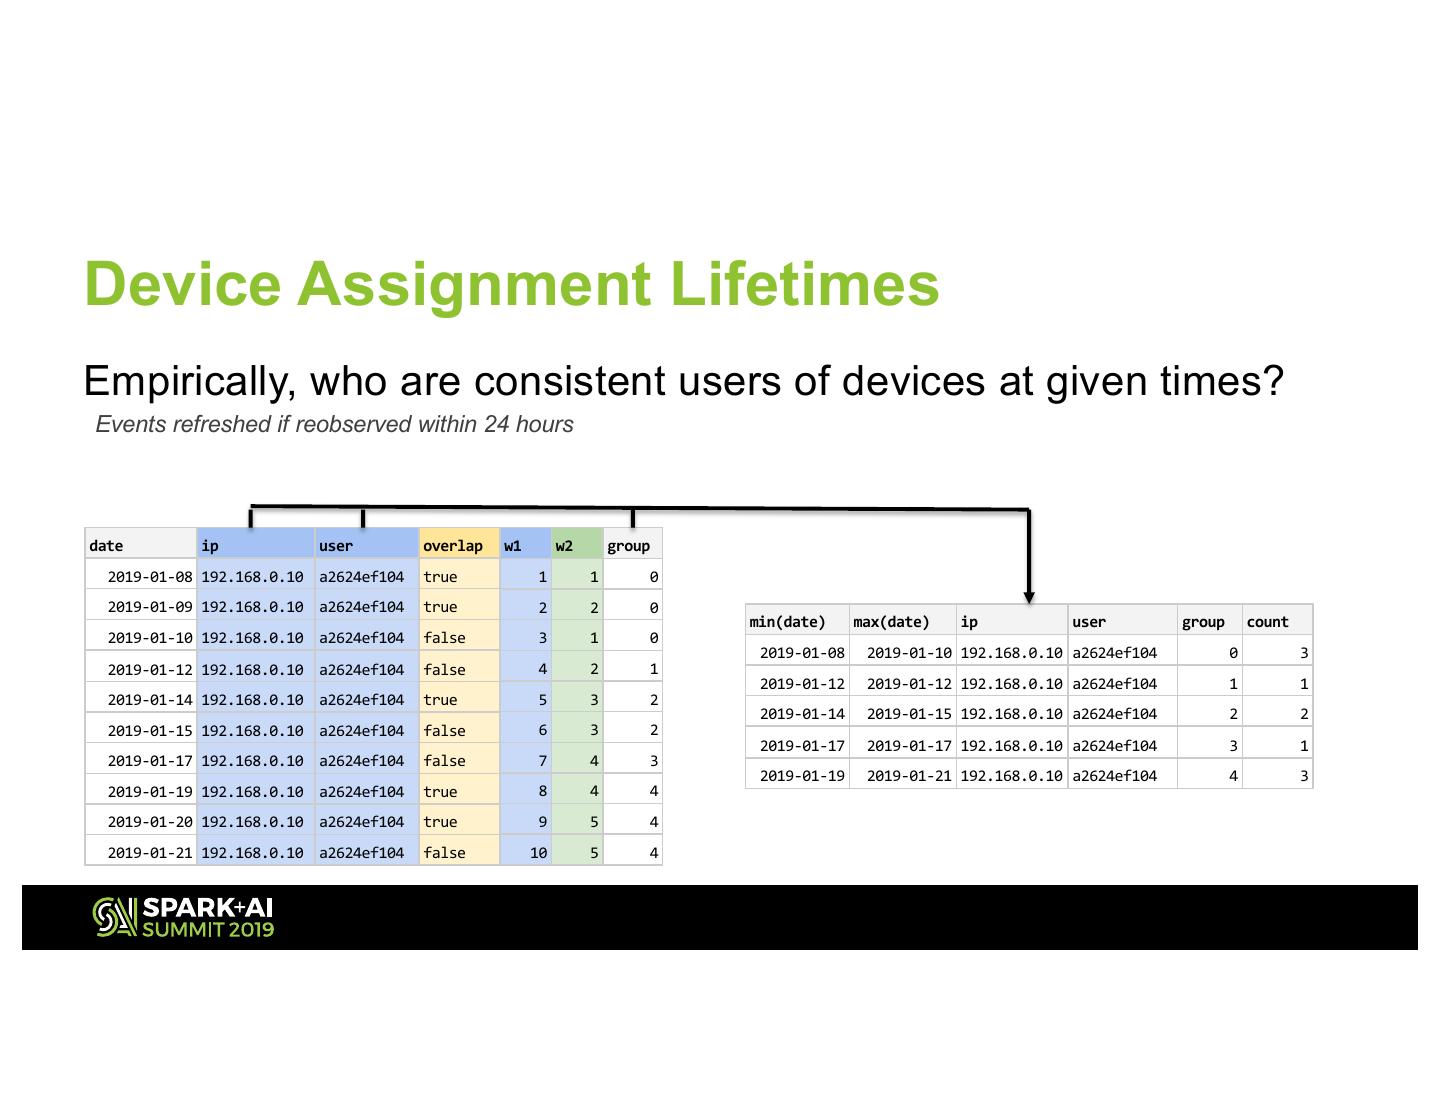
21 .Device Assignment Lifetimes Empirically, who are consistent users of devices at given times? Events refreshed if reobserved within 24 hours date ip user overlap w1 w2 group 2019-01-08 192.168.0.10 a2624ef104 true 1 1 0 2019-01-09 192.168.0.10 a2624ef104 true 2 2 0 min(date) max(date) ip user group count 2019-01-10 192.168.0.10 a2624ef104 false 3 1 0 2019-01-08 2019-01-10 192.168.0.10 a2624ef104 0 3 2019-01-12 192.168.0.10 a2624ef104 false 4 2 1 2019-01-12 2019-01-12 192.168.0.10 a2624ef104 1 1 2019-01-14 192.168.0.10 a2624ef104 true 5 3 2 2019-01-14 2019-01-15 192.168.0.10 a2624ef104 2 2 2019-01-15 192.168.0.10 a2624ef104 false 6 3 2 2019-01-17 2019-01-17 192.168.0.10 a2624ef104 3 1 2019-01-17 192.168.0.10 a2624ef104 false 7 4 3 2019-01-19 2019-01-21 192.168.0.10 a2624ef104 4 3 2019-01-19 192.168.0.10 a2624ef104 true 8 4 4 2019-01-20 192.168.0.10 a2624ef104 true 9 5 4 2019-01-21 192.168.0.10 a2624ef104 false 10 5 4
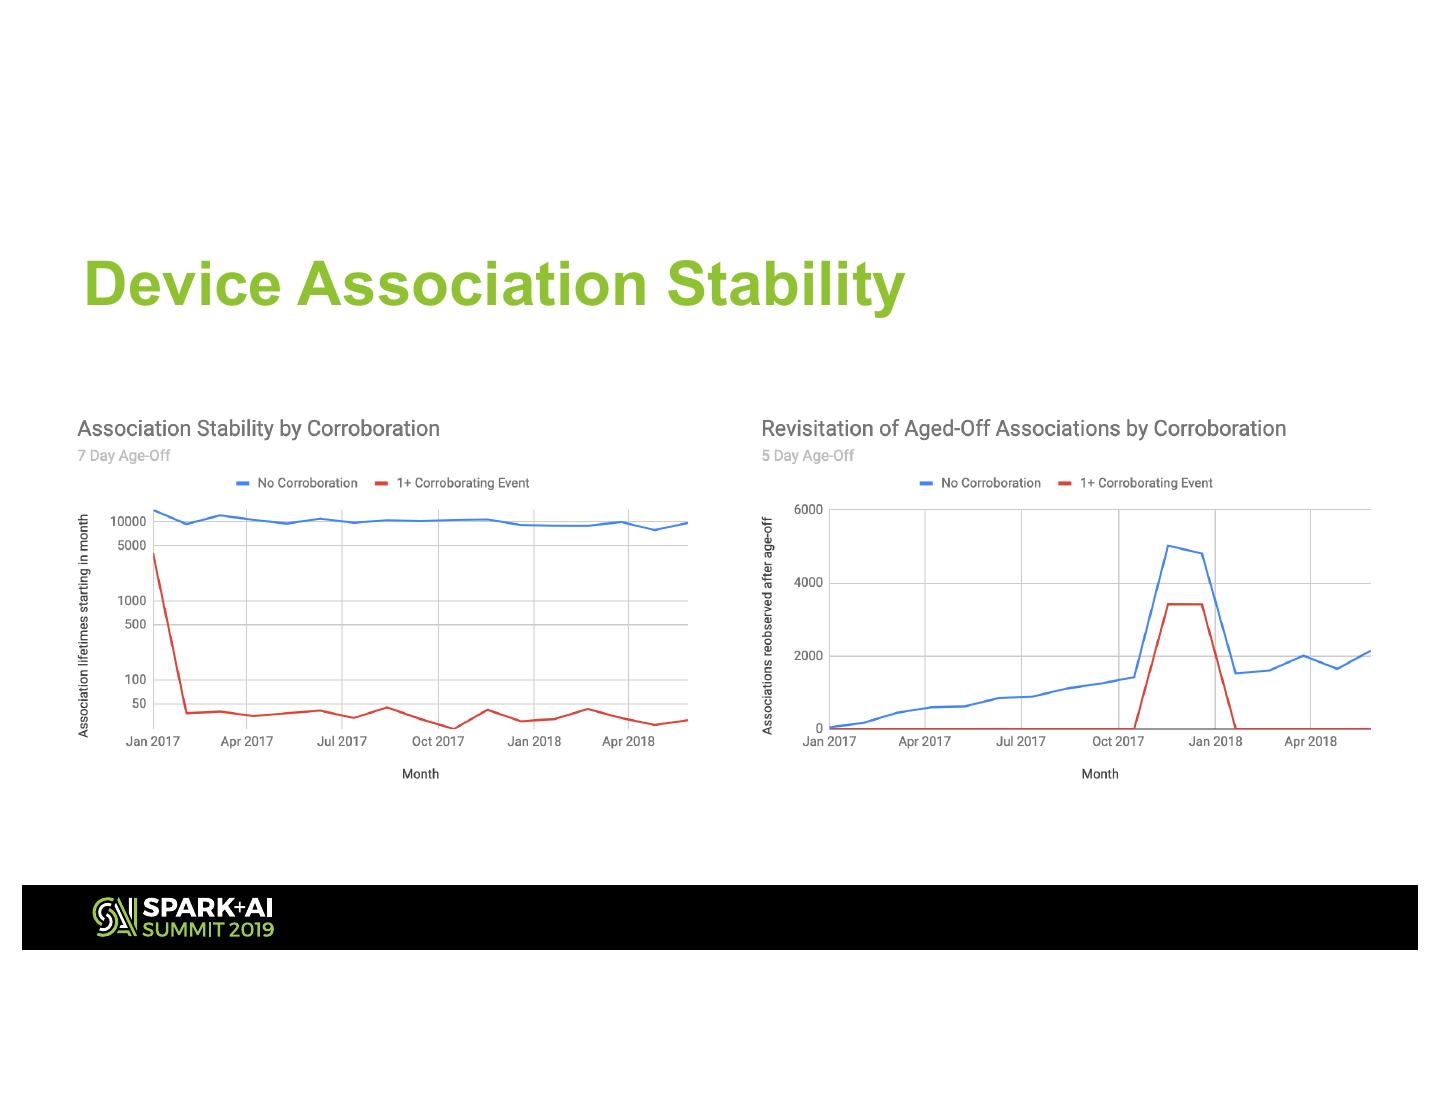
22 .Device Association Stability
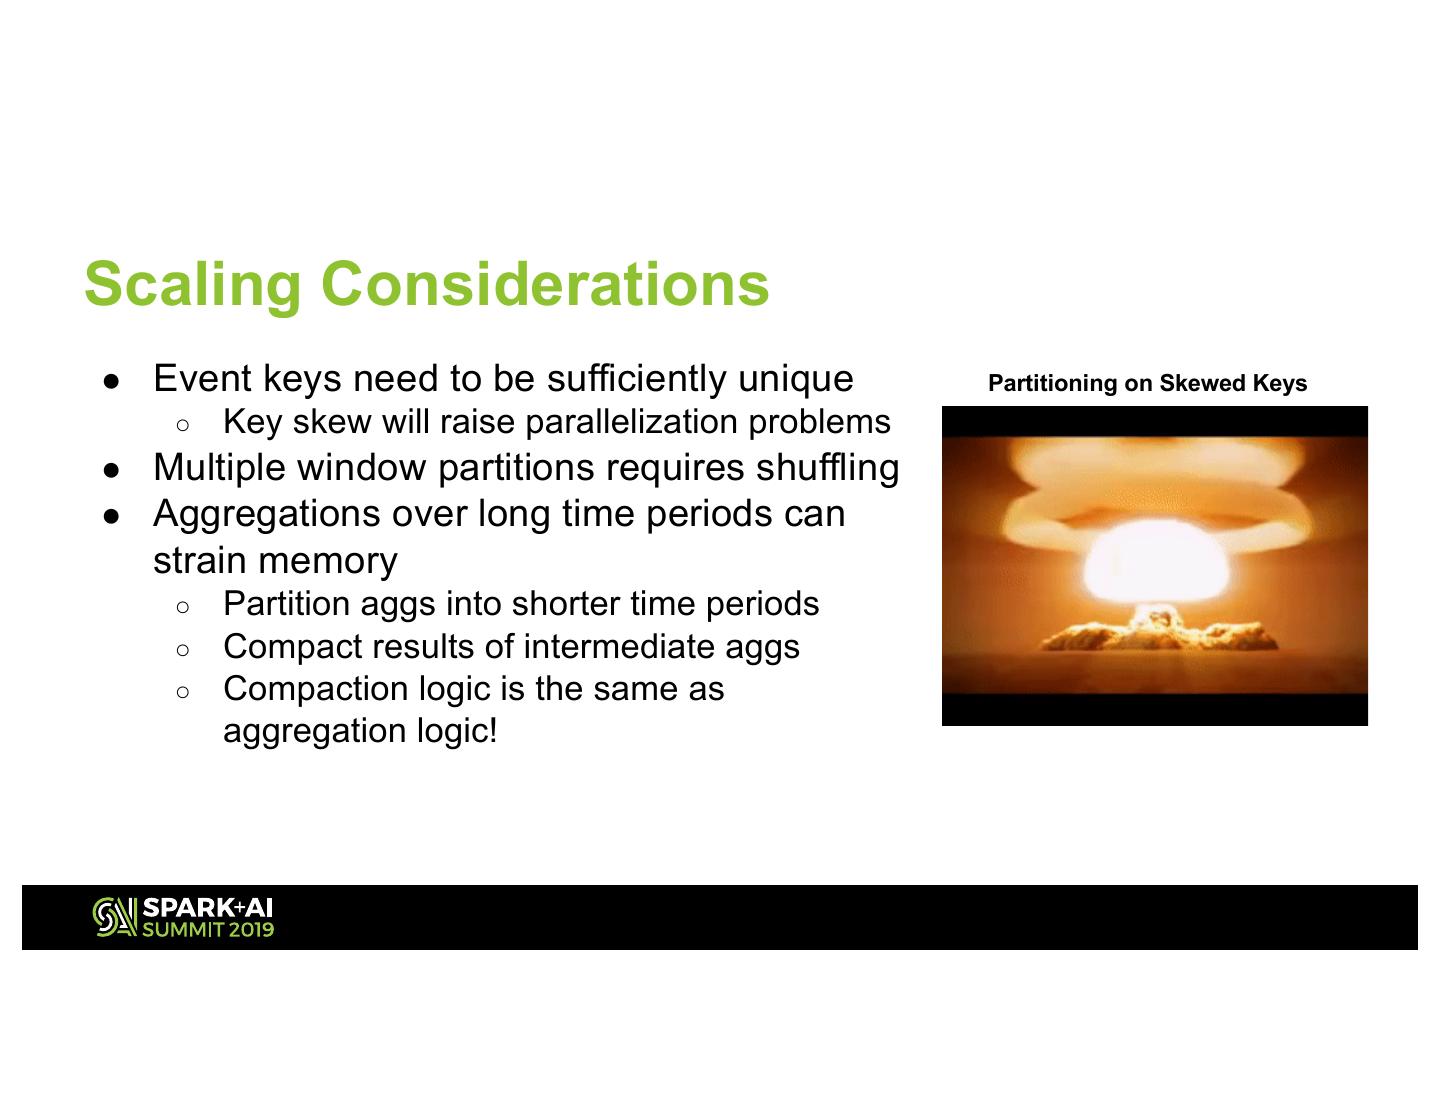
23 .Scaling Considerations ● Event keys need to be sufficiently unique Partitioning on Skewed Keys ○ Key skew will raise parallelization problems ● Multiple window partitions requires shuffling ● Aggregations over long time periods can strain memory ○ Partition aggs into shorter time periods ○ Compact results of intermediate aggs ○ Compaction logic is the same as aggregation logic!
24 .In closing... ● Spark used to scale parameterized data processor prototype runs for evaluation, optimization, and informing data engineering specifications ● Sometimes simple data processing techniques are not-so-simple in the distributed computing toolset ● Differential functions across multiple DataFrame windows enable non- standard aggregations ● Partitioning and compaction are key to enabling very large aggregations
25 .Thank You! Questions? @AustinAllshouse


