- 快召唤伙伴们来围观吧
- 微博 QQ QQ空间 贴吧
- 文档嵌入链接
- <iframe src="https://www.slidestalk.com/Spark/Managing_Apache_Spark_Workload_and_Automatic_Optimizing?embed" frame border="0" width="640" height="360" scrolling="no" allowfullscreen="true">复制
- 微信扫一扫分享
Managing Apache Spark Workload and Automatic Optimizing
展开查看详情
1 .Managing Apache Spark Workload and Automatic Optimizing Lantao Jin, Software Engineer, Data Platform Engineering (eBay)
2 .Who We Are ● Date Platform Engineering team in eBay ● We build an automate data platform and self-serve site with minimum touch points ● Focus on Spark optimization and self-serve platform building 2
3 .What We Do ● Build the platform of one-stop experience for Spark/Hadoop ● Manage entire Spark/Hadoop workload ● Open API and self-serve tools to users ● Performance tuning for Spark engine and jobs 3
4 .Why Manage Spark Workload ● Complex failure job root cause analysis needs ● Extreme performance tuning and optimization need ● Maximum resource utilization needs ● Compute showback and capacity planning in a global view 4
5 .Agenda ❖ Mission & Gaps & Challenges ❖ Architecture & Design ❖ JPM Analysis Service ❖ Success Cases ❖ Summary 5
6 .Challenges ● Over 20 product clusters ● Over 500PB data ● Over 5PB(compressed) incremental data per day ● Over 80000 jobs per day ● Metadata of job/data is not clear ● Many kinds of job like Pig, Hive, Cascading, Spark, Mapreduce ● Jobs are not standard developed ● Over 20+ teams to communicate and hundreds of batch users ● Job onboarding is out of control 6
7 .Mission Improve Development Experience Increase Resource Efficiency 7
8 .Gaps ● Development Experience ○ Distributed logging service for failure diagnostics ○ Job/Task level metrics is hard for developer understanding ○ Application healthiness visibility ○ Tedious communication to problem resolution for any workload issue ● Resource Efficiency ○ Huge manual effort of analyzing cluster/queue high load ○ Blind to “bad” jobs 8
9 .Object For Developers For Operators For Managers ❏ Application-specific ❏ Reduce performance ❏ Shorten time to diagnostics and incidents in production production Performance ❏ Easy communication back ❏ Resource usage insight Recommendation to developer for detailed and guidance ❏ Highlight applications performance insights ❏ Increase cluster ROI need attention ❏ Identify bottlenecks and resource usage Data Platform Engineering 9
10 .JPM Architecture 10
11 .Job Processing JPM job/runtime processor (bolt) 11
12 . Spark Profile listener Driver ● Collect/dump extra metrics for DAGScheduler compatibility purposes Events ○ Real memory usage JPM profiler ListenerBus ○ PRC count CatalogEventListener ○ Input/Output ExecutionPlanListener ExecutorMetricsListener * With this version spark profiler, we also modify the Spark Core to expose memory related metrics. HDFS Rest API 12
13 . JPM service backend JPM Analysis Service 13
14 .JPM Analysis Service 14
15 .JPM Analysis Service 15
16 .JPM Analysis Service 16
17 .JPM Analysis Service 17
18 .JPM Analysis Service 18
19 .JPM Analysis Service 19
20 .JPM Analysis Service 20
21 .JPM Analysis Service 21
22 .JPM Analysis Service 22
23 .Success Cases ❖ Reduce High RPC Jobs ❖ Reduce Account Usage ❖ Repeatedly failed jobs ❖ Optimize job path with data lineage ❖ Historical based optimization ❖ Running job issue detection 23
24 . Cluster RPC Queue Time Reduce High RPC Jobs ● Background: Jobs with high RPC ● Solution: JPM alert the high RPC jobs with advices: ○ add a reducer for map only jobs (hint) ○ change mapper join to reducer join (pipeline optimization) ● Sample: The RPC calls for the job reduced from 43M to 46k. Job Resource Usage Trend Metrics 24 Engine
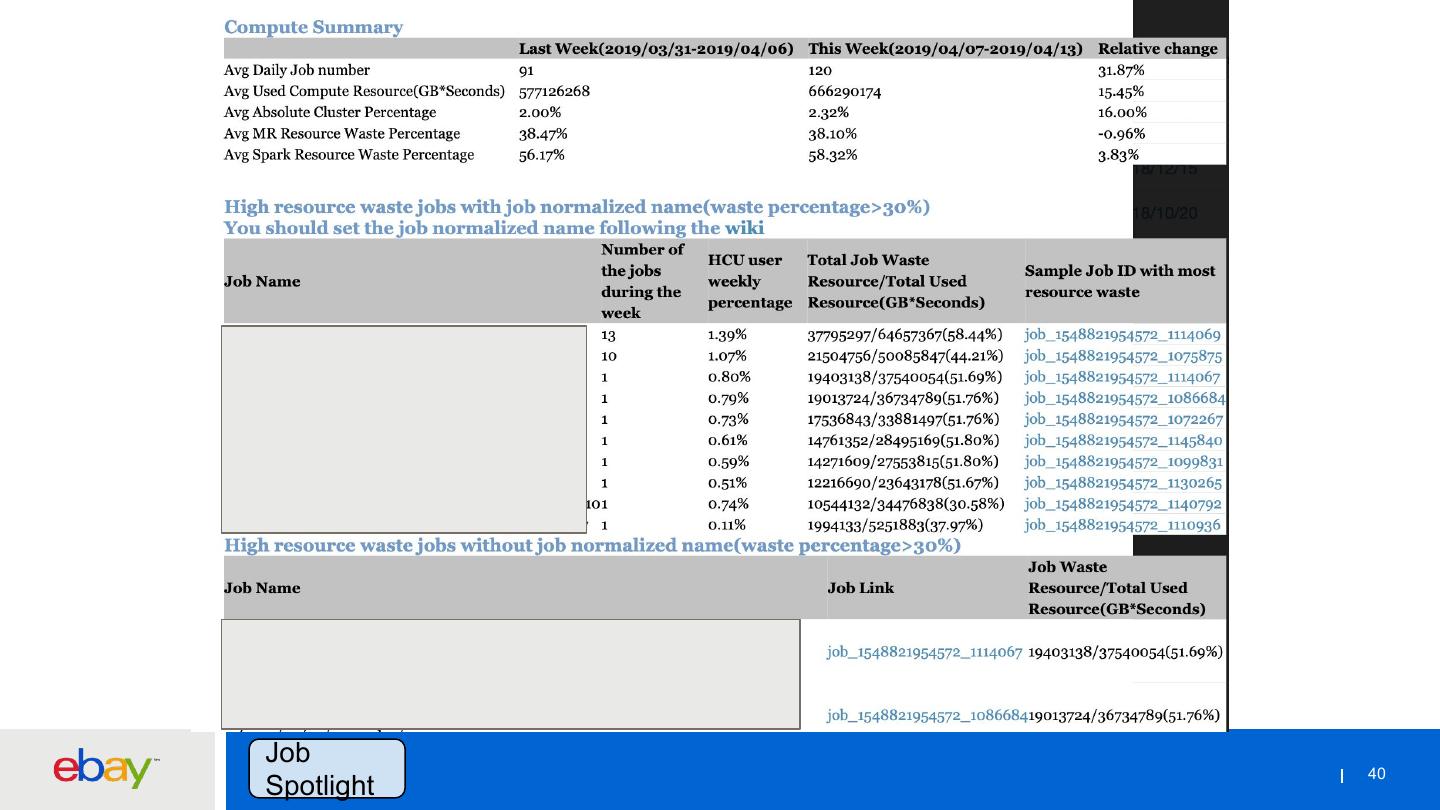
25 .Reduce Account Usage ● Background: Spark jobs may require much more memory resource than they actually need. ● Solution: JPM highlights the resource wasted jobs with advices: ○ make the advisory memory configuration ○ combine the SQLs which have same table scan ● Sample: the usage for the account b_seo_eng decreases from 500MB to 30MB, saving around 1.5% of cluster. *HCU (Hadoop Compute Unit): 1 HCU is equal to 1 GB memory used for 1 second or 0.5 GB used for 2 seconds. Metrics Resource Catalog 25 Engine Analyzer Analyzer
26 .Repeatedly Failed Jobs ● Background: Repeatedly failed jobs always mean there are many opportunities in them. ● Solution: In JPM Spotlight page, these repeatedly failed jobs will be grouped by ○ failure exception | user | diagnosis ○ limit the resource of those high failure rate jobs, stop 0% success jobs when exceed threshold and alert the users (configurable). ● Sample: The stopped jobs save around 1.4% cluster usage per week. Metrics Resource Log 26 Engine Analyzer Diagnoser
27 .Optimize job path with data lineage ● Background: Over 80k apps per day in our YARN clusters. Partial of them are not standard developed. Metadata is even unclear. ● Solution: JPM worked out the data lineage by analysing jobs, analysing audit log, extracting Hive metastore, combining OIV. Below actions are benefited based on the lineage: ○ SQLs combination ○ Hotspot detection and optimization ○ Useless data/jobs retire Data Catalog Auditlog OIV 27 Lineage Analyzer
28 .● Sample 1: SQLs combination/Hotspot detection ○ SEO team has many batch jobs which scan one same big table without middle table, and the only difference in their outputs are Table/Folder Save grouping condition. /sys/edw/dw_lstg_item/orc Apollo (1.3%) ● Sample 2: Useless data/jobs retire /sys/edw/dw_lstg_item/orc_partitioned ○ There are many jobs without /sys/edw/dw_lstg_item_cold/orc Ares(0.4%) /sys/edw/dw_lstg_item_cold/orc_partitioned downstream job which their data /sys/edw/dw_checkout_trans/orc Ares (0.15%) no accessed over 6 months. 28
29 .Historical based optimization ● Background: This is an old topic but always useful. What we are care about here are the workload and environment between different running instances. ● Solution: Besides gives us the trend, JPM could: ○ analyzes the entire workload of multiple level of queue and cluster environment. ○ tell us the impact from queue and env size. ○ tell us the changes of configurations ○ give an advice about job scheduler strategy (WIP) Metrics Resource Configura HBO 29 Engine Analyzer tion Diff


