- 快召唤伙伴们来围观吧
- 微博 QQ QQ空间 贴吧
- 文档嵌入链接
- 复制
- 微信扫一扫分享
- 已成功复制到剪贴板
ai_index_2019_report
AI指数
AI指数 2019
MIT
Open AI
斯坦福大学
McKinsey Global Institute
展开查看详情
1 . ar intelligence index 2019 annual report
2 .Artificial Intelligence Index Report 2019 Steering Commitee Steering Committee Raymond Perrault (report coordinator) SRI International Yoav Shoham (chair) Stanford University Erik Brynjolfsson MIT Jack Clark OpenAI John Etchemendy Stanford University Barbara Grosz Harvard University Terah Lyons Partnership On AI James Manyika McKinsey Global Institute Juan Carlos Niebles Stanford University Project Manager and Report Editor-in-Chief Saurabh Mishra Stanford University
3 .Artificial Intelligence Index Report 2019 Table of Contents Table of Contents Introduction 4 Report Highlights 5 Acknowledgements 9 Chapter 1 Research and Development 12 Chapter 2 Conferences 37 Chapter 3 Technical Performance 47 Chapter 4 The Economy 71 Chapter 5 Education 106 Chapter 6 Autonomous Systems 127 Chapter 7 Public Perception 136 Chapter 8 Societal Considerations 146 Chapter 9 National Strategies and 156 Global AI Vibrancy Technical Appendix 182
4 . Artificial Intelligence Index Report 2019 AI Index Report How to cite this Report: Raymond Perrault, Yoav Shoham, Erik Brynjolfsson, Jack Clark, John Etchemendy, Barbara Grosz, Terah Lyons, James Manyika, Saurabh Mishra, and Juan Carlos Niebles, “The AI Index 2019 Annual Report”, AI Index Steering Committee, Human-Centered AI Institute, Stanford University, Stanford, CA, December 2019. (c) 2019 by Stanford University, “The AI Index 2019 Annual Report” is made available under a Creative Commons Attribution- NoDerivatives 4.0 License (International) https://creativecommons.org/licenses/by-nd/4.0/legalcode The AI Index is as an independent initiative at Stanford University’s Human-Centered Artificial Intelligence Institute (HAI). The AI Index was conceived within the One Hundred Year Study on AI (AI100). We thank your supporting partners We welcome feedback and new ideas for next year. Contact us at AI-Index-Report@stanford.edu. [Table_of_Contents] 3
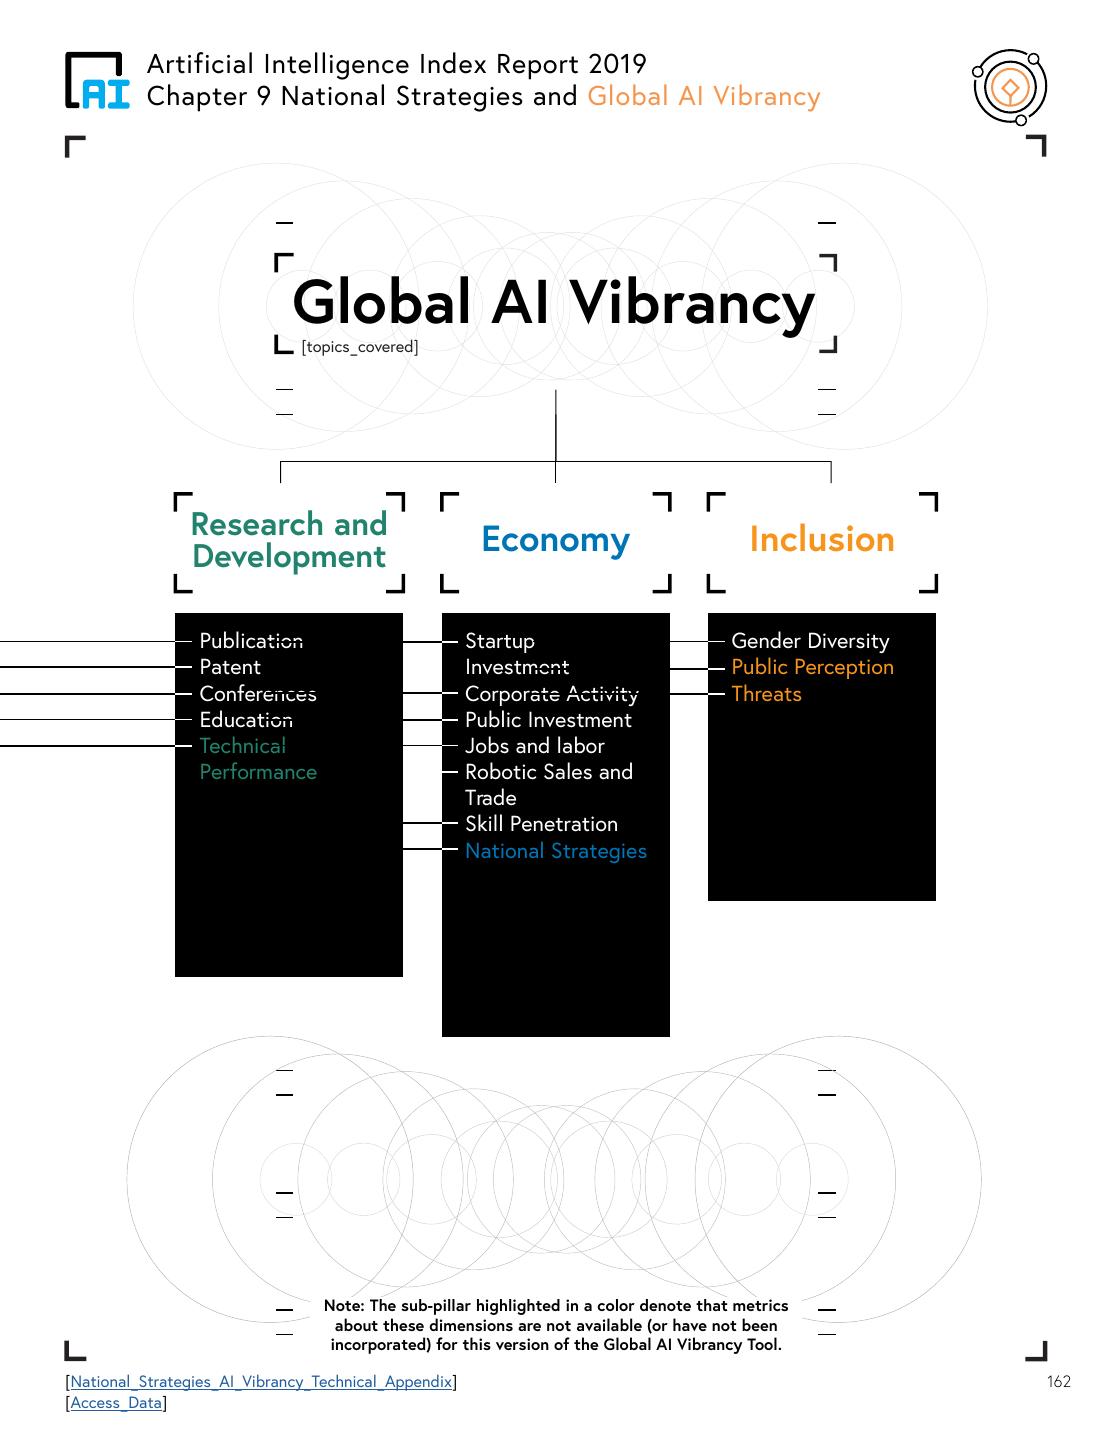
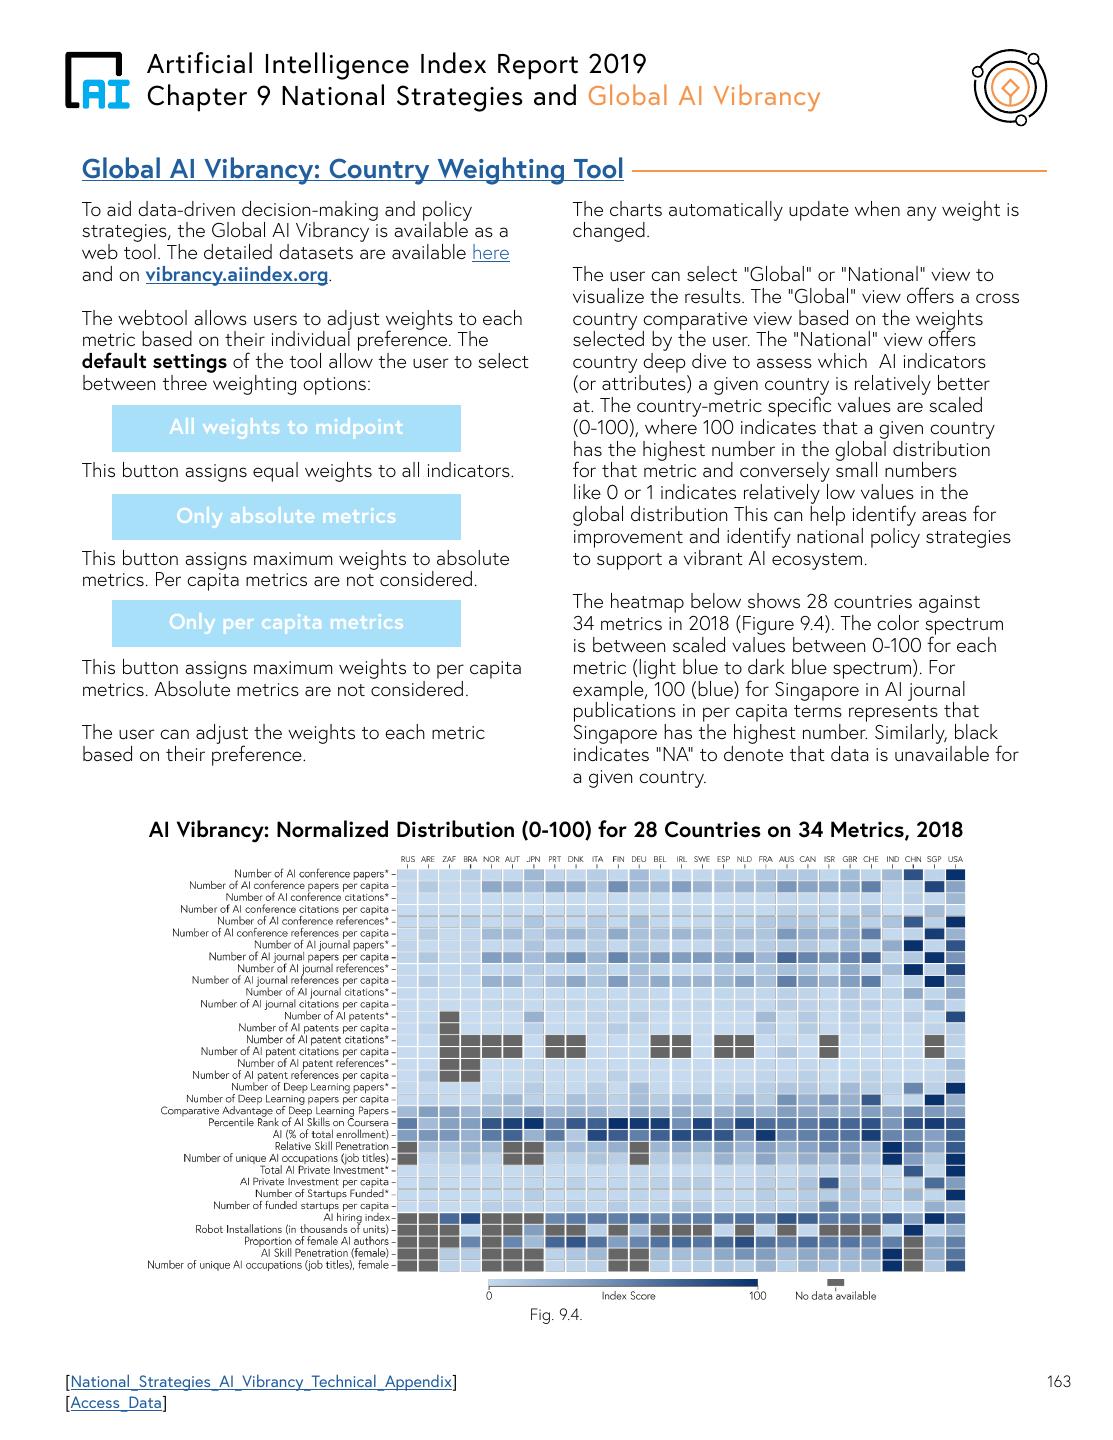
5 . Artificial Intelligence Index Report 2019 AI Index Report - Introduction Introduction to the AI Index 2019 Report The AI Index Report tracks, collates, distills, and visualizes data relating to artificial intelligence. Its mission is to provide unbiased, rigorously-vetted data for policymakers, researchers, executives, journalists, and the general public to develop intuitions about the complex field of AI. Expanding annually, the Report endeavors to include data on AI development from communities around the globe. Before diving into the data, it is worth noting the following about the 2019 edition of the AI Index Report: 1. This edition tracks three times as many data sets as the 2018 edition. It includes an update of previous measures, as well as numerous new ones, across all aspects of AI: technical performance, the economy, societal issues, and more. 2. This volume of data is challenging to navigate. To help, we’ve produced a tool that provides a high-level global perspective on the data. The Global AI Vibrancy Tool (vibrancy.aiindex.org) compares countries’ global activities, including both a cross-country perspective, as well as a country-specific drill down. Though it is tempting to provide a single ranking of countries, such comparisons are notoriously tricky. Instead, we’ve provided a tool for the reader to set the parameters and obtain the perspective they find most relevant when comparing countries. This tool helps dispel the common impression that AI development is largely a tussle between the US and China. Reality is much more nuanced. Our data shows that local centers of AI excellence are emerging across the globe. For example, Finland excels in AI education, India demonstrates great AI skill penetration, Singapore has well-organized government support for AI, and Israel shows a lot of private investment in AI startups per capita. 3. We are also releasing the AI Index arXiv Monitor (arxiv.aiindex.org), a tool to support research on current technological progress in AI via full-text searches of papers published on the pre-print repository. Given that measurement and evaluation in complex domains remain fraught with subtleties, the AI Index has worked hard to avoid bias and seek input from many communities. As part of this effort, on October 30, 2019, the Stanford HAI-AI Index Workshop: Measurement in AI Policy: Opportunities and Challenges (https:// hai.stanford.edu/ai-index/workshops) convened over 150 industry and academic experts from a variety of disciplines related to AI to discuss the many pressing issues that arise from data measurement of AI. The Workshop Proceedings will be available shortly here. [Table_of_Contents] 4
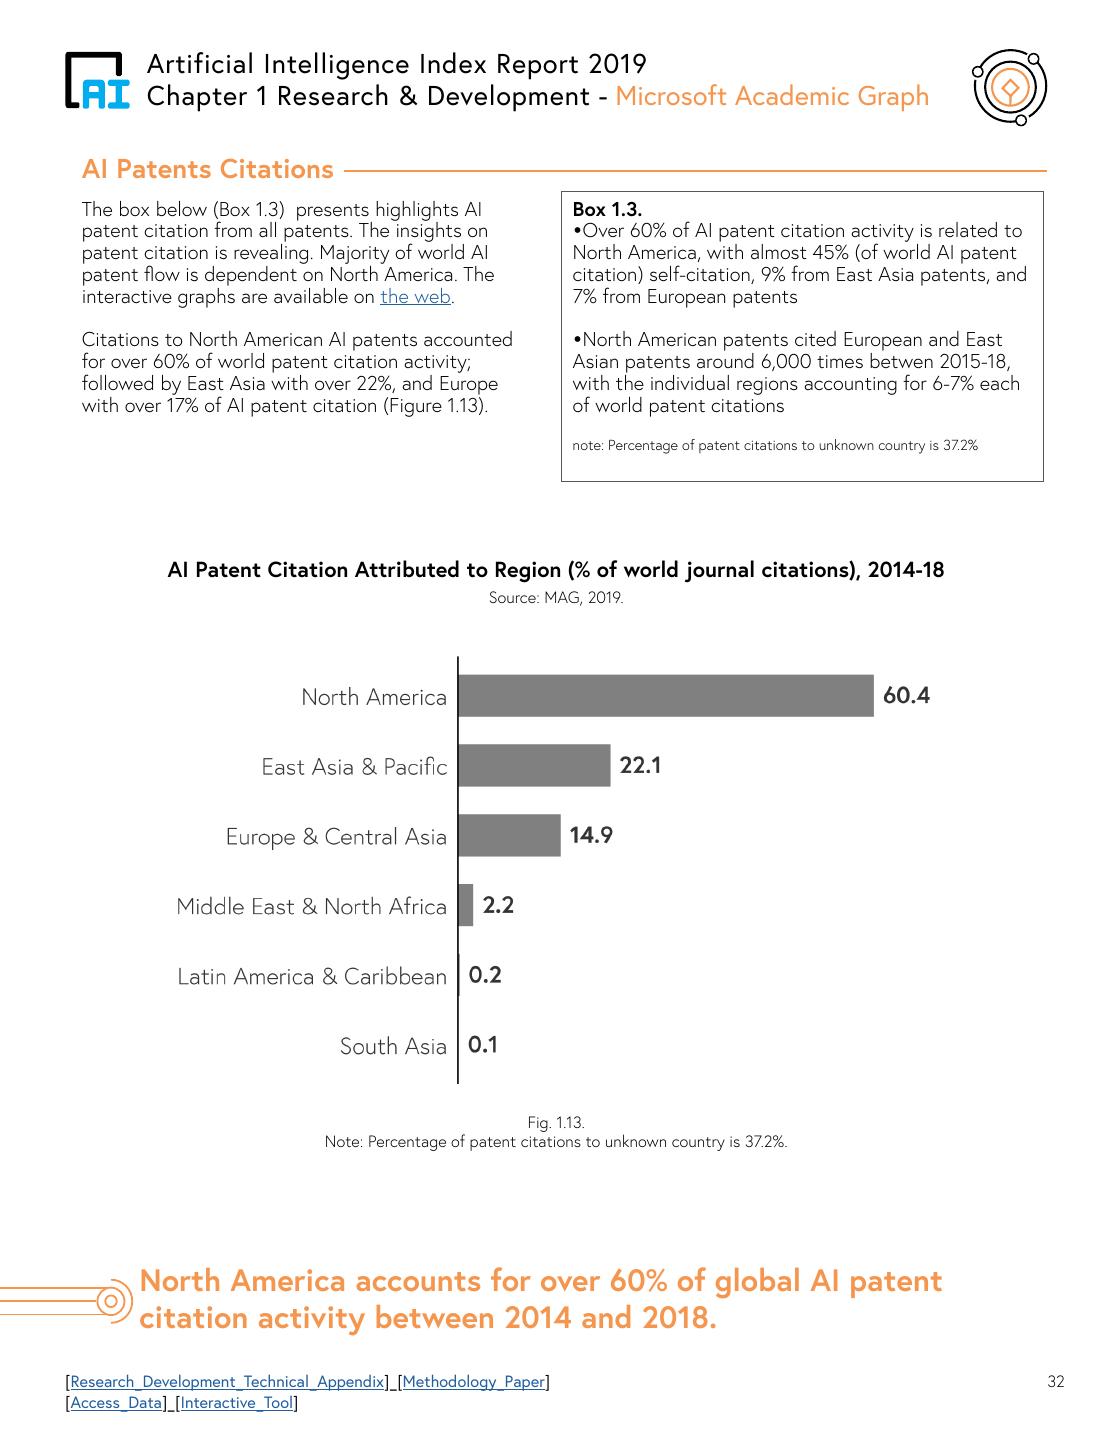
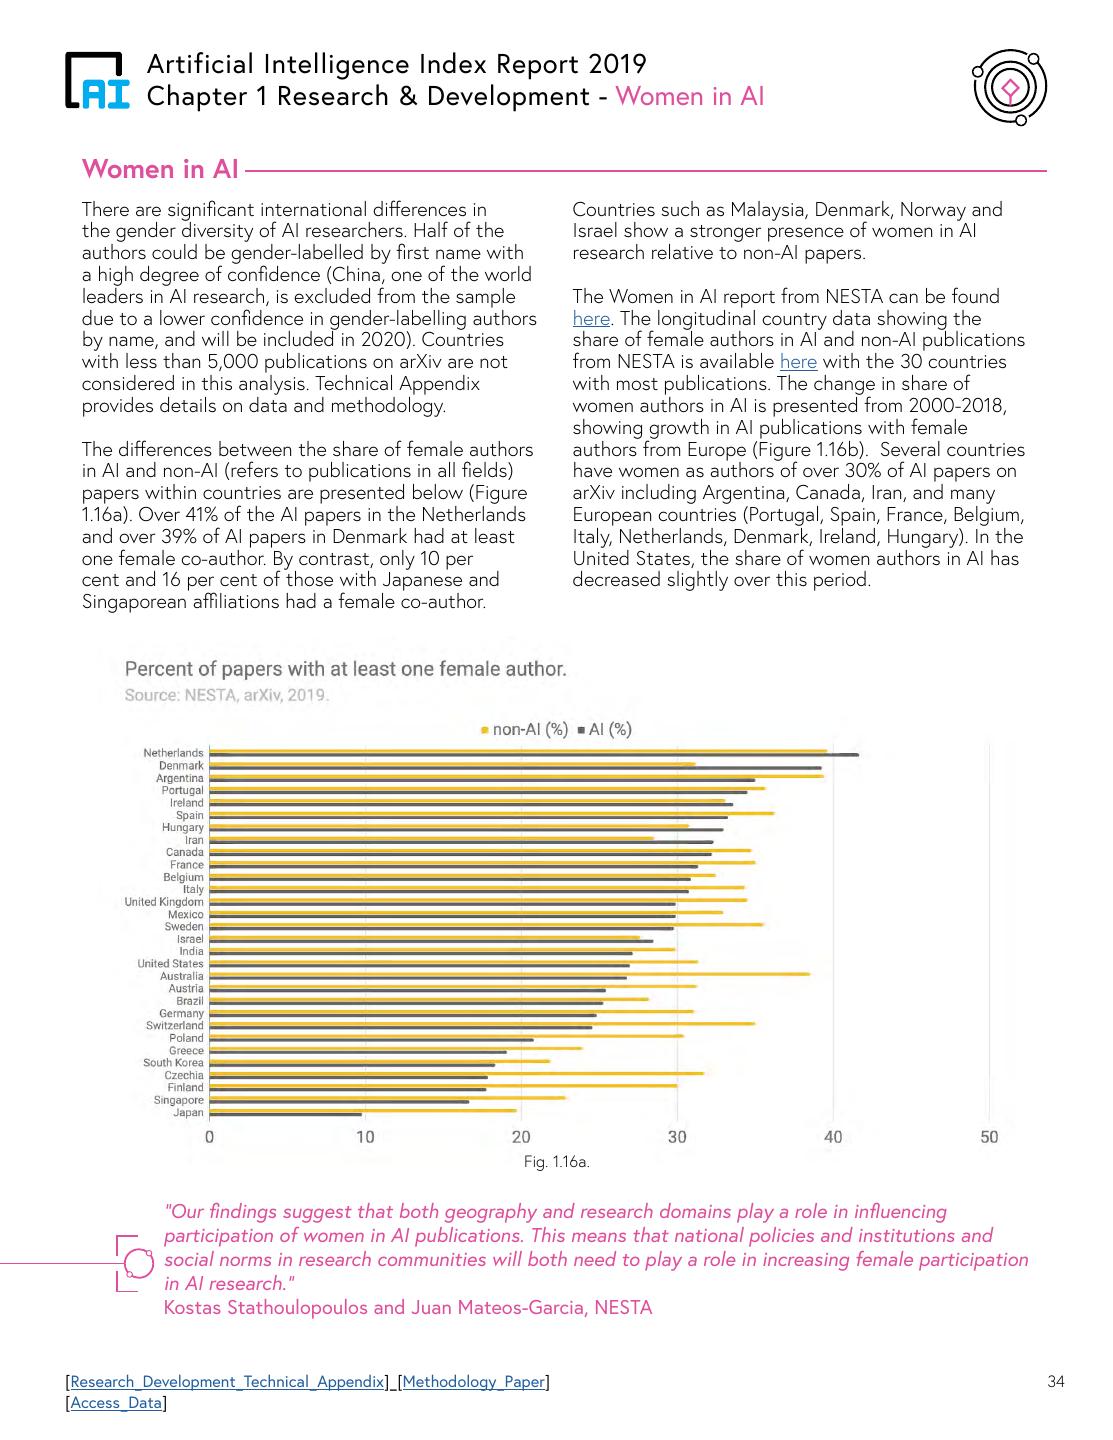
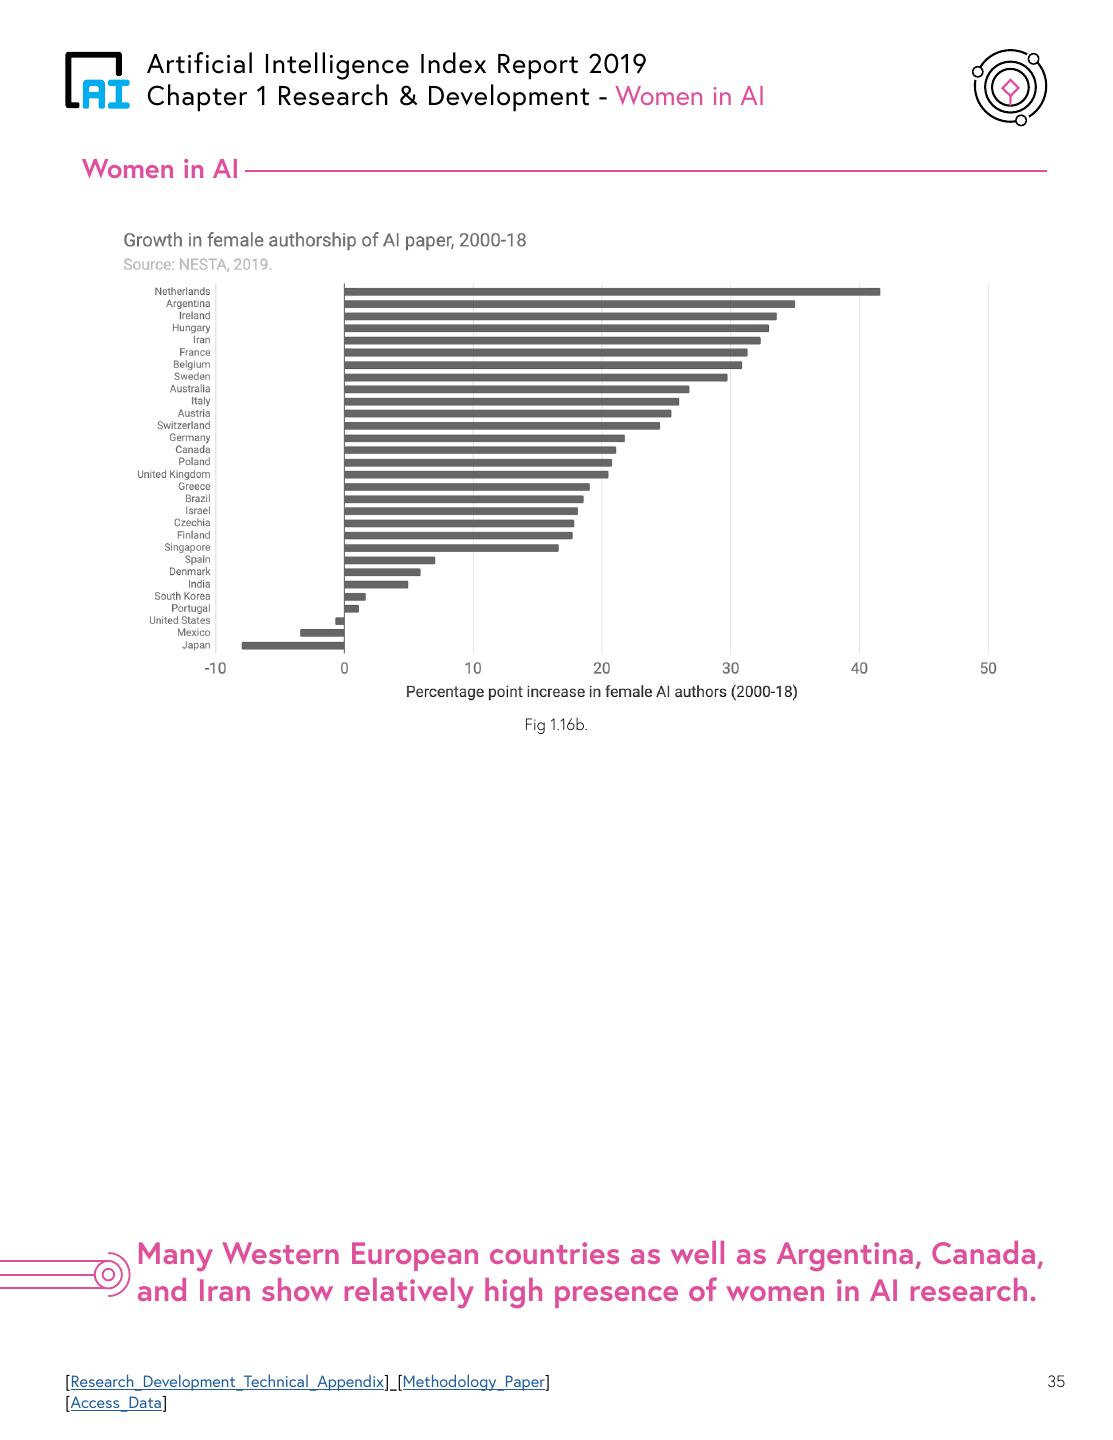
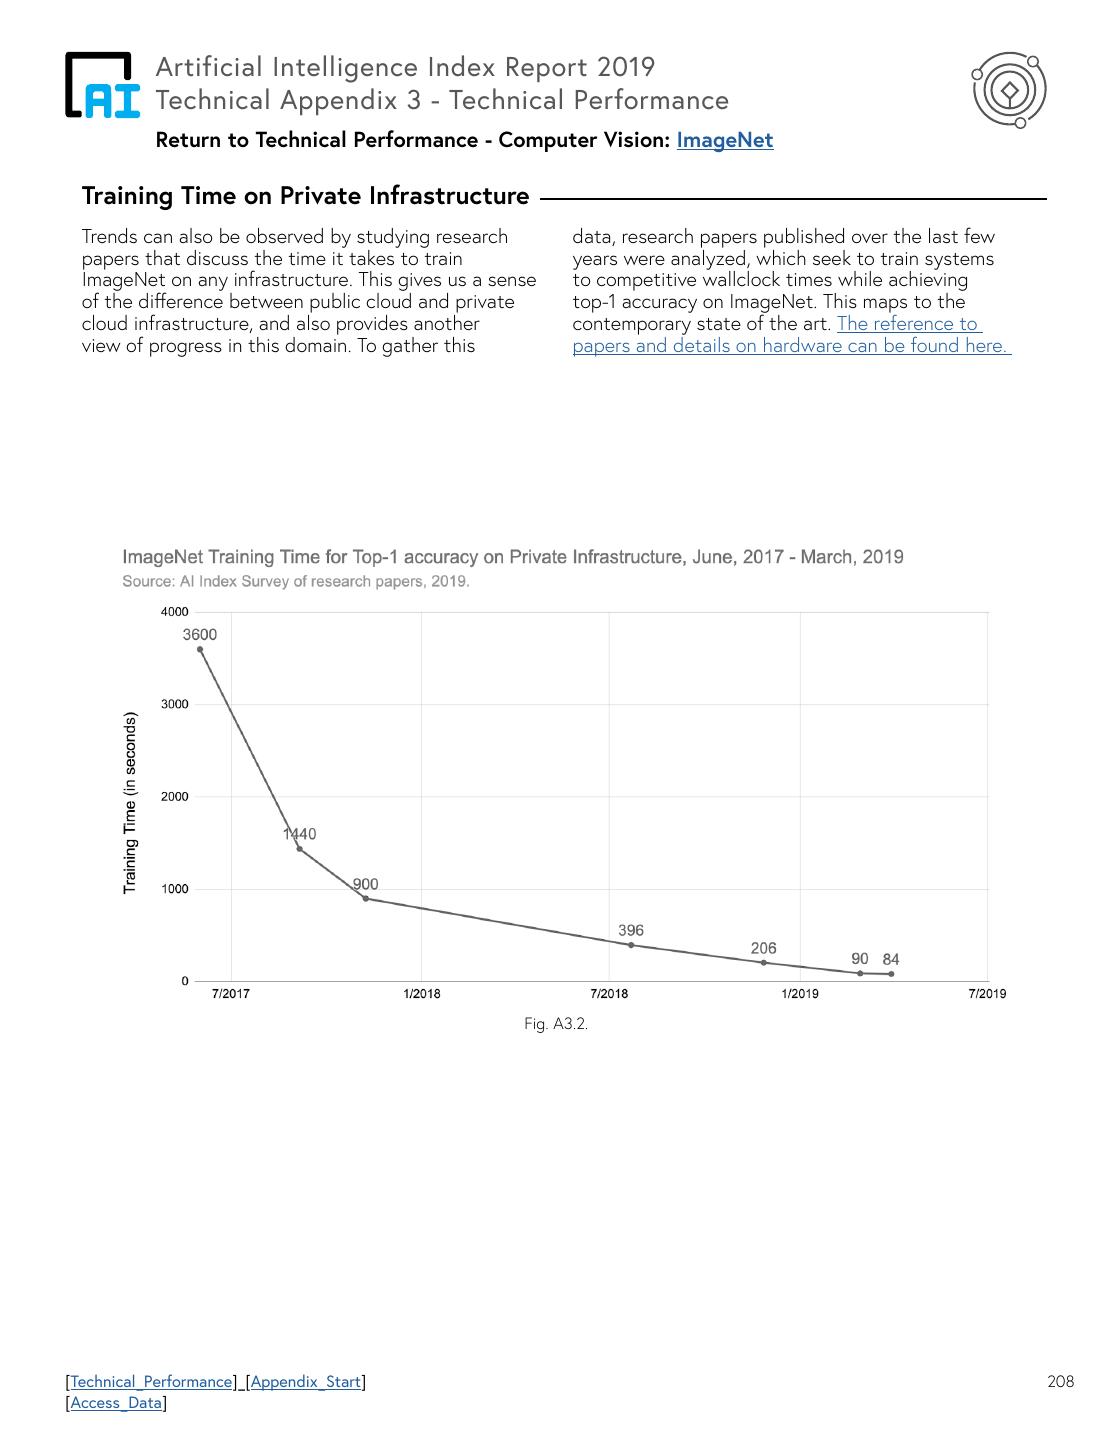
6 . Artificial Intelligence Index Report 2019 AI Index Report - Highlights AI Index 2019 Report Highlights Each of the nine chapters presents well-vetted data on important dimensions related to the activity in, and technical progress of artificial intelligence. Here is a sample of the findings. 1. Research and Development • Between 1998 and 2018, the volume of peer-reviewed AI papers has grown by more than 300%, accounting for 3% of peer-reviewed journal publications and 9% of published conference papers. • China now publishes as many AI journal and conference papers per year as Europe, having passed the US in 2006. The Field-Weighted Citation Impact of US publications is still about 50% higher than China’s. • Singapore, Switzerland, Australia, Israel, Netherlands, and Luxembourg have relatively high numbers of Deep Learning papers published on arXiv in per capita terms. • Over 32% of world AI journal citations are attributed to East Asia. Over 40% of world AI conference paper citations are attributed to North America. • North America accounts for over 60% of global AI patent citation activity between 2014-18. • Many Western European countries, especially the Netherlands and Denmark, as well as Argentina, Canada, and Iran show relatively high presence of women in AI research. 2. Conferences • Attendance at AI conferences continues to increase significantly. In 2019, the largest, NeurIPS, expects 13,500 attendees, up 41% over 2018 and over 800% relative to 2012. Even conferences such as AAAI and CVPR are seeing annual attendance growth around 30%. • The WiML workshop has eight times more participants than it had in 2014 and AI4ALL has 20 times more alumni than it had in 2015. These increases reflect a continued effort to include women and underrepresented groups in the AI field. 3. Technical Performance • In a year and a half, the time required to train a large image classification system on cloud infrastructure • has fallen from about three hours in October 2017 to about 88 seconds in July, 2019. During the same period, the cost to train such a system has fallen similarly. • Progress on some broad sets of natural-language processing classification tasks, as captured in the SuperGLUE and SQuAD2.0 benchmarks, has been remarkably rapid; performance is still lower on some NLP tasks requiring reasoning, such as the AI2 Reasoning Challenge, or human-level concept learning task, such as the Omniglot Challenge. • Prior to 2012, AI results closely tracked Moore’s Law, with compute doubling every two years. Post-2012, compute has been doubling every 3.4 months. 4. Economy • Singapore, Brazil, Australia, Canada and India experienced the fastest growth in AI hiring from 2015 to 2019. [Table_of_Contents] 5
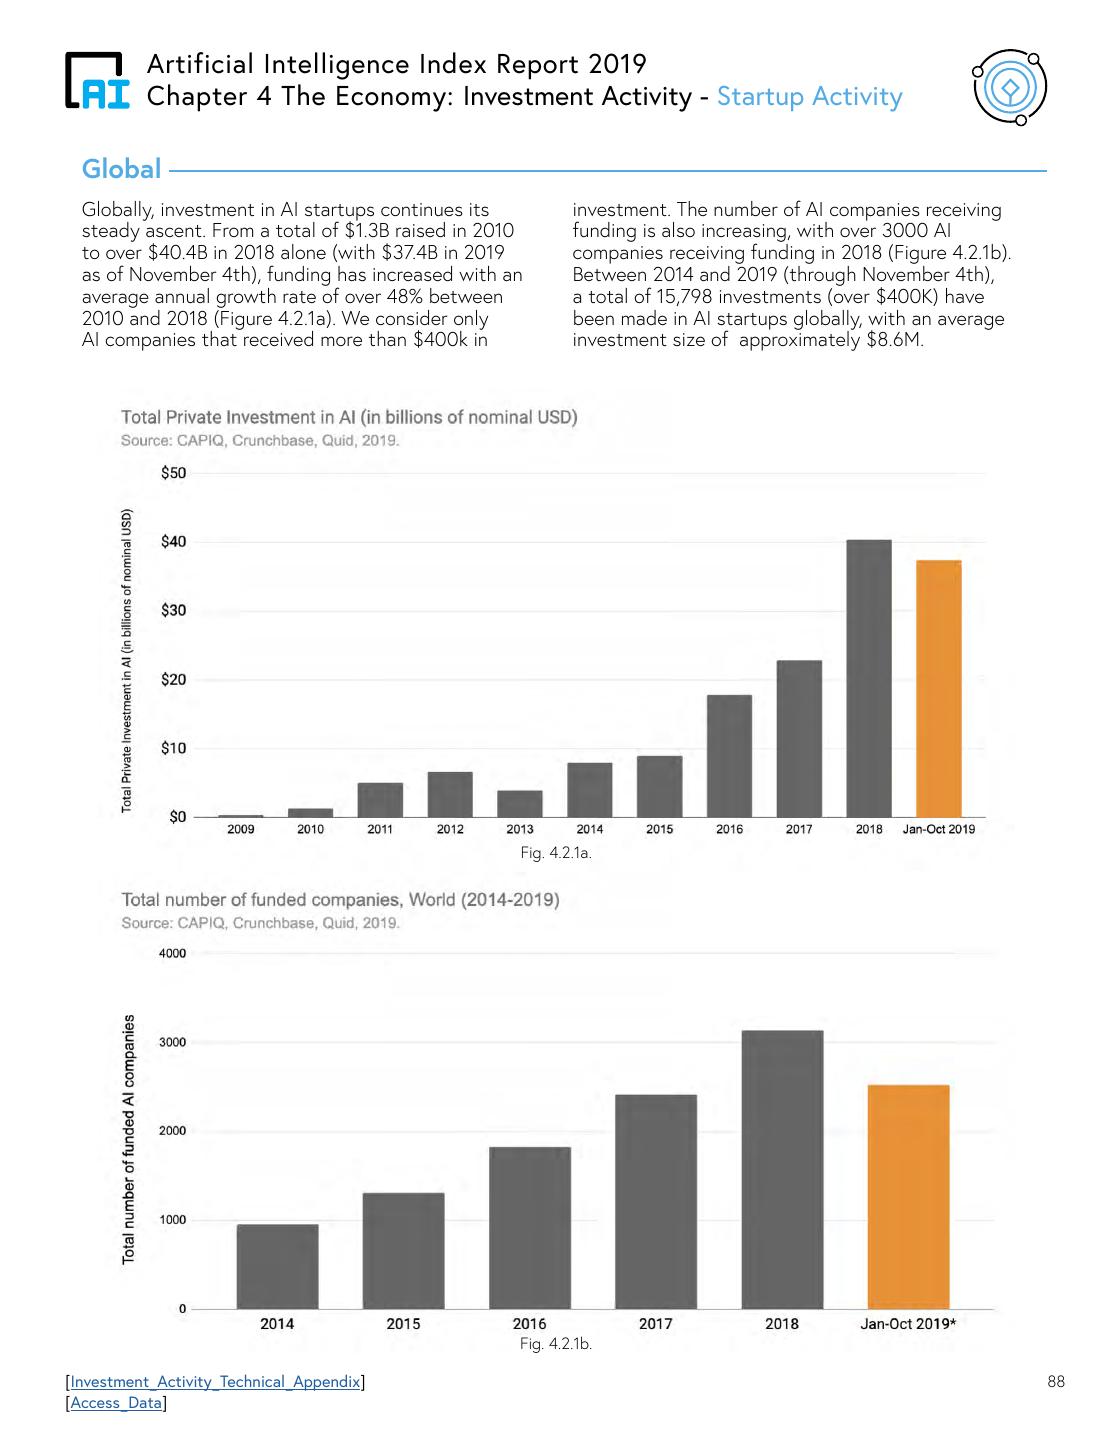
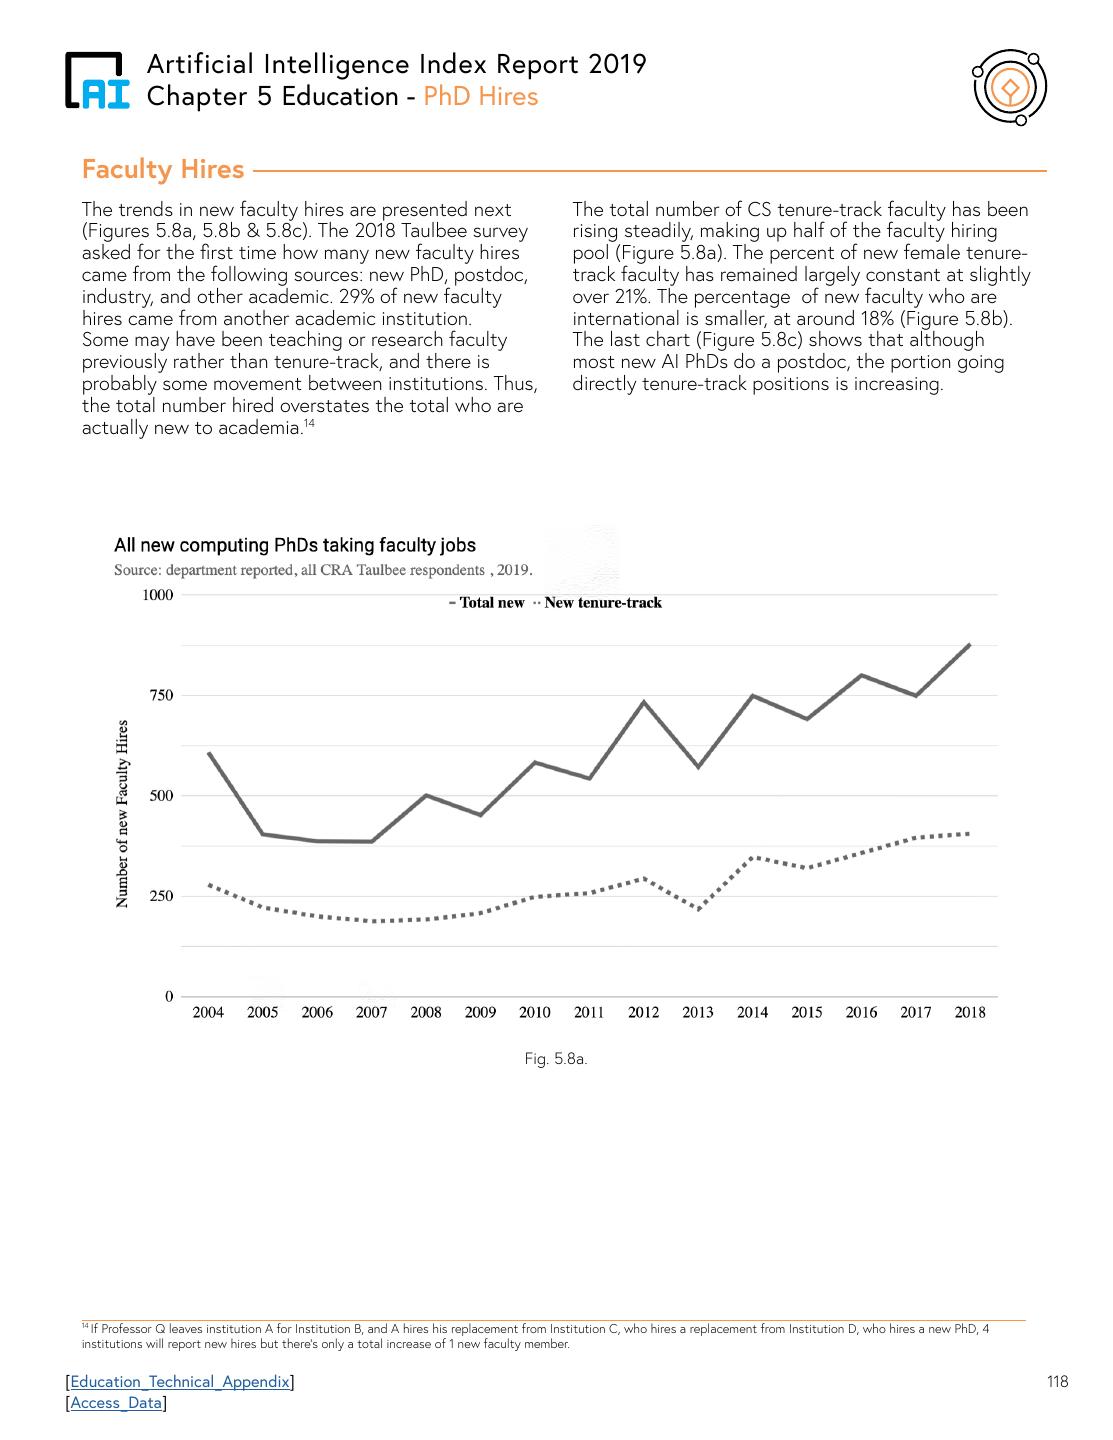
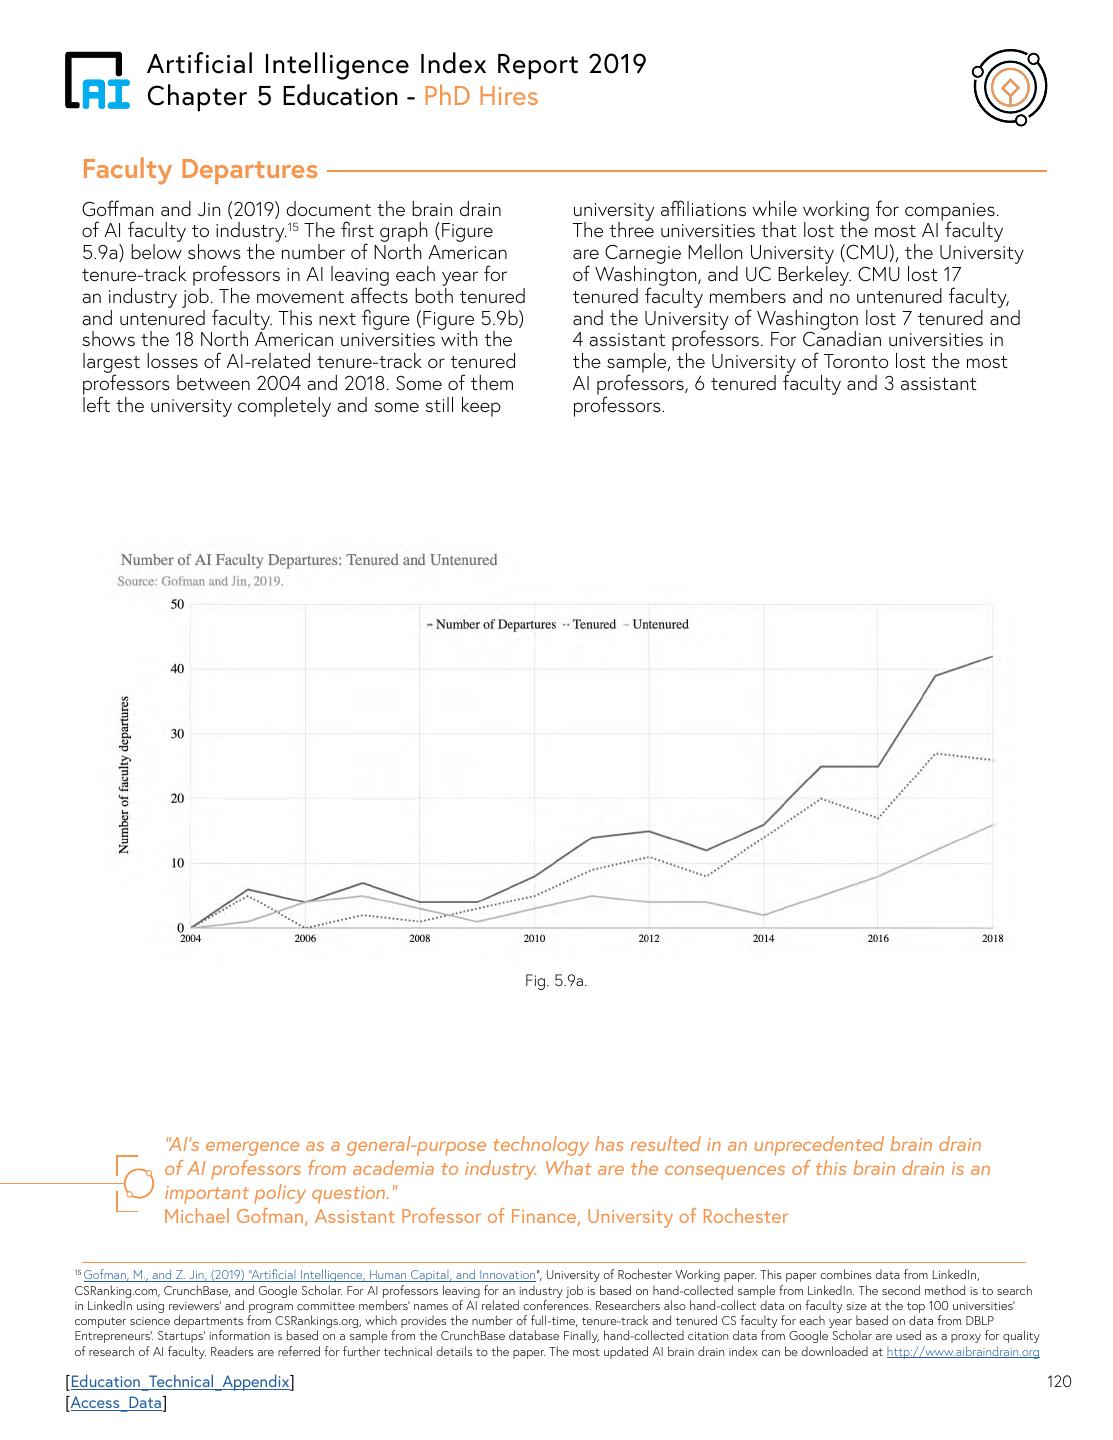
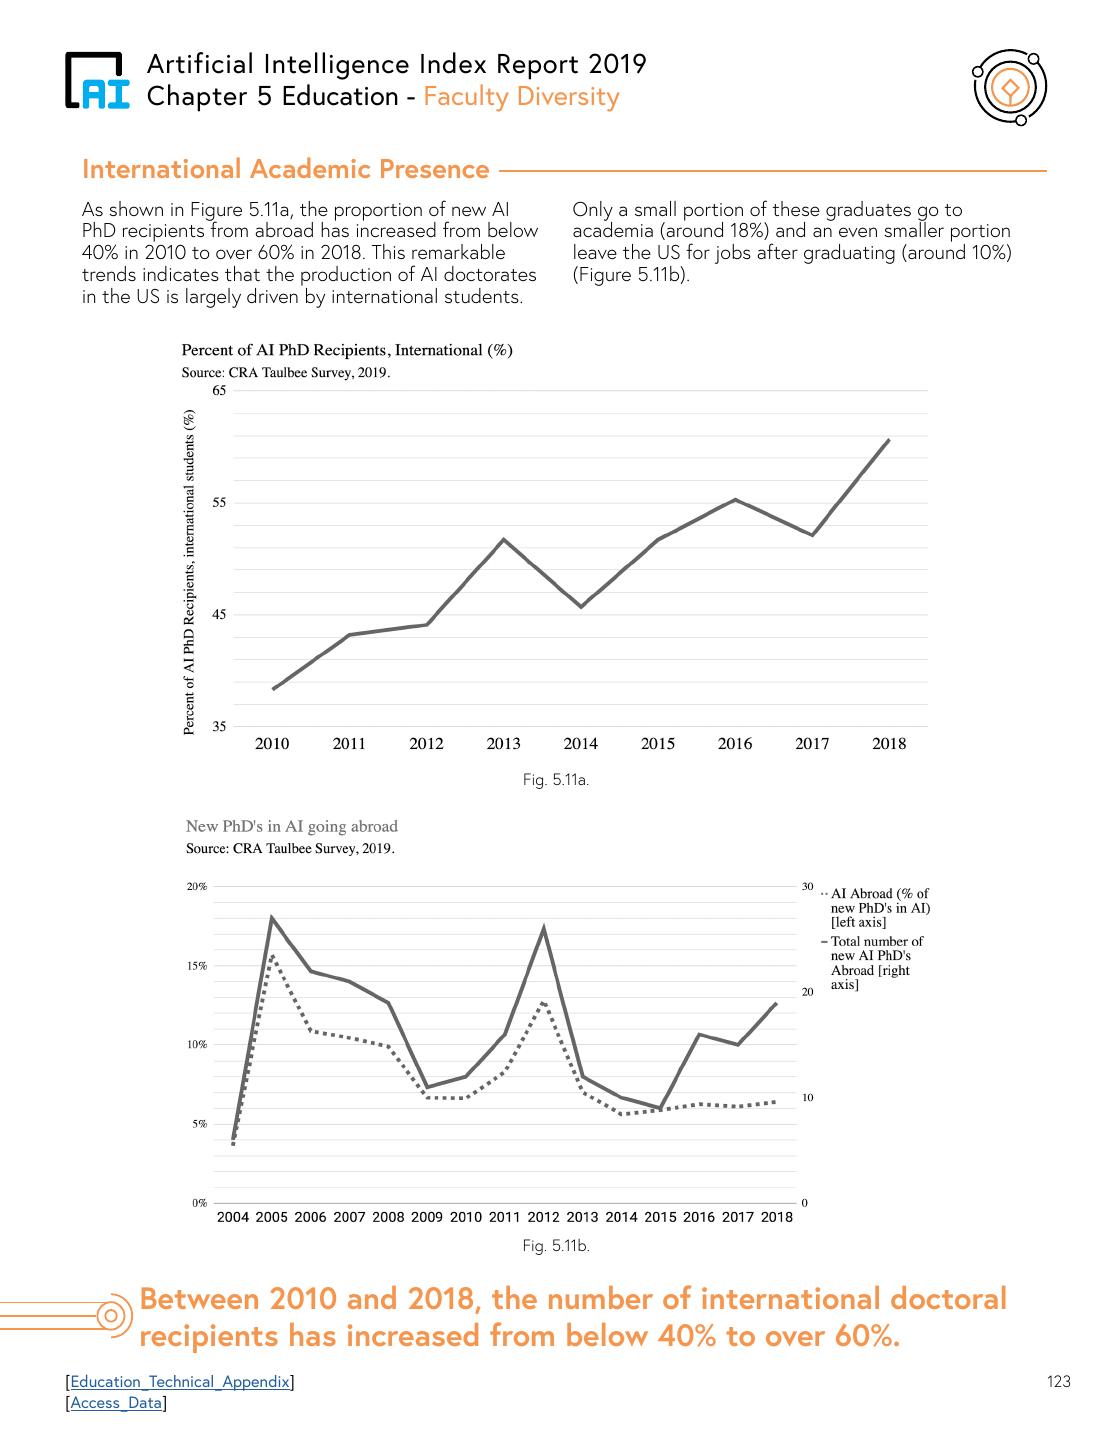
7 . Artificial Intelligence Index Report 2019 AI Index Report - Highlights AI Index 2019 Report Highlights • In the US, the share of jobs in AI-related topics increased from 0.26% of total jobs posted in 2010 to 1.32% in October 2019, with the highest share in Machine Learning (0.51% of total jobs). AI labor demand is growing especially in high-tech services and the manufacturing sector. • The state of Washington has the highest relative AI labor demand. Almost 1.4% of total jobs posted are AI jobs. California has 1.3%, Massachusetts 1.3%, New York 1.2%, the District of Columbia (DC) 1.1%, and Virginia has 1% online jobs posted in AI. • In the US, the share of AI jobs grew from 0.3% in 2012 to 0.8% of total jobs posted in 2019. AI labor demand is growing especially in high-tech services and the manufacturing sector. • In 2019, global private AI investment was over $70B, with AI-related startup investments over $37B, M&A $34B, IPOs $5B, and Minority Stake valued around $2B. • Globally, investment in AI startups continues its steady ascent. From a total of $1.3B raised in 2010 to over $40.4B in 2018 (with $37.4B in 2019 as of November 4th), funding has increased at an average annual growth rate of over 48%. • Autonomous Vehicles (AVs) received the largest share of global investment over the last year with $7.7B (9.9% of the total), followed by Drug, Cancer and Therapy ($4.7B, 6.1%), Facial Recognition ($4.7B, 6.0%), Video Content ($3.6B, 4.5%), and Fraud Detection and Finance ($3.1B, 3.9%). • 58% of large companies surveyed report adopting AI in at least one function or business unit in 2019, up from 47% in 2018. • Only 19% of large companies surveyed say their organizations are taking steps to mitigate risks associated with explainability of their algorithms, and 13% are mitigating risks to equity and fairness, such as algorithmic bias and discrimination 5. Education • Enrollment continues to grow rapidly in AI and related subjects, both at traditional universities in the US and internationally, and in online offerings. • At the graduate level, AI has rapidly become the most popular specialization among computer science PhD students in North America, with over twice as many students as the second most popular specialization (security/information assurance). In 2018, over 21% of graduating Computer Science PhDs specialize in Artificial Intelligence/Machine Learning. • In the US and Canada, the number of international PhD students graduating in AI continues to grow, and currently exceeds 60% of the PhDs produced from these programs (up from less than 40% in 2010). • Industry has become, by far, the largest consumer of AI talent. In 2018, over 60% of AI PhD graduates went to industry, up from 20% in 2004. In 2018, over twice as many AI PhD graduates went to industry as took academic jobs in the US. • In the US, AI faculty leaving academia for industry continues to accelerate, with over 40 departures in 2018, up from 15 in 2012 and none in 2004. • Diversifying AI faculty along gender lines has not shown great progress, with women comprising less than 20% of the new faculty hires in 2018. Similarly, the share of female AI PhD recipients has remained virtually constant at 20% since 2010 in the US.1 1 Studies on participation of under-represented minorities coming in 2020 [Table_of_Contents] 6
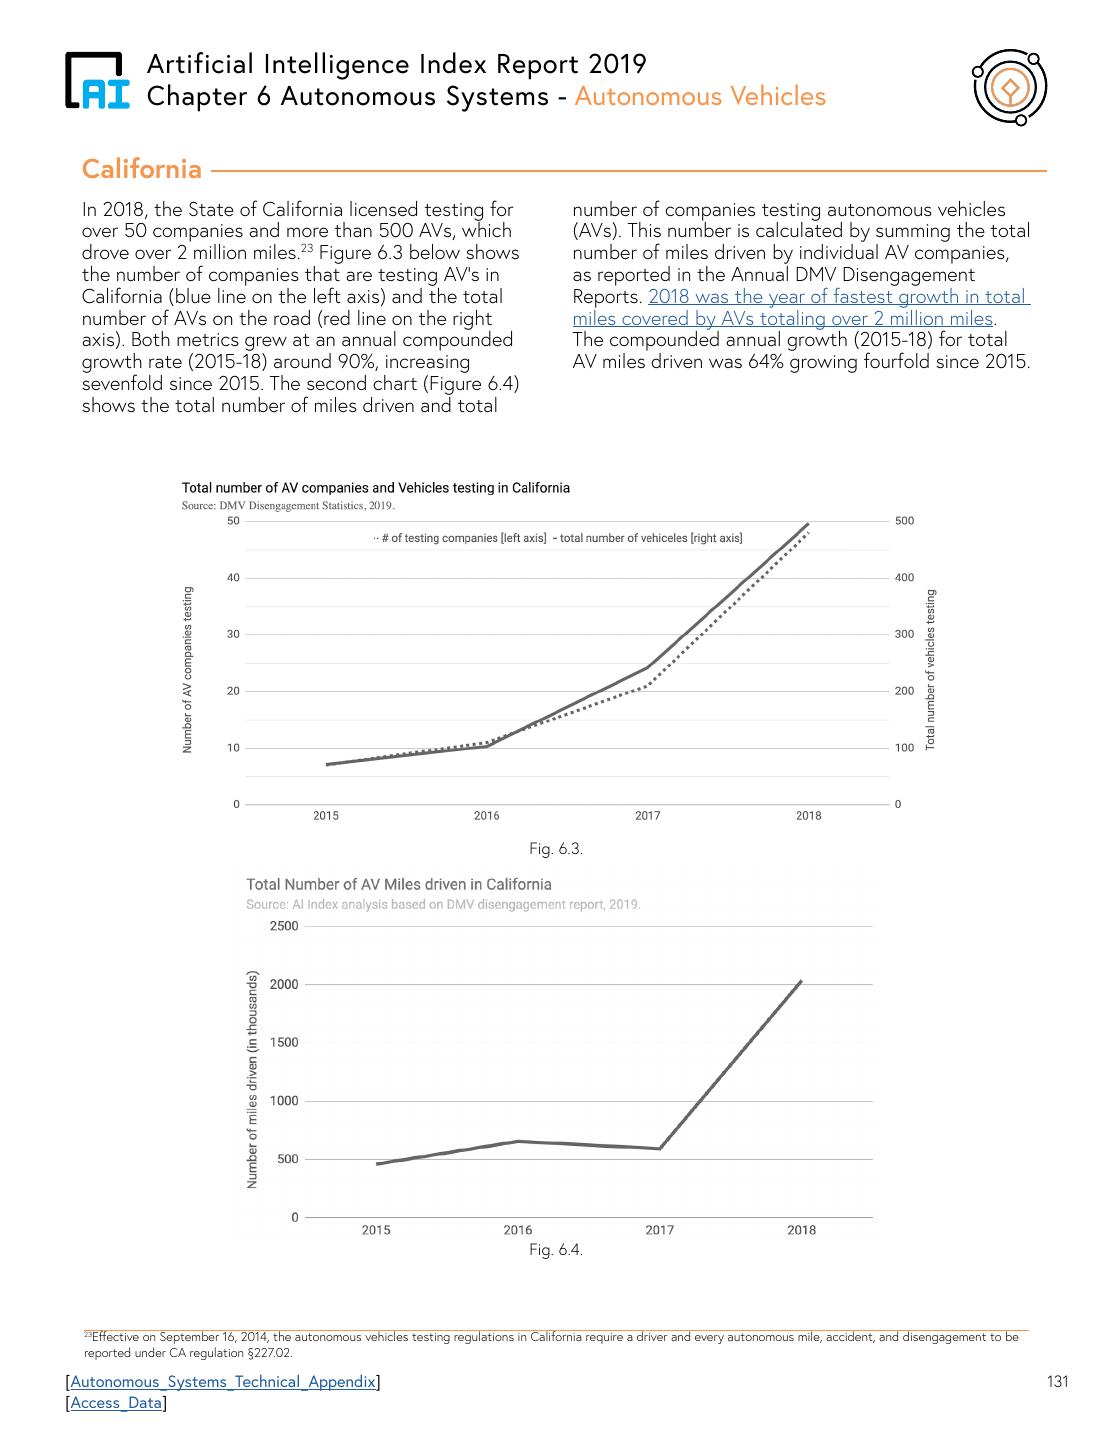
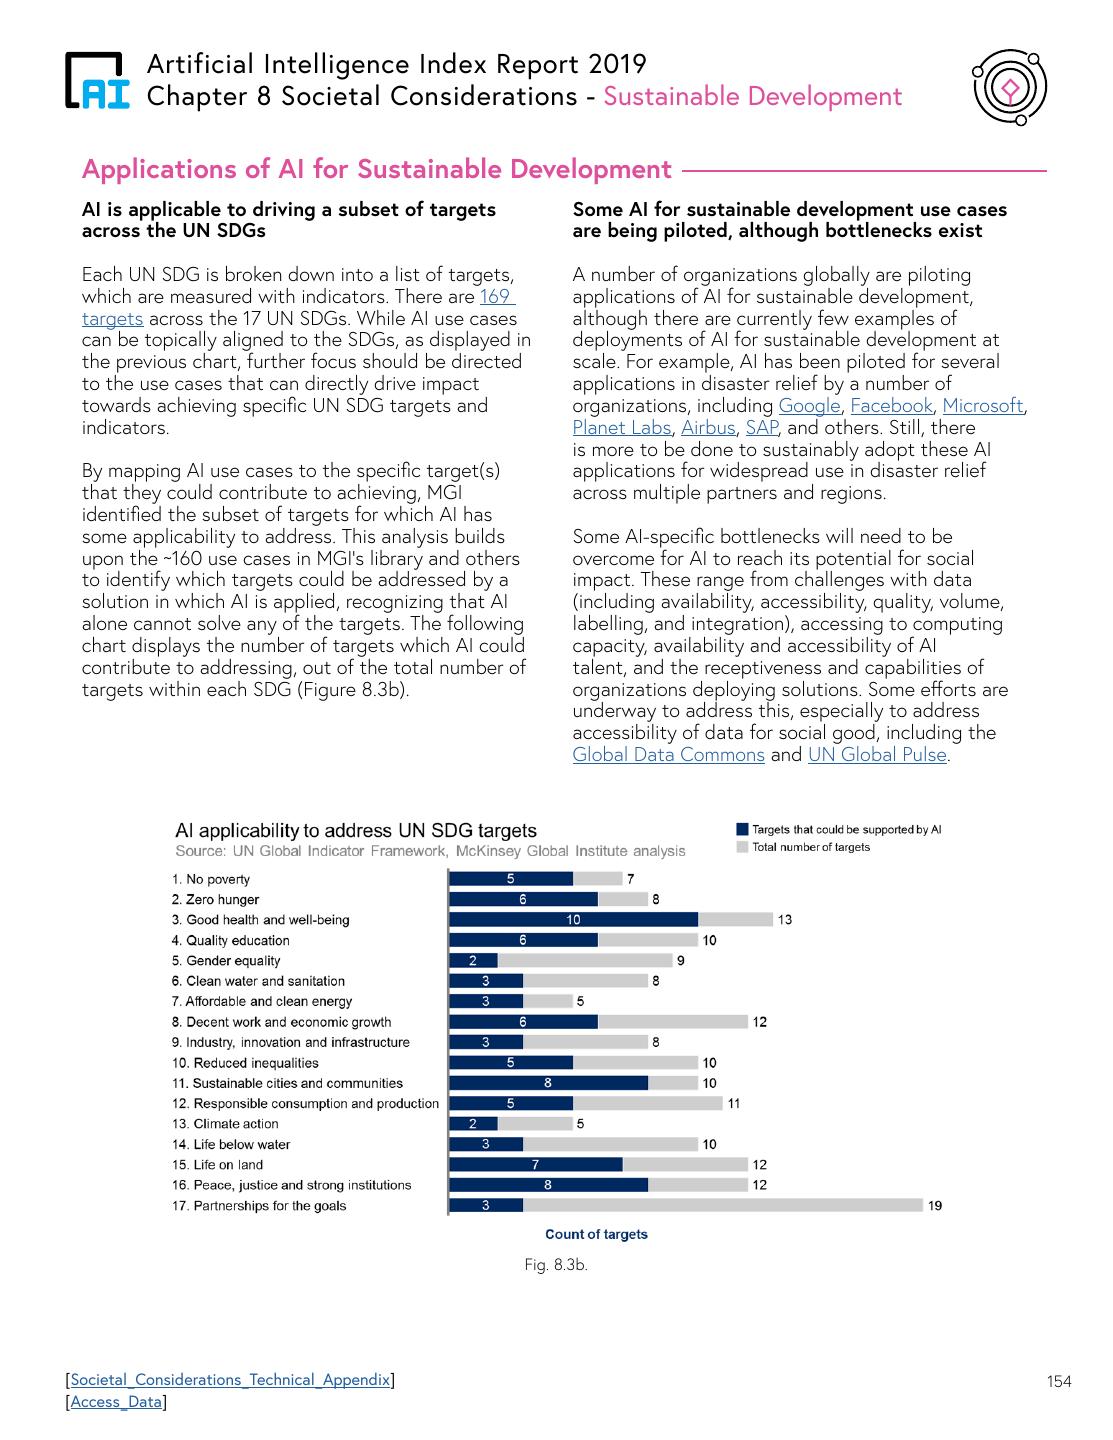
8 . Artificial Intelligence Index Report 2019 AI Index Report - Highlights AI Index 2019 Report Highlights 6. Autonomous Systems • The total number of miles driven and total number of companies testing autonomous vehicles (AVs) in California has grown over seven-fold between 2015-2018. In 2018, the State of California licensed testing for over 50 companies and more than 500 AVs, which drove over 2 million miles. 7. Public Perception • Global central bank communications demonstrate a keen interest in AI, especially from the Bank of England, Bank of Japan, and the Federal Reserve. • There is a significant increase in AI related legislation in congressional records, committee reports, and legislative transcripts around the world. 8. Societal Considerations • Fairness, Interpretability and Explainability are identified as the most frequently mentioned ethical challenges across 59 Ethical AI principle documents. • In over 3600 global news articles on ethics and AI identified between mid-2018 and mid-2019, the dominant topics are framework and guidelines on the ethical use of AI, data privacy, the use of face recognition, algorithm bias and the role of big tech. • AI can contribute to each of the 17 United Nations (UN) Sustainable Development Goals (SDGs) through use cases identified to-date that address about half of the 169 UN SDG targets, but bottlenecks still need to be overcome to deploy AI for sustainable development at scale. [Table_of_Contents] 7
9 . Artificial Intelligence Index Report 2019 AI Index Report - Public Data and Tools PUBLIC DATA AND TOOLS The AI Index 2019 Report supplements the main report with three additional resources: The raw data underlying the report, and two interactive tools, detailed below. We invite each member of the AI community to use these tools and data in a way most relevant to their work and interests. Public Data The public data is available on Google Drive. The Graphics folder provides hi-res images for all the charts. The Technical Appendix contains sources, methodologies, and nuances. Tools • For those who want to focus on the extensive global data included in the report, we offer for the first time the Global AI Vibrancy Tool - vibrancy.aiindex.org - an interactive tool that compares countries across 34 indicators, including both a cross-country perspective and an intra-country drill down. • The AI Index arXiv Monitor - arxiv.aiindex.org - is another tool that enables search of the full text of papers published to this pre-print repository, providing the most up-to-date snapshot of technical progress in AI. [Table_of_Contents] 8
10 . Artificial Intelligence Index Report 2019 Acknowledgements Acknowledgements We appreciate the individuals who provided data, advice, and expert commentary for inclusion in the AI Index 2019 report (in alphabetic organization order): arXiv Paul Ginsparg, Joe Halpern BloombergGOV Chris Cornillie BurningGlass Technologies Bledi Taska, Layla O’Kane Campaign to Stop Killer Robots Marta Kosmyna Computing Research Association (CRA) Andrew Bernat, Susan Davidson, Betsy Bizot Coursera Vinod Bakthavachalam, Eva Nierenberg Elsevier Maria de Kleijn, Clive Bastin, Sarah Huggett, Mark Siebert, Jörg Hellwig GDELT Project Kalev Leetaru Indeed Carrie Engel Intento Konstantin Savenkov, Grigory Sapunov International Federation of Robotics Susanne Bieller Joint Research Center, European Commision Alessandro Annoni, Giuditta DePrato LinkedIn Guy Berger, Di Mo, Mar Carpanelli, Virginia Ramsey Metaculus Ben Goldhaber, Jacob Lagerros McKinsey Global Institute Monique Tuin, Jake Silberg Microsoft Academic Graph (MAG) Kuansan Wang, Iris Shen, Yuxiao Dong [Table_of_Contents] 9
11 . Artificial Intelligence Index Report 2019 Acknowledgements NESTA Juan Mateos-Garcia, Kostas Stathoulopoulos, Joel Klinger Paperwithcode Robert Stojnic PricewaterhouseCoopers (PwC) Anand Rao, Ilana Golbin, Vidhi Tembhurnikar Quid Cara Connors, Julie Kim, Daria Mehra, Dan Buczaczer, Maggie Mazzetti RightsCon Nikki Gladstone, Fanny Hidvégi, Sarah Harper Stanford University Percy Liang, Mehran Sahami, Dorsa Sadigh, James Landay Stockholm International Peace Research Institute (SIPRI) Vincent Boulanin, Maaike Verbruggen Udacity Leah Wiedenmann and Rachel Kim All the conference and university contributors; AI4All board; Bloomberg Philanthropies; WiML board; Pedro Avelar (UFRGS), Dhruv Batra (Georgia Tech / FAIR); Zoe Bauer; Sam Bowman (NYU); Cody Coleman (Stanford); Casey Fiesler (University of Colorado Boulder); Brenden Lake (NYU); Calvin LeGassick; Natalie Garrett (University of Colorado Boulder); Bernard Ghanem (King Abdullah University of Science and Technology); Carol Hamilton (AAAI); Arthur Jago (University of Washington Tacoma); Zhao Jin (University of Rochester); Lars Kotthoff (University of Wyoming); Luis Lamb (Federal University of Rio Grande do Sul); Fanghzhen Lin (Hong Kong University of Science and Technology); Don Moore (UC Berkeley Haas School of Business), Avneesh Saluja (Netflix), Marcelo Prates (UFRGS), Michael Gofman (University of Rochester); Roger McCarthy (McCarthy Engineering); Devi Parikh (Georgia Tech / FAIR); Lynne Parker (White House Office of Science and Technology Policy); Daniel Rock (MIT); Ayush Shrivastava (Georgia Tech College of Computing); Cees Snoek (University of Amsterdam); Fabro Steibel (ITS-RIO); Prasanna Tambe (Wharton); Susan Woodward (Sandhill Econometrics); Chenggang Xu (Cheung Kong Graduate School of Business). Matthew Kenney (Duke University) built the arXiv search engine tool. Tamara Pristc (Stanford) and Agata Foryciarz (Stanford) provided research contributions. Biswas Shrestha (Stanford) supported editing. Special thank you to Monique Tuin (McKinsey Global Institute) for invaluable comments and feedback. Michael Chang (graphic design and cover art), Kevin Litman-Navarro (data visualization), Ruth Starkman (editor) and Biswas Shrestha (Stanford) were integral to the daily production of the report. [Table_of_Contents] 10
12 . Artificial Intelligence Index Report 2019 AI Index Report Overview SYMBOLS Pages appear with following symbols that denote global, sectoral, sub-regional, or other attributes for a given chapter. Beginning: The first section of each chapter generally corresponds to either global, national, or regional metrics. Middle: The middle section of each chapter corresponds to sectoral, cross country comparisons, or deep dives specific to each chapter. End: The end section of each chapter offers sub- regional and state level analyses, results from cities, and data relevant to societal considerations of AI such as ethics and applications to the UN Sustainable Development Goals (SDG’s) metrics. Measurement Questions: Each chapter concludes with a short discussion on measurement questions related data and metrics presented in the chapter. [Table_of_Contents] 11
13 . Artificial Intelligence Index Report 2019 Chapter 1 Research and Development Chapter Preview Journal Publications: Elsevier 14 Papers on arXiv 21 Microsoft Academic Graph Journals 24 Conferences 27 Patents 30 Github Stars 33 Women in AI Research 34 Measurement Questions 36 Chapter 1: Research and Development [Table_of_Contents] [Research_Development_Technical_Appendix]
14 . Artificial Intelligence Index Report 2019 Chapter 1 Research and Development - Introduction Introduction This chapter presents bibliometrics data, including volume of journal, conference and patent publications and their citation impacts by world regions. The chapter also presents Github Stars for key AI software libraries followed by societal considerations and gender diversity of AI researchers based on arXiv. The Report has used different datasets to comprehensively assess the state of AI R&D activities around the world. The MAG dataset covers more publications than Elsevier’s Scopus, which is mostly limited to peer-reviewed publications, but there are also publications on Scopus that are not in MAG.2 arXiv, an online repository of electronic preprints, reflects the growing tendency of certain parts of the field of AI, particularly those depending on machine learning, to post papers before peer review, so reflects recent work more quickly than the other sources. Our arXiv Monitor tool uses full-text papers to quickly identify new results. 2 see these studies by Anne-Wil Harzing and Martijn Visser. 13
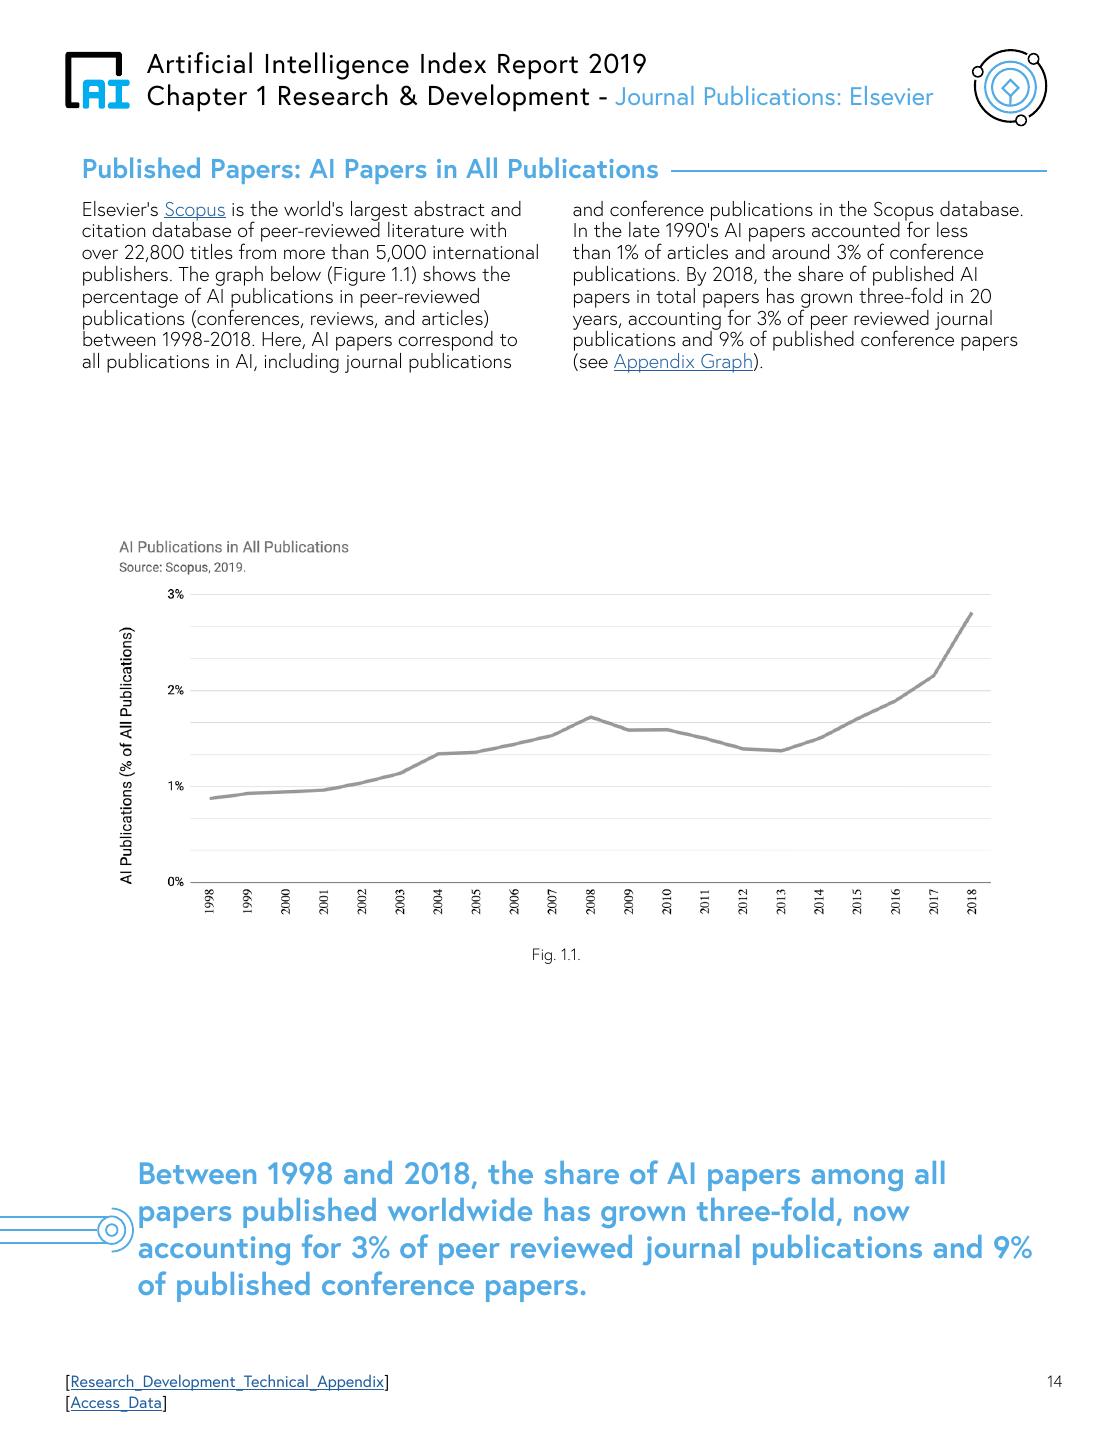
15 . Artificial Intelligence Index Report 2019 Chapter 1 Research & Development - Journal Publications: Elsevier Published Papers: AI Papers in All Publications Elsevier’s Scopus is the world’s largest abstract and and conference publications in the Scopus database. citation database of peer-reviewed literature with In the late 1990’s AI papers accounted for less over 22,800 titles from more than 5,000 international than 1% of articles and around 3% of conference publishers. The graph below (Figure 1.1) shows the publications. By 2018, the share of published AI percentage of AI publications in peer-reviewed papers in total papers has grown three-fold in 20 publications (conferences, reviews, and articles) years, accounting for 3% of peer reviewed journal between 1998-2018. Here, AI papers correspond to publications and 9% of published conference papers all publications in AI, including journal publications (see Appendix Graph). Fig. 1.1. Between 1998 and 2018, the share of AI papers among all papers published worldwide has grown three-fold, now accounting for 3% of peer reviewed journal publications and 9% of published conference papers. [Research_Development_Technical_Appendix] 14 [Access_Data]
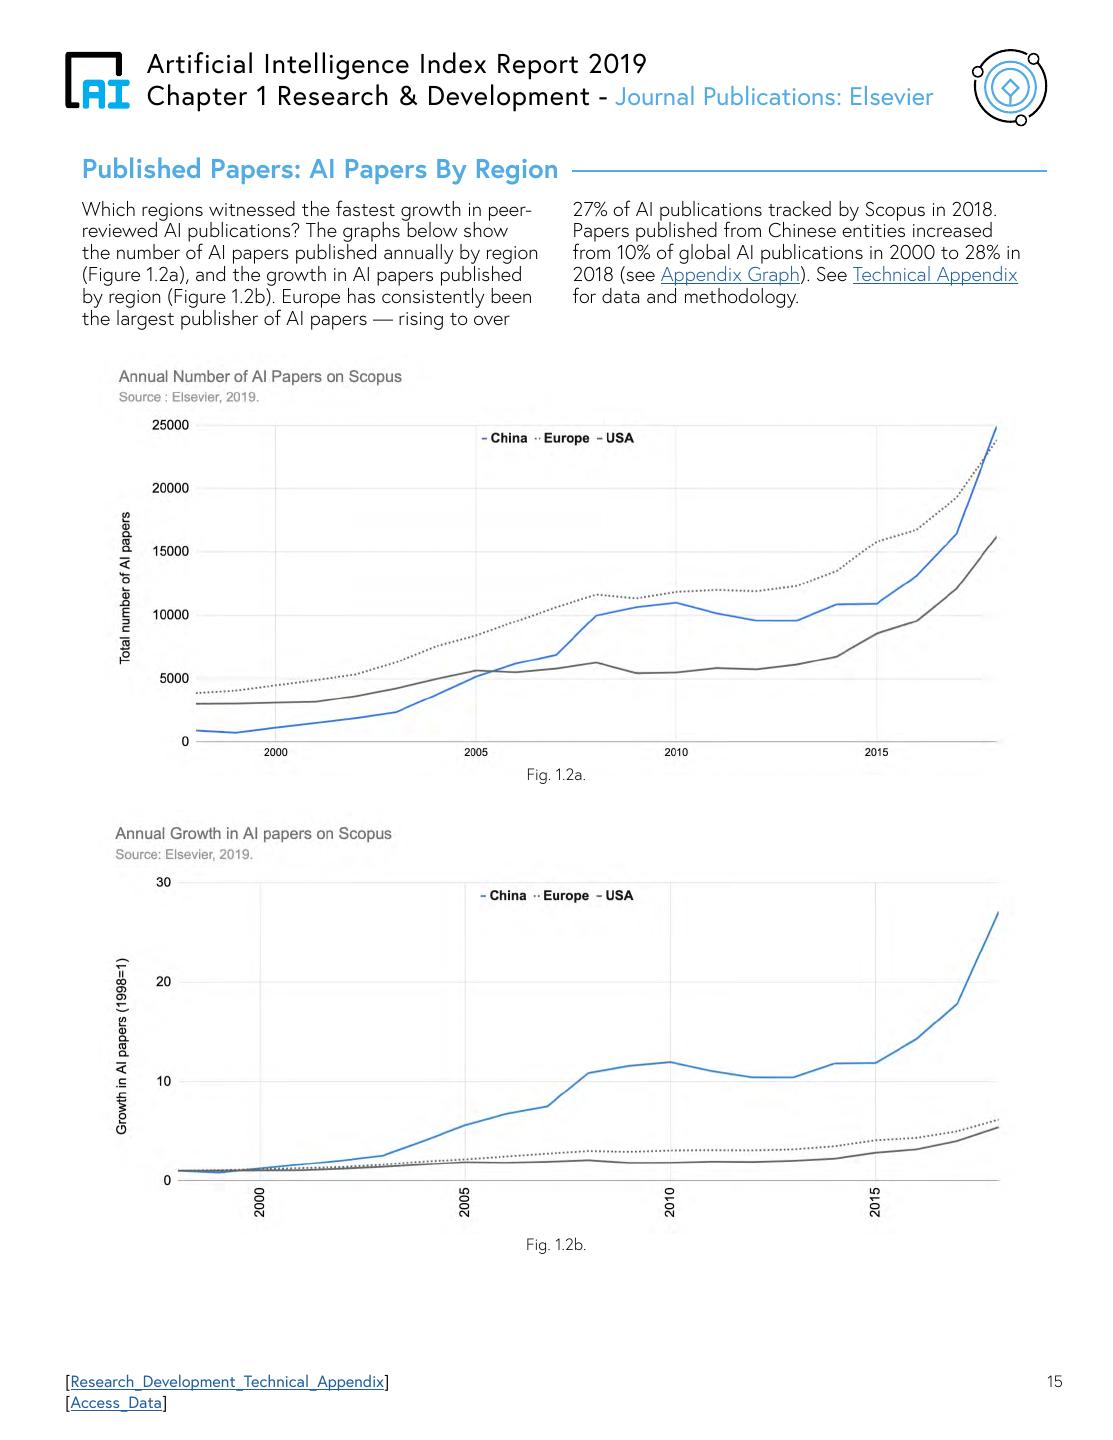
16 . Artificial Intelligence Index Report 2019 Chapter 1 Research & Development - Journal Publications: Elsevier Published Papers: AI Papers By Region Which regions witnessed the fastest growth in peer- 27% of AI publications tracked by Scopus in 2018. reviewed AI publications? The graphs below show Papers published from Chinese entities increased the number of AI papers published annually by region from 10% of global AI publications in 2000 to 28% in (Figure 1.2a), and the growth in AI papers published 2018 (see Appendix Graph). See Technical Appendix by region (Figure 1.2b). Europe has consistently been for data and methodology. the largest publisher of AI papers — rising to over Fig. 1.2a. Fig. 1.2b. [Research_Development_Technical_Appendix] 15 [Access_Data]
17 . Artificial Intelligence Index Report 2019 Chapter 1 Research & Development - Journal Publications: Elsevier Published Papers: Institutional Affiliation The following graphs show the number of Scopus In the US., a relatively large proportion of AI papers papers affiliated with government, corporate, are affiliated with corporations. In 2018, the number medical, and other organizations in China (Figure of corporate-affiliated AI papers in the US was over 1.3a), the United States (Figure 1.3b), and Europe seven times the proportion of corporate AI papers in (Figure 1.3c). Excluding academia, the graphs show China, and almost twice that of Europe. that government-affiliated institutions contribute the highest number of AI publications in China and Note that in all three regions, academic papers Europe, whereas, corporate-affiliated AI papers make (not shown) outweigh government, corporate, and up a higher proportion in the US medical papers by a large margin, making up 92% of AI publications from China, 90% from Europe, In 2018, Chinese government institutions produced and 85% from the US Growth trends of institutional nearly three times more AI papers than Chinese affiliation dynamics are available in the Appendix. corporations. China has also seen a 300-fold increase in government-affiliated AI papers since 1998, while corporate AI papers increased by 66-fold in the same period. Fig. 1.3a. [Research_Development_Technical_Appendix] 16 [Access_Data]
18 . Artificial Intelligence Index Report 2019 Chapter 1 Research & Development - Journal Publications: Elsevier Published Papers: Institutional Affiliation Fig. 1.3b. Fig. 1.3c. Note: Europe refers to EU44. [Research_Development_Technical_Appendix] 17 [Access_Data]
19 . Artificial Intelligence Index Report 2019 Chapter 1 Research & Development - Journal Publications: Elsevier Published Papers: Citation impact by region The graph below (Figure 1.4) shows the average field- While Europe has the largest number of annually weighted citation impact of AI authors by region. A published AI papers in Scopus, Europe’s FWCI has region’s Field-Weighted Citation Impact (FWCI) remained relatively flat and on-par with the world is the average number of citations received by AI average. In contrast, China has increased its FWCI publications originating from that region divided by considerably. Still, the US outperforms other regions the average number of citations by all AI publications in total citations. Authors from the US are cited worldwide in the same publication year, subject area, 40% more than the global average. See Technical and document type. Appendix for data and definitions. Both the US and China are gaining in prominence in Field-Weighted In this visual, the citation impacts are shown Download Impact (FWDI) of AI publications (see relative to the world average for AI, whose FWCI Appendix Graph). is normalized at 1. A re-based FWCI of 1 indicates that the publications have been cited on par with the world average for AI. A re-based FWCI of 0.85 indicates that the papers are 15% less cited than the world average for AI. Fig. 1.4. “China has consistently increased its footprint in AI research, both in terms of volume and quality. Their advance is truly remarkable.” Maria de Kleijn, SVP Analytical Services, Elsevier [Research_Development_Technical_Appendix] 18 [Access_Data]
20 . Artificial Intelligence Index Report 2019 Chapter 1 Research & Development - Journal Publications: Elsevier Cross Country Trends in Impact and Academic-Corporate Collaboration In recent years it’s increasingly common for identified through publications with at least one AI-focused companies to conduct research in author with an academic affiliation and at least partnership with colleagues in academia. This map one author with a corporate affiliation. Academic- (Figure 1.5a) shows the quantity of academic- corporate AI collaborations are largely prevalent in corporate collaborations in different countries around the US, China, Japan, France, Germany, and the UK. the world. Academic-corporate collaborations are World Map of Academic-Corporate Collaboration: Total Number of AI papers Source: Scopus, 2019. Fig. 1.5a. Academic-corporate AI collaborations are prevalent in the US, China, France, Hong Kong, Switzerland, Canada, Japan, Germany, and the UK. US Authors are cited 40% more than the global average. [Research_Development_Technical_Appendix] 19 [Access_Data]
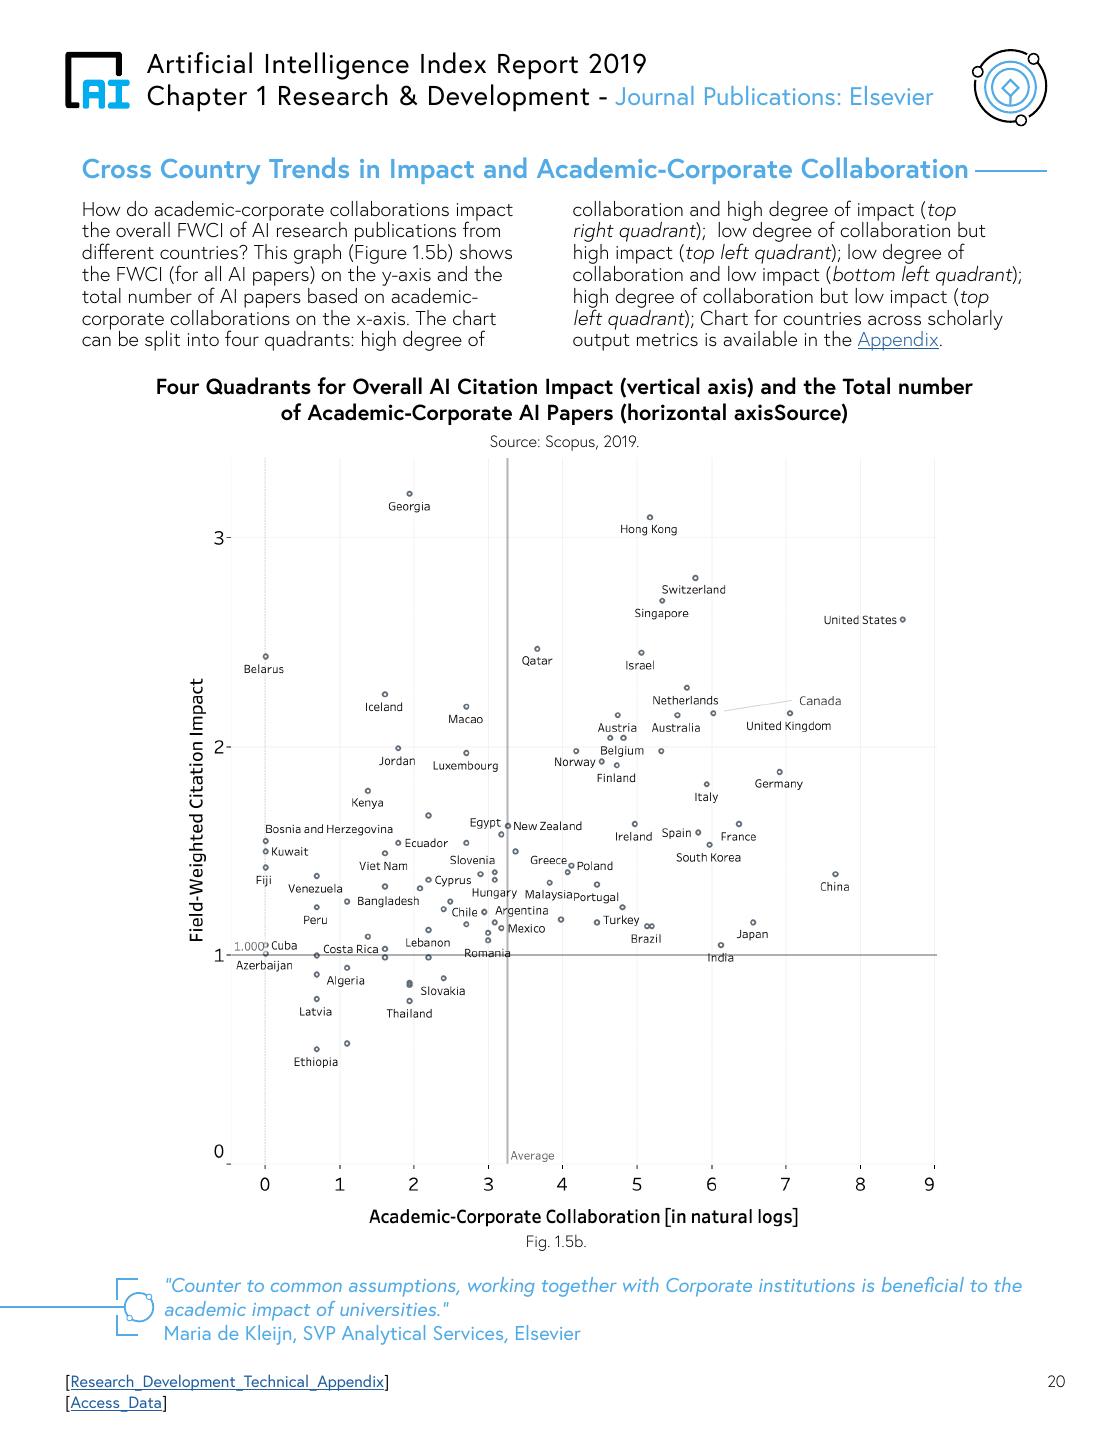
21 . Artificial Intelligence Index Report 2019 Chapter 1 Research & Development - Journal Publications: Elsevier Cross Country Trends in Impact and Academic-Corporate Collaboration How do academic-corporate collaborations impact collaboration and high degree of impact (top the overall FWCI of AI research publications from right quadrant); low degree of collaboration but different countries? This graph (Figure 1.5b) shows high impact (top left quadrant); low degree of the FWCI (for all AI papers) on the y-axis and the collaboration and low impact (bottom left quadrant); total number of AI papers based on academic- high degree of collaboration but low impact (top corporate collaborations on the x-axis. The chart left quadrant); Chart for countries across scholarly can be split into four quadrants: high degree of output metrics is available in the Appendix. Four Quadrants for Overall AI Citation Impact (vertical axis) and the Total number of Academic-Corporate AI Papers (horizontal axisSource) Source: Scopus, 2019. Fig. 1.5b. “Counter to common assumptions, working together with Corporate institutions is beneficial to the academic impact of universities.” Maria de Kleijn, SVP Analytical Services, Elsevier [Research_Development_Technical_Appendix] 20 [Access_Data]
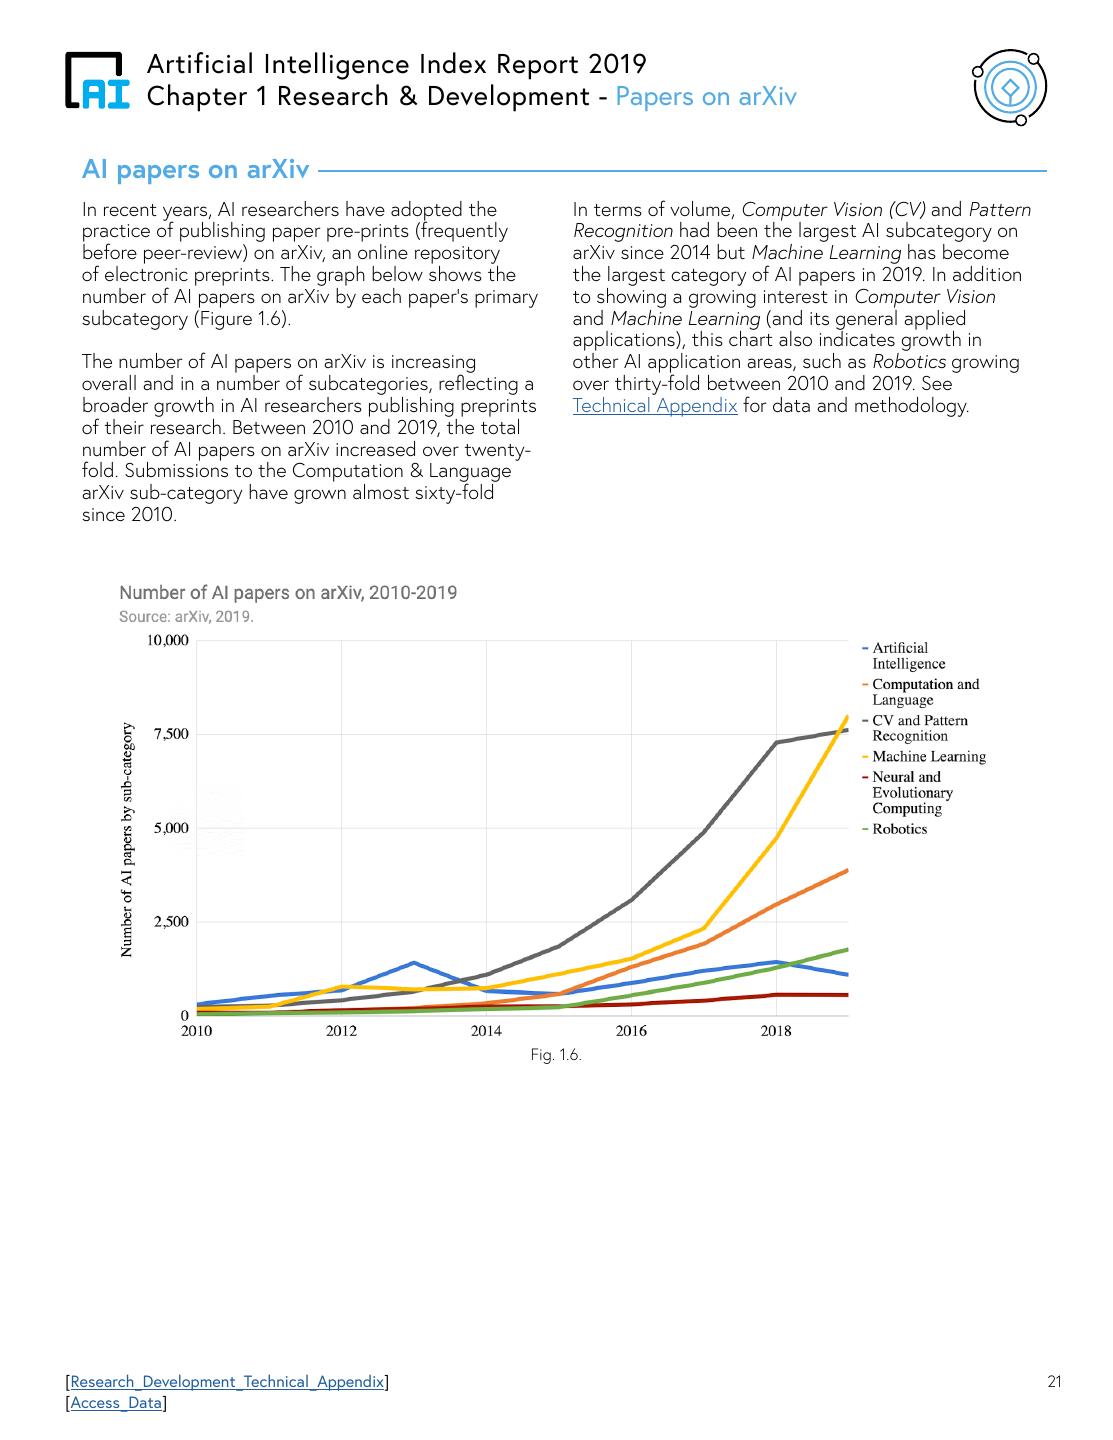
22 . Artificial Intelligence Index Report 2019 Chapter 1 Research & Development - Papers on arXiv AI papers on arXiv In recent years, AI researchers have adopted the In terms of volume, Computer Vision (CV) and Pattern practice of publishing paper pre-prints (frequently Recognition had been the largest AI subcategory on before peer-review) on arXiv, an online repository arXiv since 2014 but Machine Learning has become of electronic preprints. The graph below shows the the largest category of AI papers in 2019. In addition number of AI papers on arXiv by each paper’s primary to showing a growing interest in Computer Vision subcategory (Figure 1.6). and Machine Learning (and its general applied applications), this chart also indicates growth in The number of AI papers on arXiv is increasing other AI application areas, such as Robotics growing overall and in a number of subcategories, reflecting a over thirty-fold between 2010 and 2019. See broader growth in AI researchers publishing preprints Technical Appendix for data and methodology. of their research. Between 2010 and 2019, the total number of AI papers on arXiv increased over twenty- fold. Submissions to the Computation & Language arXiv sub-category have grown almost sixty-fold since 2010. Fig. 1.6. [Research_Development_Technical_Appendix] 21 [Access_Data]
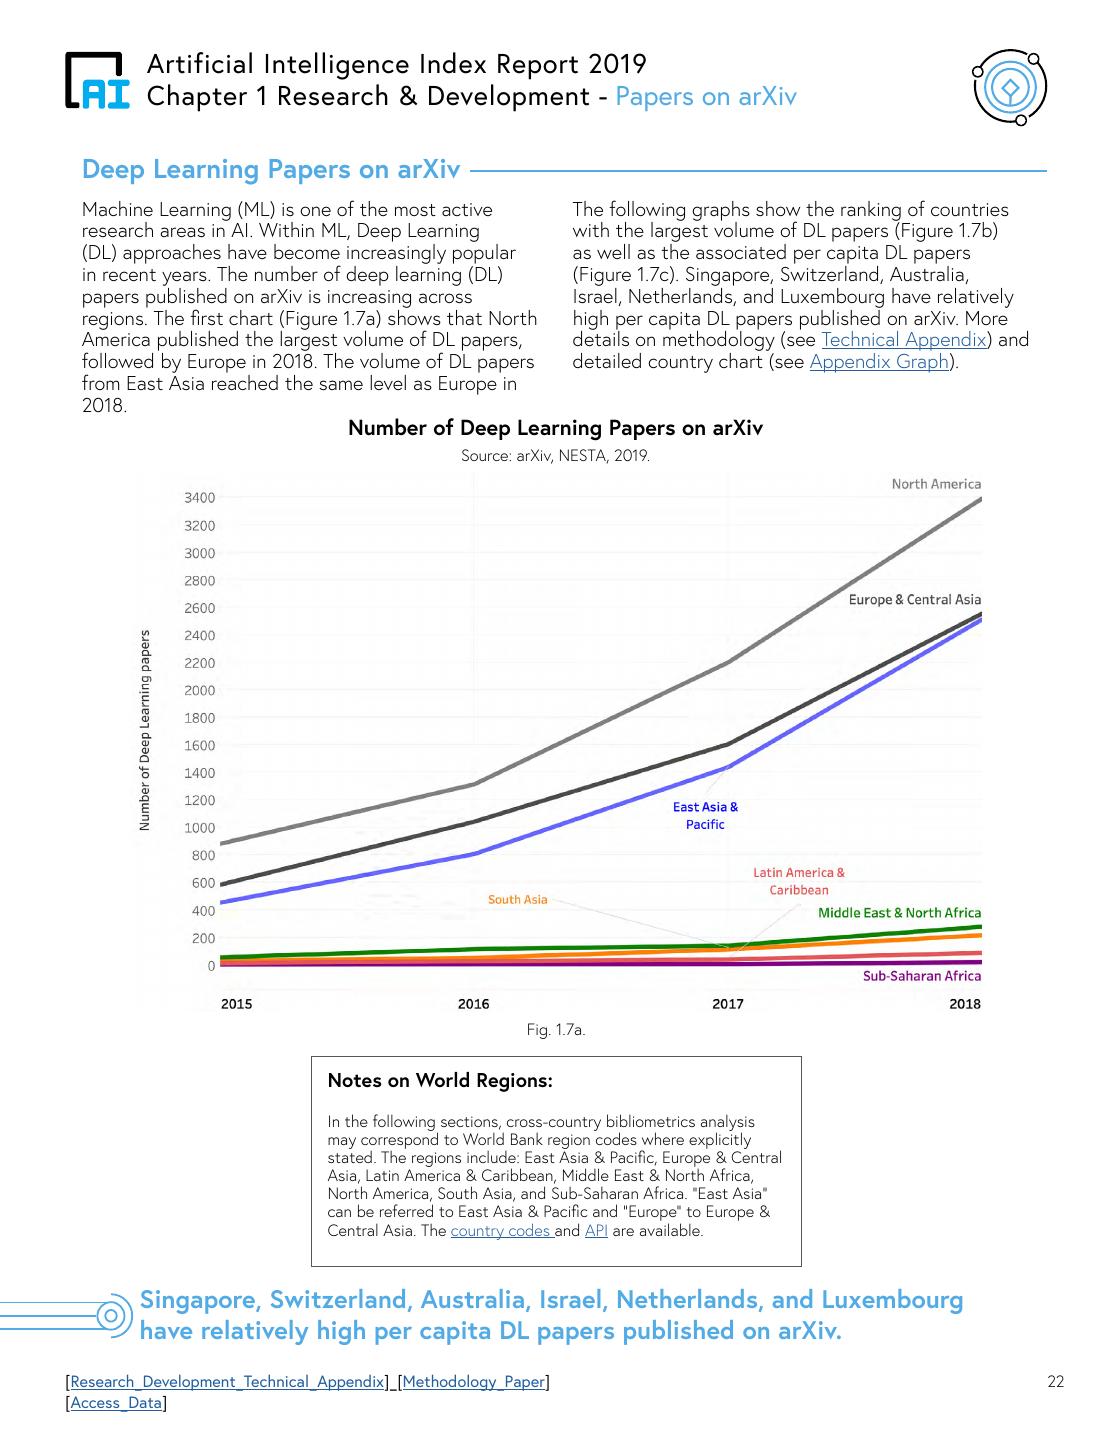
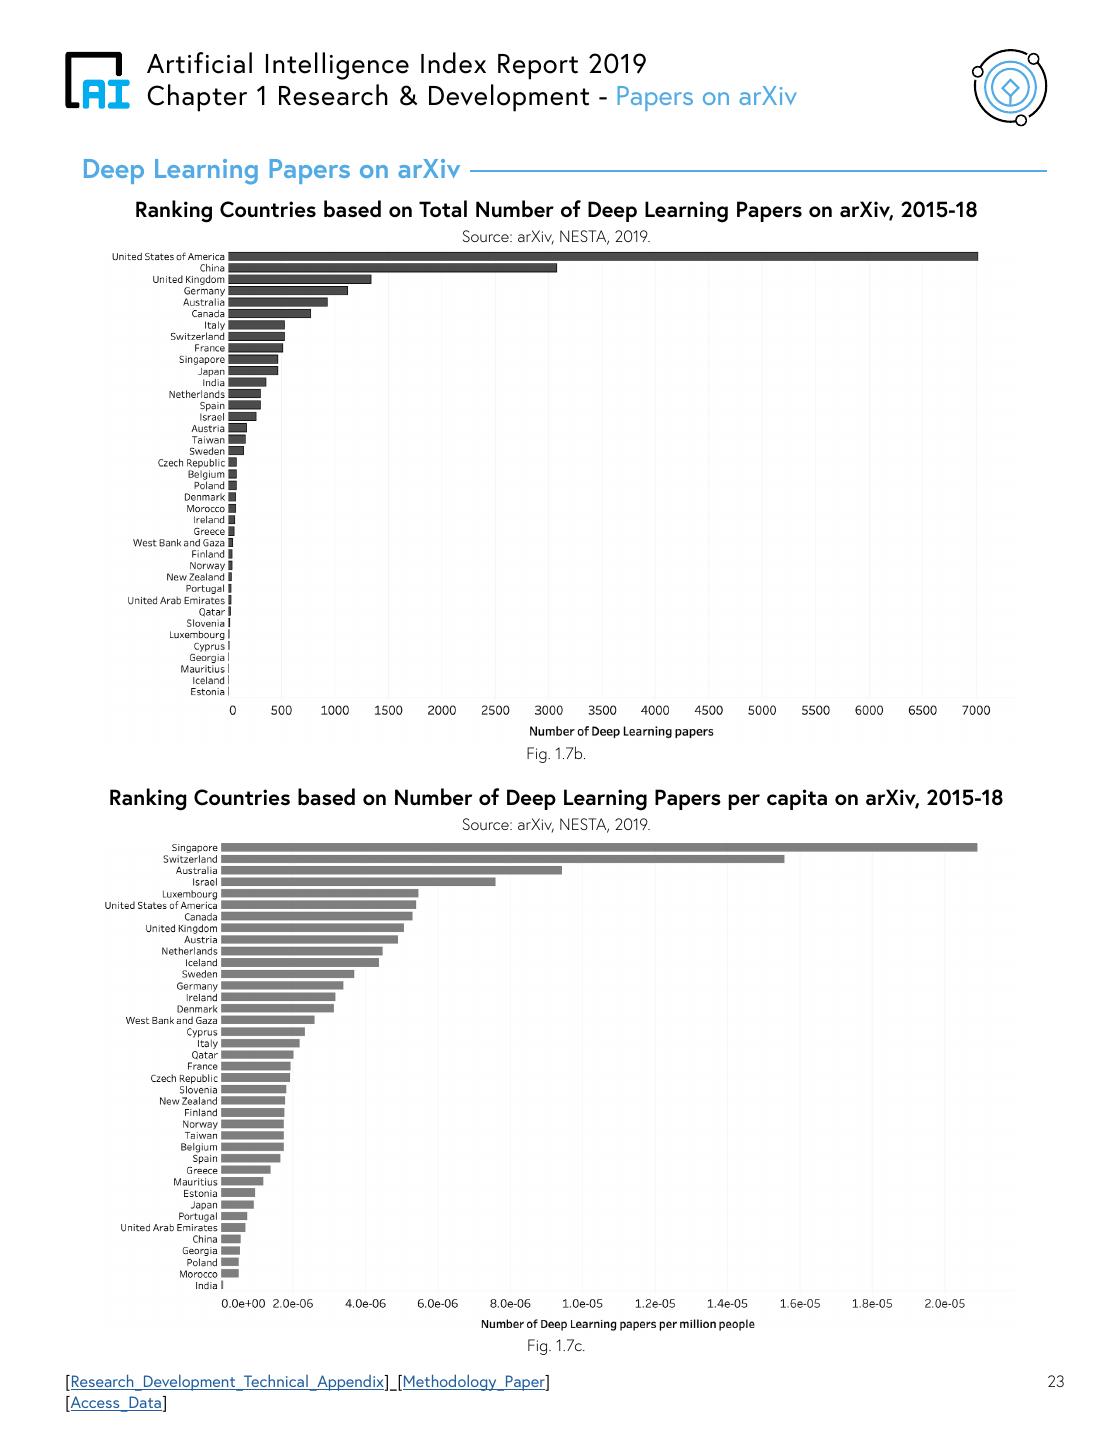
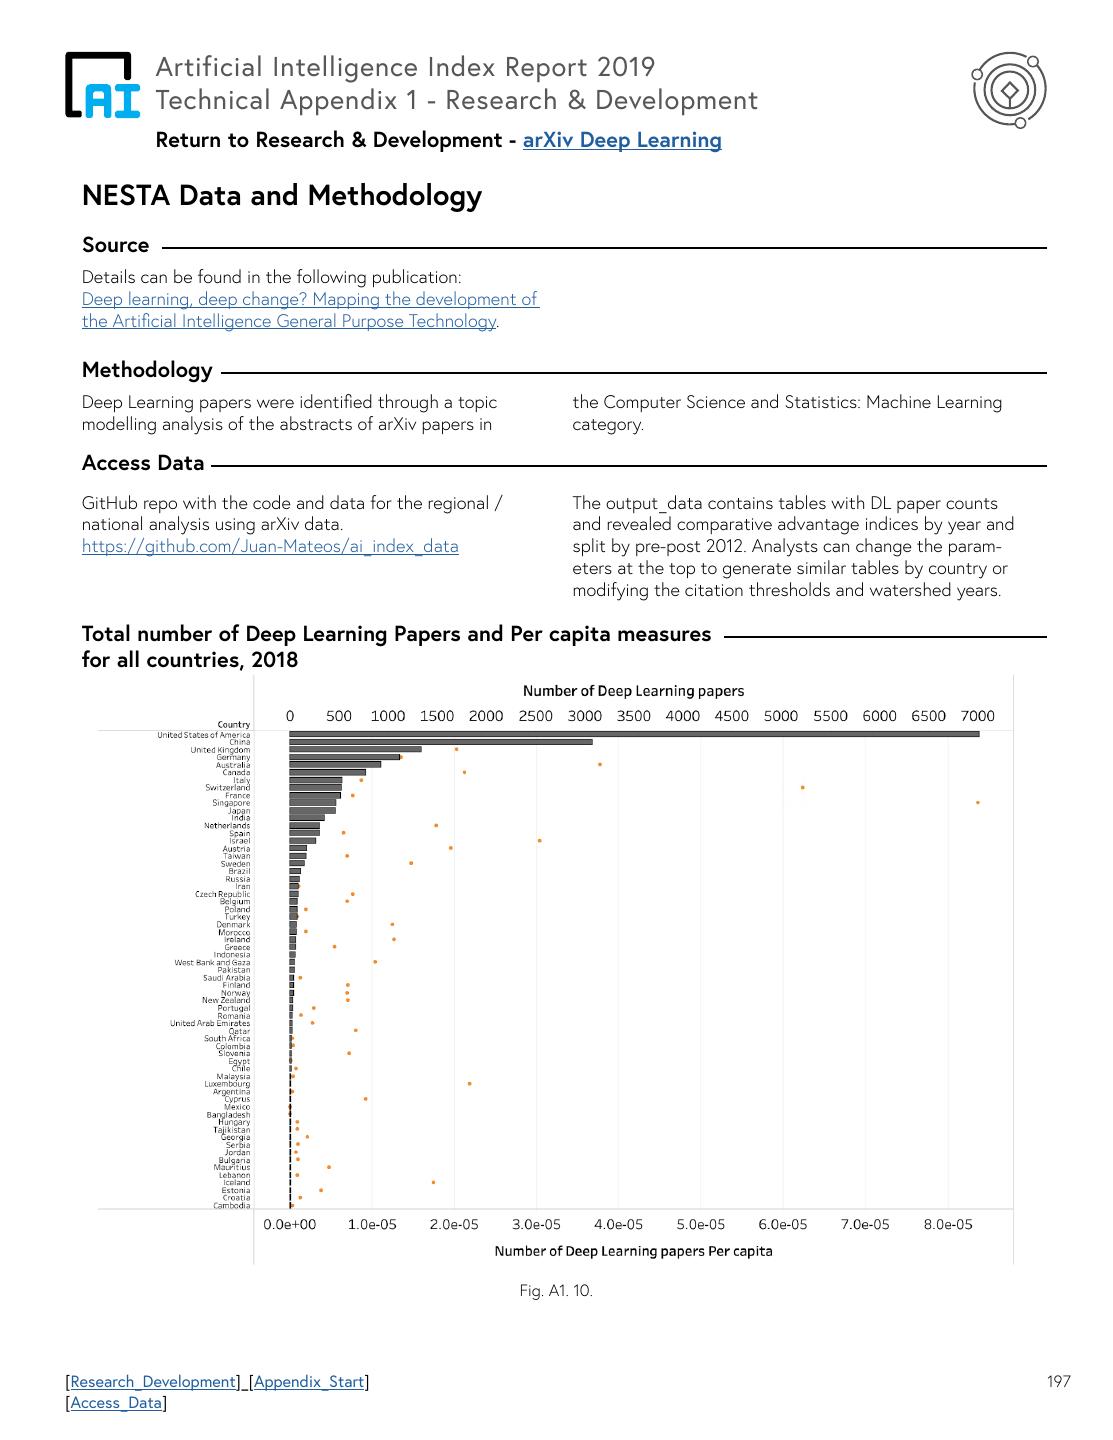
23 . Artificial Intelligence Index Report 2019 Chapter 1 Research & Development - Papers on arXiv Deep Learning Papers on arXiv Machine Learning (ML) is one of the most active The following graphs show the ranking of countries research areas in AI. Within ML, Deep Learning with the largest volume of DL papers (Figure 1.7b) (DL) approaches have become increasingly popular as well as the associated per capita DL papers in recent years. The number of deep learning (DL) (Figure 1.7c). Singapore, Switzerland, Australia, papers published on arXiv is increasing across Israel, Netherlands, and Luxembourg have relatively regions. The first chart (Figure 1.7a) shows that North high per capita DL papers published on arXiv. More America published the largest volume of DL papers, details on methodology (see Technical Appendix) and followed by Europe in 2018. The volume of DL papers detailed country chart (see Appendix Graph). from East Asia reached the same level as Europe in 2018. Number of Deep Learning Papers on arXiv Source: arXiv, NESTA, 2019. Fig. 1.7a. Notes on World Regions: In the following sections, cross-country bibliometrics analysis may correspond to World Bank region codes where explicitly stated. The regions include: East Asia & Pacific, Europe & Central Asia, Latin America & Caribbean, Middle East & North Africa, North America, South Asia, and Sub-Saharan Africa. “East Asia” can be referred to East Asia & Pacific and “Europe” to Europe & Central Asia. The country codes and API are available. Singapore, Switzerland, Australia, Israel, Netherlands, and Luxembourg have relatively high per capita DL papers published on arXiv. [Research_Development_Technical_Appendix]_[Methodology_Paper] 22 [Access_Data]
24 . Artificial Intelligence Index Report 2019 Chapter 1 Research & Development - Papers on arXiv Deep Learning Papers on arXiv Ranking Countries based on Total Number of Deep Learning Papers on arXiv, 2015-18 Source: arXiv, NESTA, 2019. Fig. 1.7b. Ranking Countries based on Number of Deep Learning Papers per capita on arXiv, 2015-18 Source: arXiv, NESTA, 2019. Fig. 1.7c. [Research_Development_Technical_Appendix]_[Methodology_Paper] 23 [Access_Data]
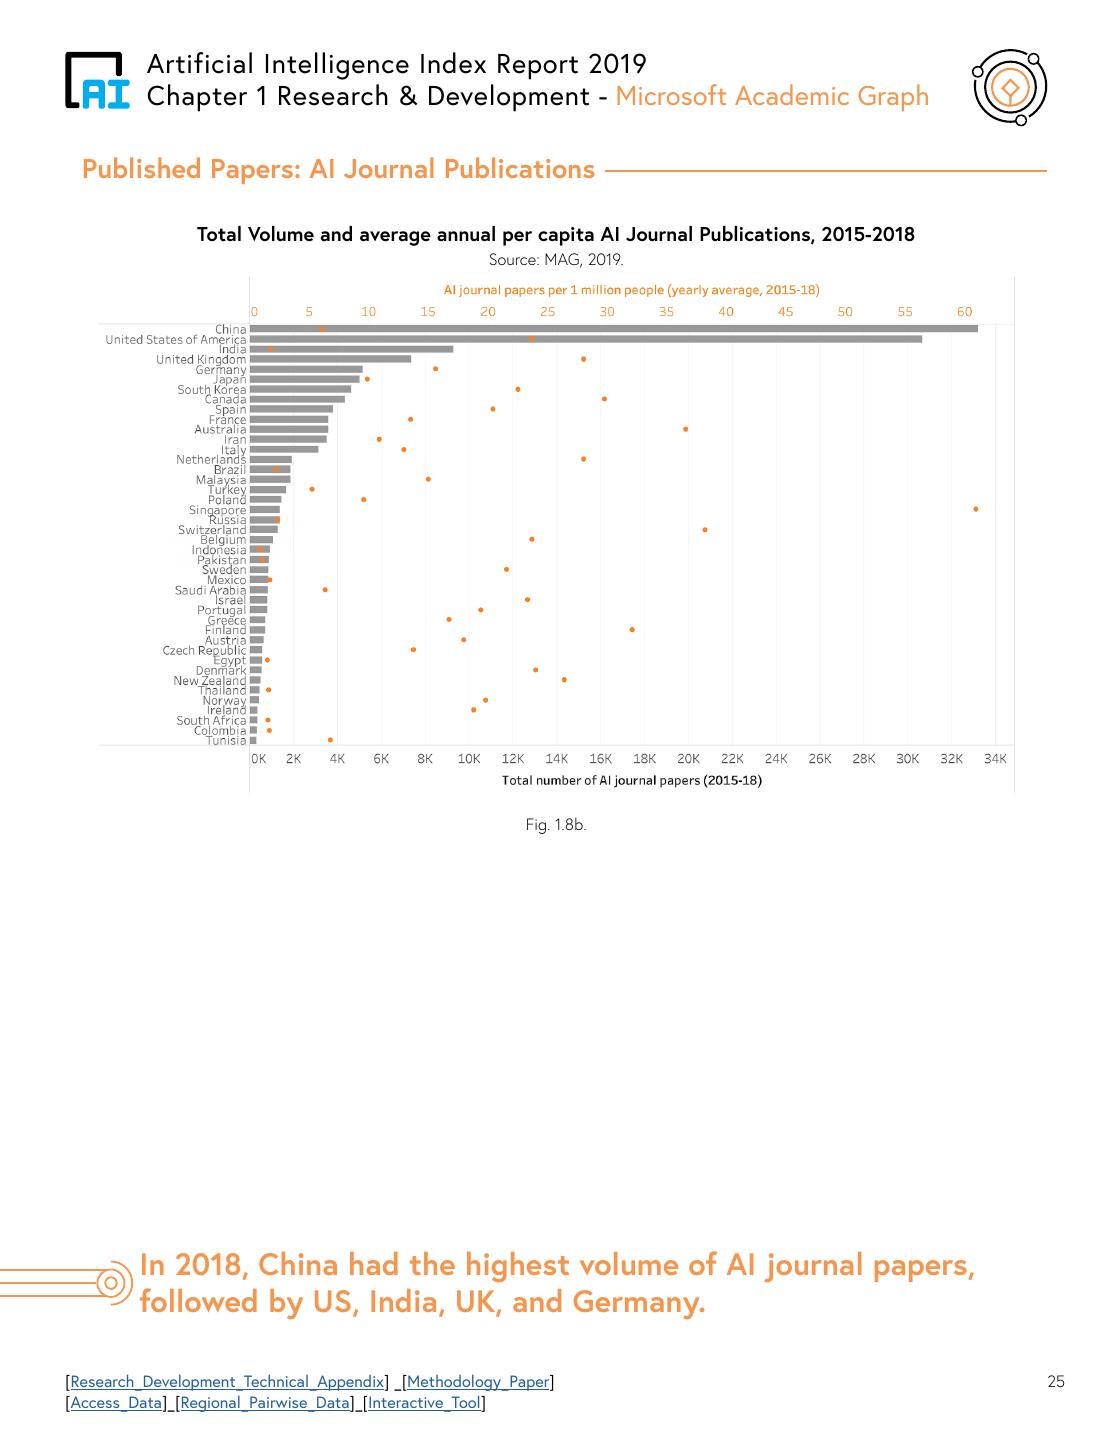
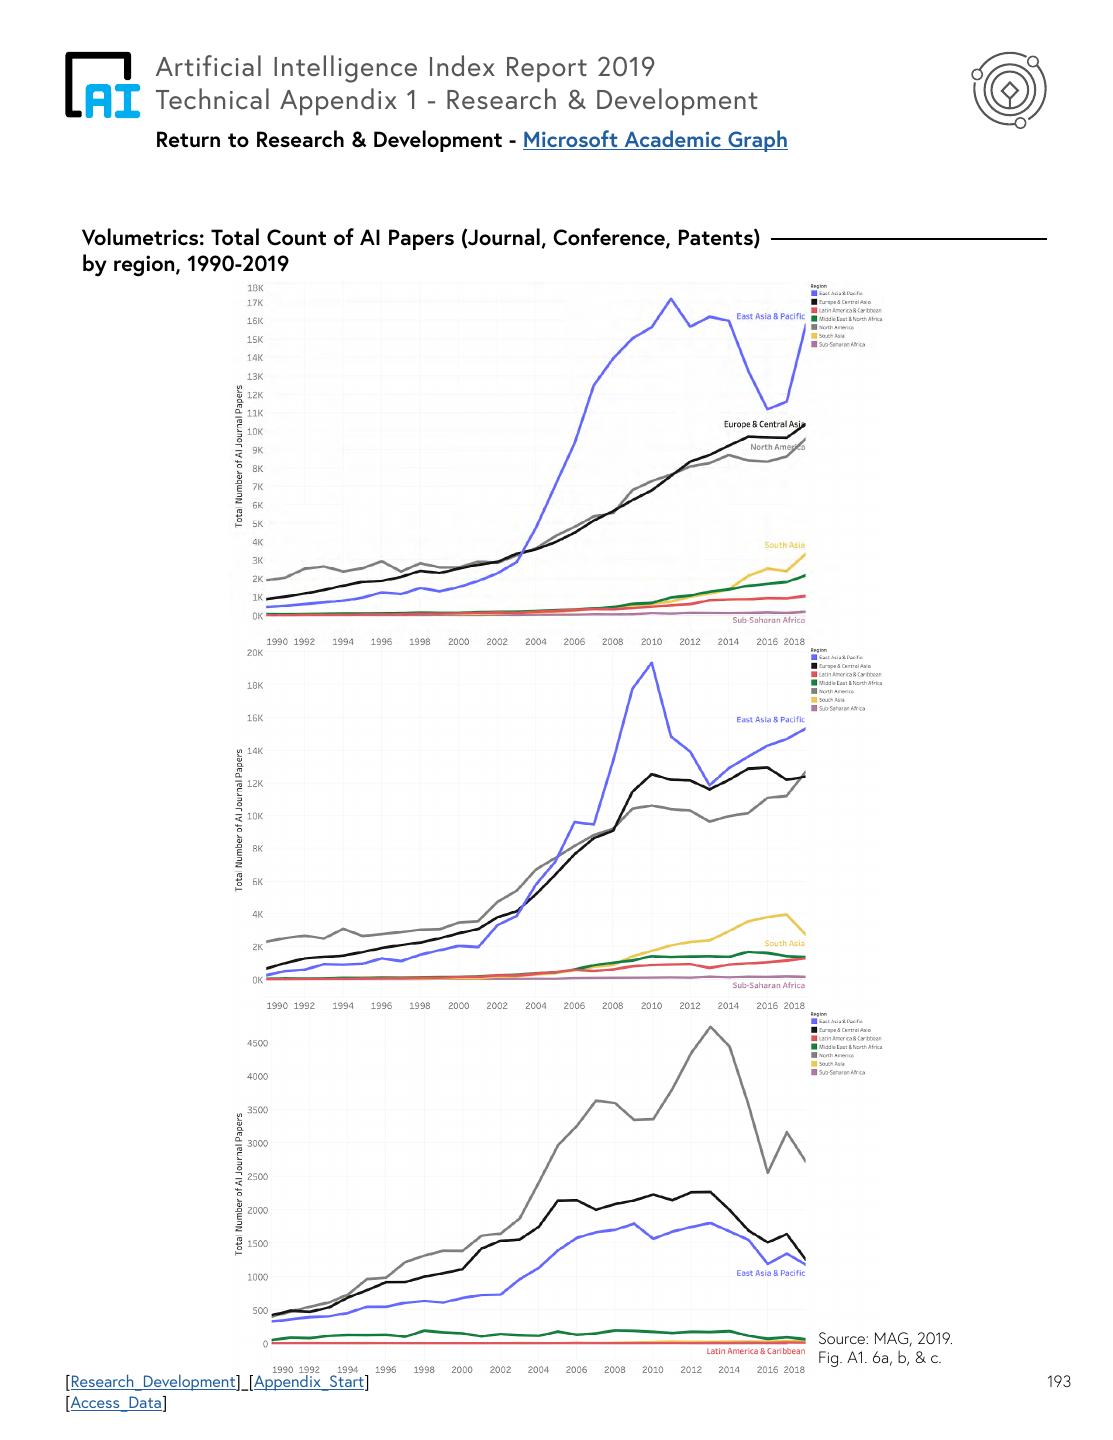
25 . Artificial Intelligence Index Report 2019 Chapter 1 Research & Development - Microsoft Academic Graph Published Papers: AI Journal Publications The graph below (Figure 1.8a) shows the share of AI journal The following graph (Figure 1.8b) shows the total number papers on Microsoft Academic Graph (MAG) by world of journal publications and average journal publications regions between 1990-2018. 37% of published journal per million people between 2015-18. China had the highest papers are attributed to East Asia and Pacific (herein volume of AI papers, followed by the US, India, UK, and referred to as East Asia), 24% to Europe and Central Asia Germany. East Asia has the highest volume of AI journal (herein referred to as Europe), and 22% to the North papers on MAG (see Appendix Graph). America in 2018. The share of South Asia in world AI journal publications has risen steadily to almost 8% in 2018. Share of World AI Journal Publications (%), 1990-2018 Source: MAG, 2019. Fig. 1.8a. [Research_Development_Technical_Appendix] _[Methodology_Paper] 24 [Access_Data]_[Regional_Pairwise_Data]_[Interactive_Tool]
26 . Artificial Intelligence Index Report 2019 Chapter 1 Research & Development - Microsoft Academic Graph Published Papers: AI Journal Publications Total Volume and average annual per capita AI Journal Publications, 2015-2018 Source: MAG, 2019. Fig. 1.8b. In 2018, China had the highest volume of AI journal papers, followed by US, India, UK, and Germany. [Research_Development_Technical_Appendix] _[Methodology_Paper] 25 [Access_Data]_[Regional_Pairwise_Data]_[Interactive_Tool]
27 . Artificial Intelligence Index Report 2019 Chapter 1 Research & Development - Microsoft Academic Graph Published Papers: AI Journal Citation AI journal citation provides a signal for AI R&D Box 1.1 impact. The share of world AI journal citation from •Between 2014-18, 17% of world citation was self- all journal papers in MAG data is presented (see Box citation with East Asia; 15% was self-citation within 1.1). North American papers were most cited by East Europe; 9% was self-citation within North America. Asian authors over 220k times, followed by European authors over 191k times. The interactive graphs are •Between regions, 8% of world citations were East available on the web. Methodology paper A Century Asian journals papers citing North American journal of Science: Globalization of Scientific Collaborations, papers and 7% papers citing North American papers. Citations, and Innovations. •7% of world citations were East Asian journal papers AI journal citations to East Asia journal papers citing European papers. The share of European and account for over 32% of world citations; followed by North American journal papers citing East Asian Europe accounting for over 31%, and North America journals was 5% of world citation each. over 27% of world AI journal citations (Figure 1.9). Note: Percentage of journal citations to unknown country is 19.1%. Self- citation in these sections is referred to citation from one region to the same, not the more conventional author-cites-self interpretation. AI Journal Citation Attributed to Region (% of world journal citations), 2014-18 Source: MAG, 2019. Fig. 1.9. Note: Percentage of journal citations to unknown country is 19.1%. AI journal citations to East Asia journal papers account for over 32% of world citations; followed by Europe accounting for over 31%, and North America over 27% [Research_Development_Technical_Appendix]_[Methodology_Paper] 26 [Access_Data]_[Regional_Pairwise_Data]_[Interactive_Tool]
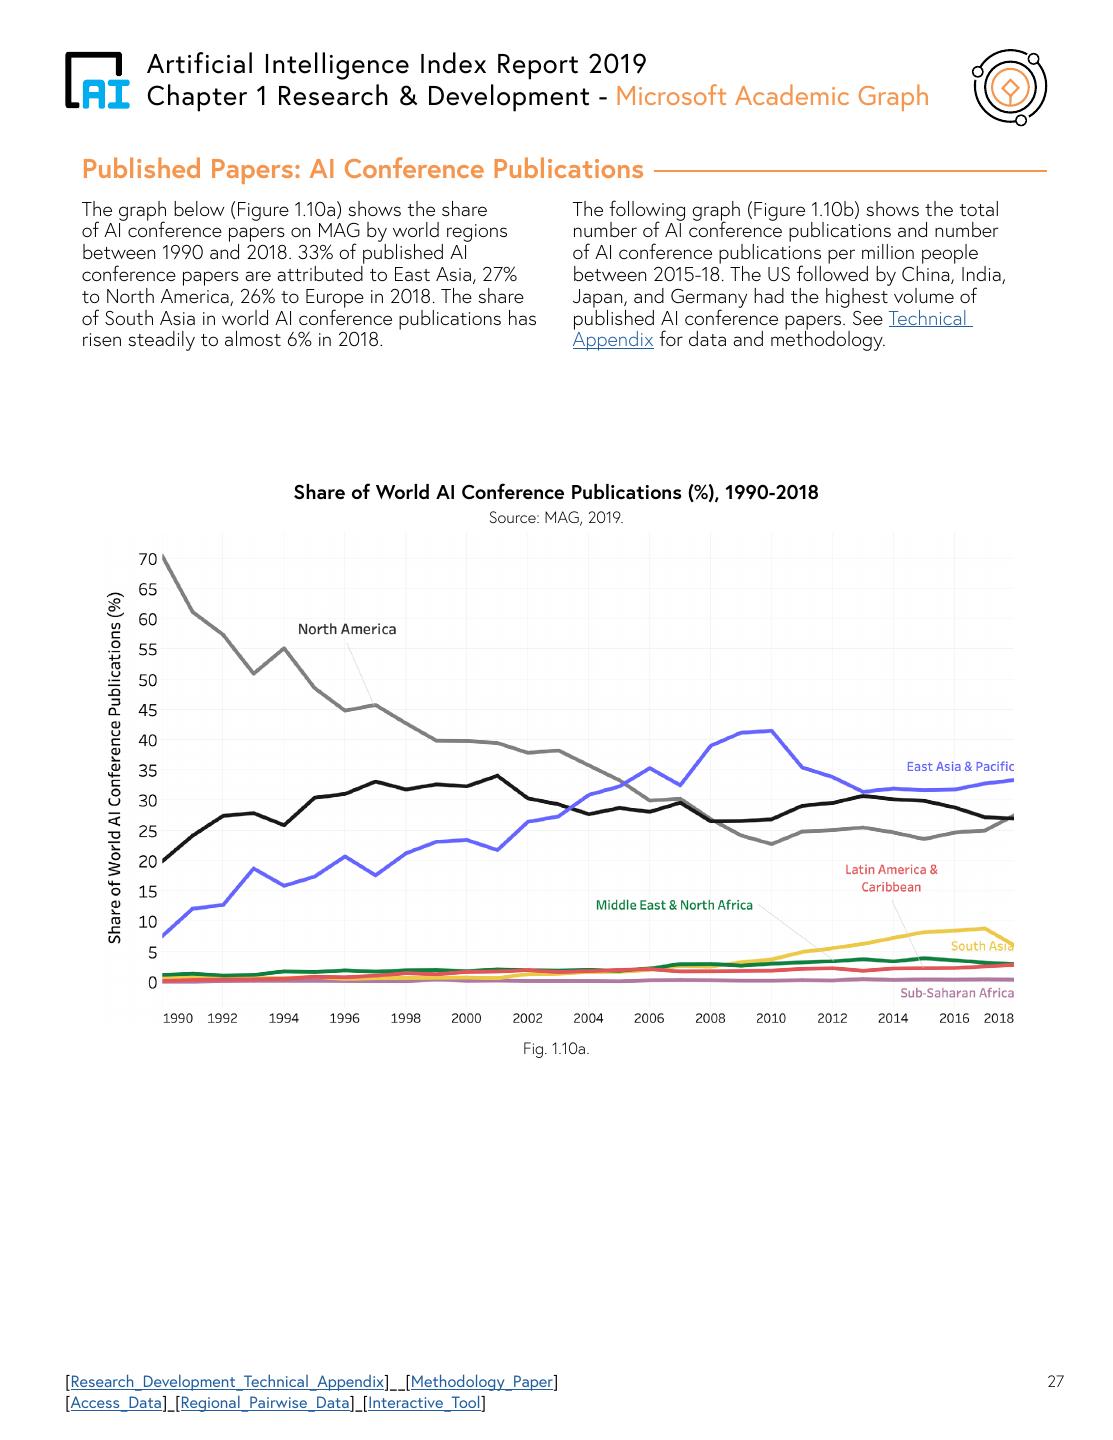
28 . Artificial Intelligence Index Report 2019 Chapter 1 Research & Development - Microsoft Academic Graph Published Papers: AI Conference Publications The graph below (Figure 1.10a) shows the share The following graph (Figure 1.10b) shows the total of AI conference papers on MAG by world regions number of AI conference publications and number between 1990 and 2018. 33% of published AI of AI conference publications per million people conference papers are attributed to East Asia, 27% between 2015-18. The US followed by China, India, to North America, 26% to Europe in 2018. The share Japan, and Germany had the highest volume of of South Asia in world AI conference publications has published AI conference papers. See Technical risen steadily to almost 6% in 2018. Appendix for data and methodology. Share of World AI Conference Publications (%), 1990-2018 Source: MAG, 2019. Fig. 1.10a. [Research_Development_Technical_Appendix]__[Methodology_Paper] 27 [Access_Data]_[Regional_Pairwise_Data]_[Interactive_Tool]
29 . Artificial Intelligence Index Report 2019 Chapter 1 Research & Development - Microsoft Academic Graph Published Papers: AI Conference Publications Total Volume and average annual per capita AI Conference Publications, 2015-2018 Source: MAG, 2019. Fig. 1.10b. [Research_Development_Technical_Appendix]__[Methodology_Paper] 28 [Access_Data]_[Regional_Pairwise_Data]_[Interactive_Tool]


