- 快召唤伙伴们来围观吧
- 微博 QQ QQ空间 贴吧
- 文档嵌入链接
- 复制
- 微信扫一扫分享
- 已成功复制到剪贴板
Mixture Discriminant Analysis
展开查看详情
1 .Mixture Discriminant Analysis Mixture Discriminant Analysis Jia Li Department of Statistics The Pennsylvania State University Email: jiali@stat.psu.edu http://www.stat.psu.edu/∼jiali Jia Li http://www.stat.psu.edu/∼jiali
2 .Mixture Discriminant Analysis Mixture Discriminant Analysis A method for classification (supervised) based on mixture models. Extension of linear discriminant analysis The mixture of normals is used to obtain a density estimation for each class. Jia Li http://www.stat.psu.edu/∼jiali
3 .Mixture Discriminant Analysis Linear Discriminant Analysis Suppose we have K classes. Let the training samples be {x1 , ..., xn } with classes {z1 , ..., zn }, zi ∈ {1, ..., K }. Each class, with prior probability ak , is assumed to follow a Gaussian distribution: φ(x|µk , Σ). Model estimation: n i=1 I (zi = k) ak = n n i=1 xi I (zi = k) µk = n i=1 I (zi = k) n i=1 (xi − µzi )(xi − µzi )t Σ= n Jia Li http://www.stat.psu.edu/∼jiali
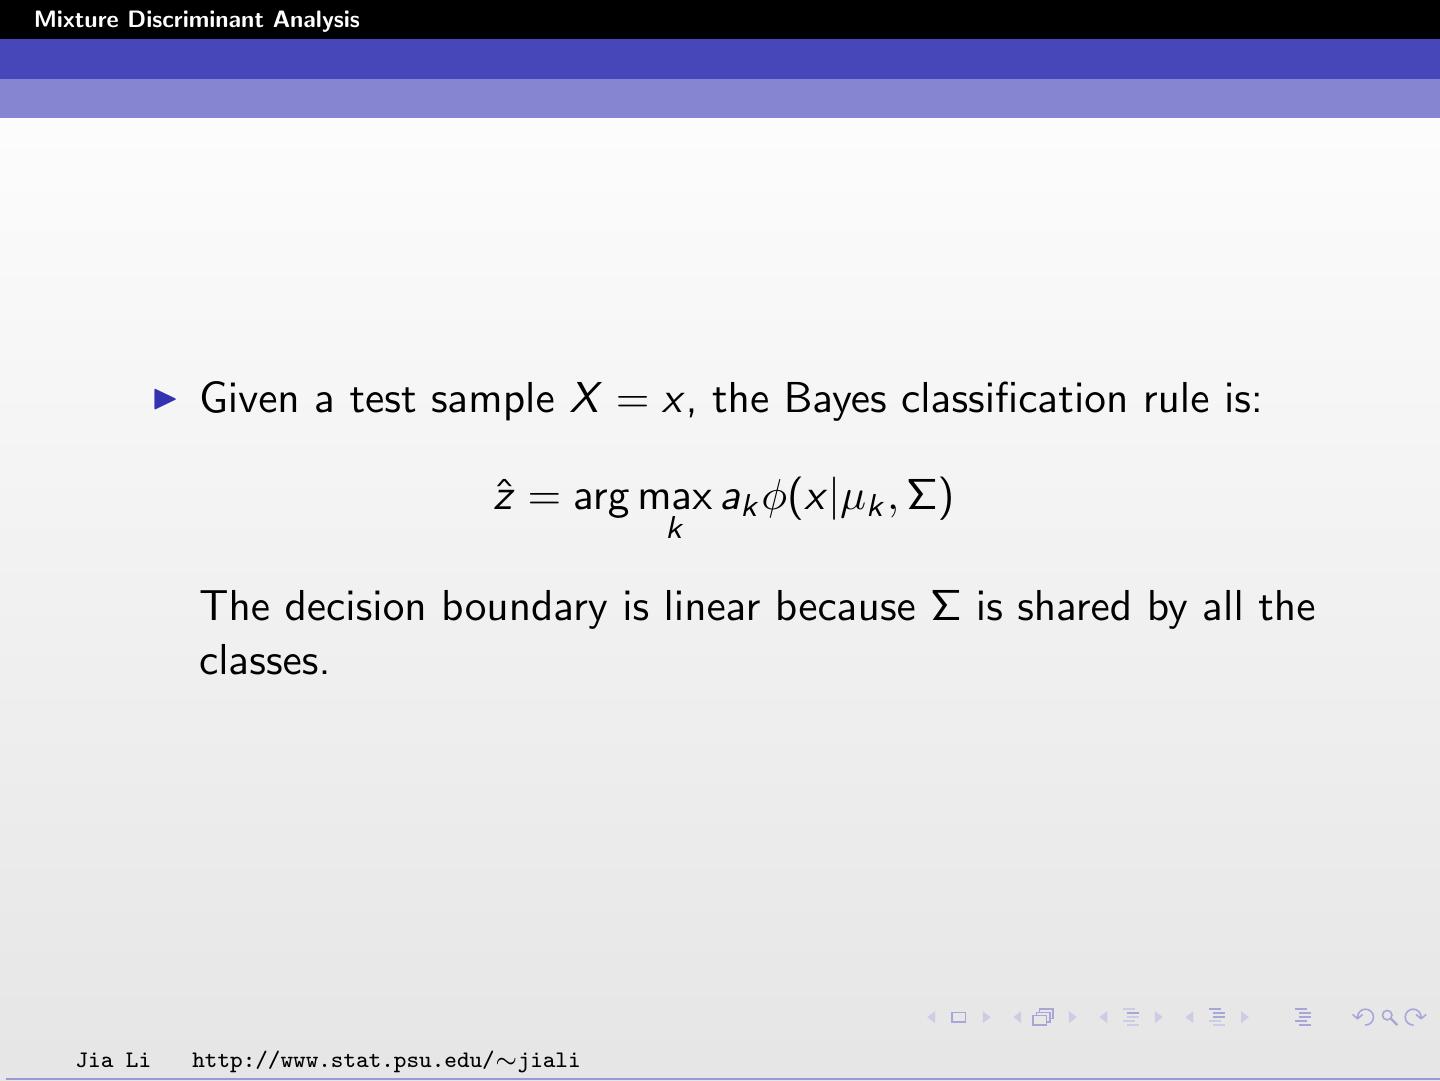
4 .Mixture Discriminant Analysis Given a test sample X = x, the Bayes classification rule is: zˆ = arg max ak φ(x|µk , Σ) k The decision boundary is linear because Σ is shared by all the classes. Jia Li http://www.stat.psu.edu/∼jiali
5 .Mixture Discriminant Analysis Mixture Discriminant Analysis A single Gaussian to model a class, as in LDA, is too restricted. Extend to a mixture of Gaussians. For class k, the within-class density is: Rk fk (x) = πkr φ(x|µkr , Σ) r =1 A common covariance matrix is still assumed. Jia Li http://www.stat.psu.edu/∼jiali
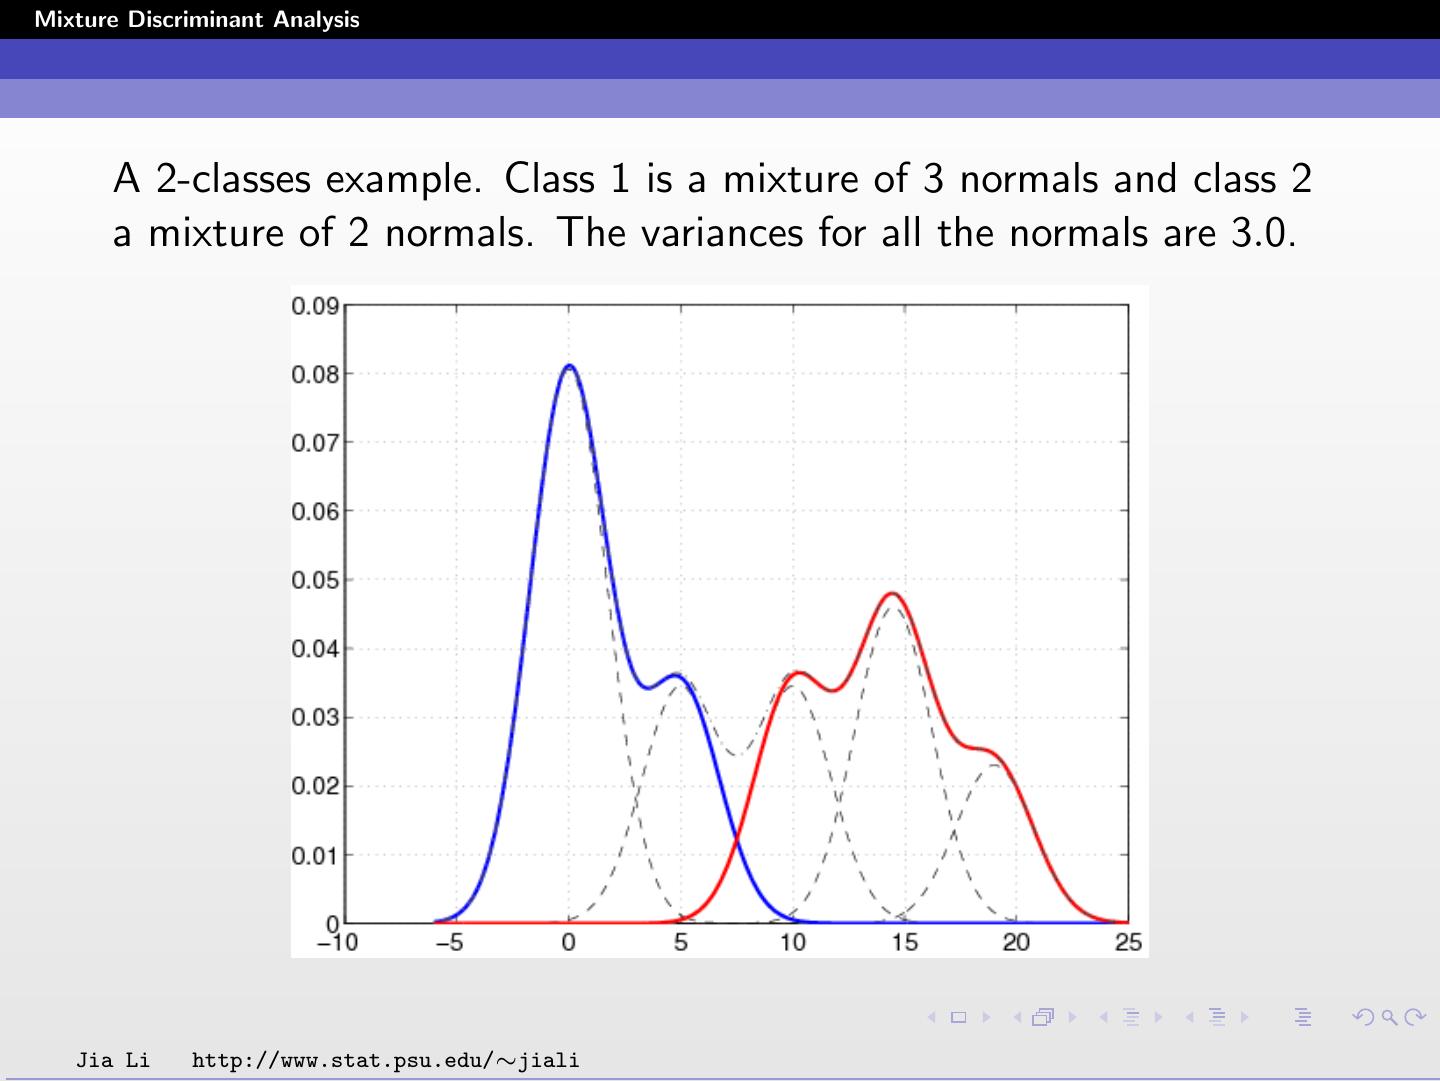
6 .Mixture Discriminant Analysis A 2-classes example. Class 1 is a mixture of 3 normals and class 2 a mixture of 2 normals. The variances for all the normals are 3.0. Jia Li http://www.stat.psu.edu/∼jiali
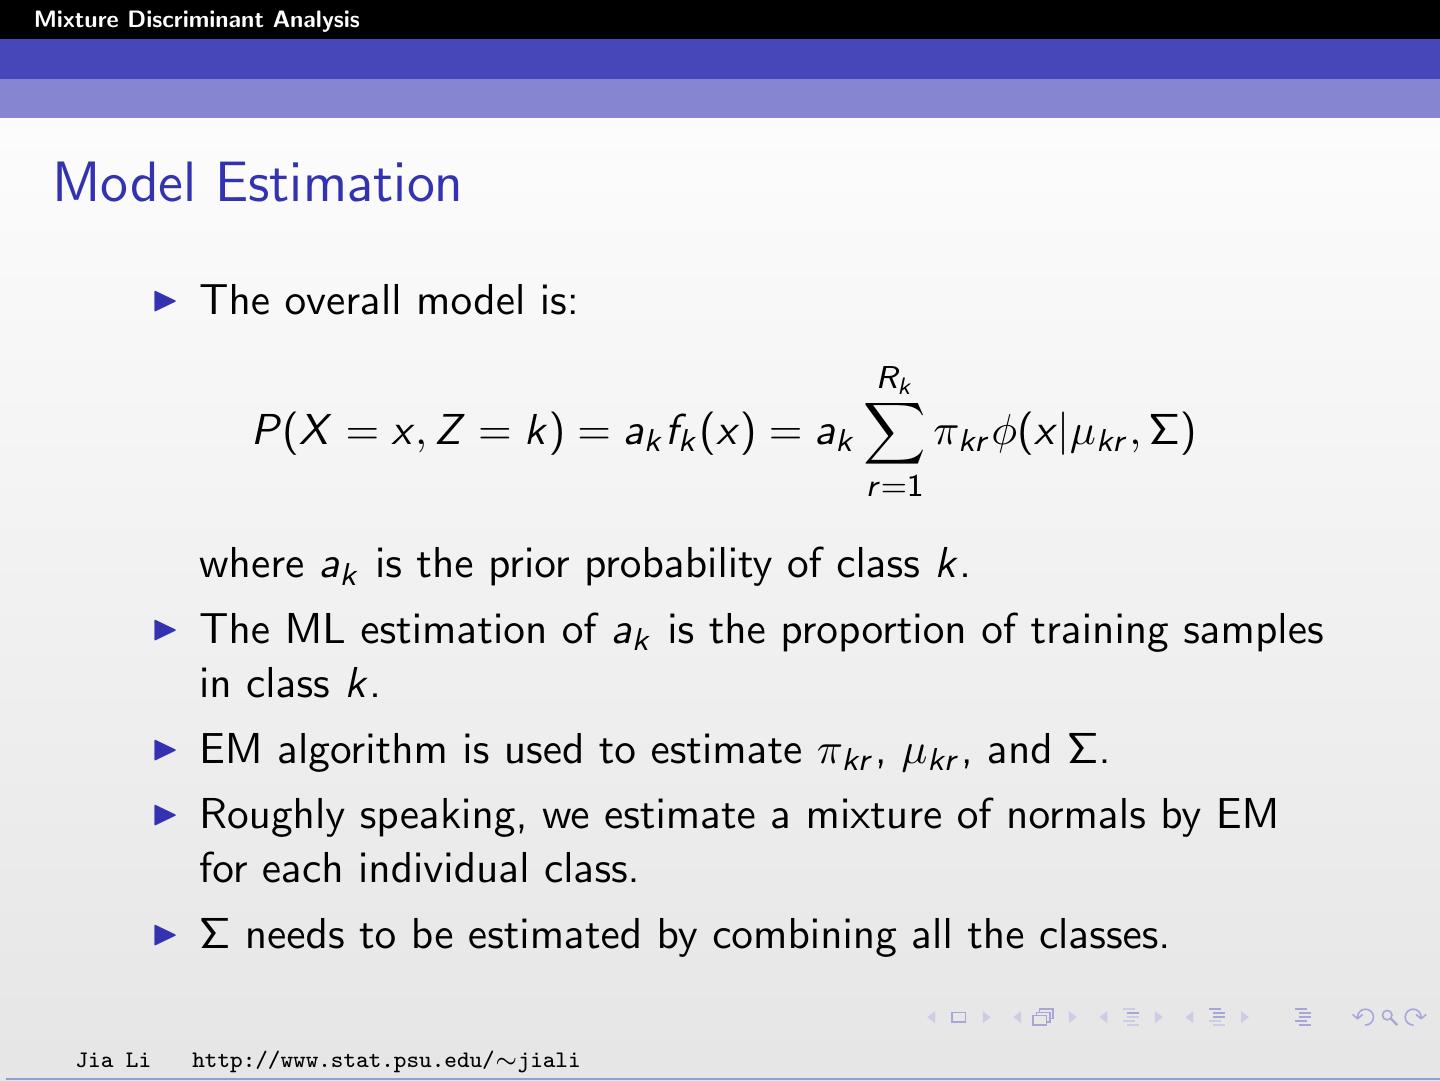
7 .Mixture Discriminant Analysis Model Estimation The overall model is: Rk P(X = x, Z = k) = ak fk (x) = ak πkr φ(x|µkr , Σ) r =1 where ak is the prior probability of class k. The ML estimation of ak is the proportion of training samples in class k. EM algorithm is used to estimate πkr , µkr , and Σ. Roughly speaking, we estimate a mixture of normals by EM for each individual class. Σ needs to be estimated by combining all the classes. Jia Li http://www.stat.psu.edu/∼jiali
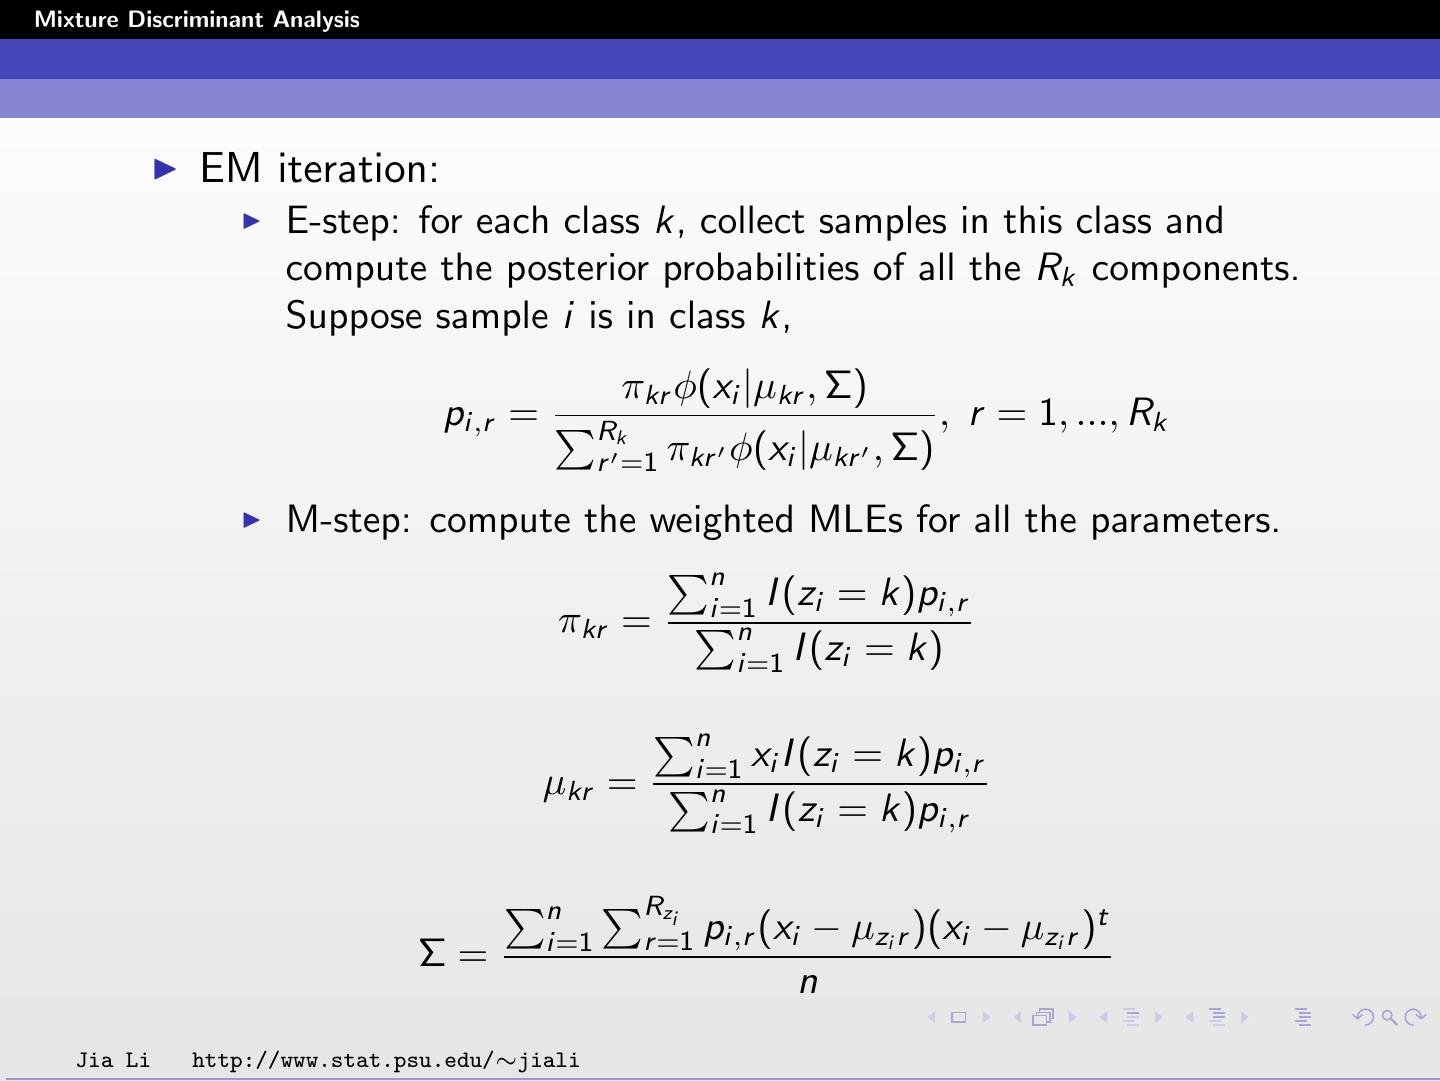
8 .Mixture Discriminant Analysis EM iteration: E-step: for each class k, collect samples in this class and compute the posterior probabilities of all the Rk components. Suppose sample i is in class k, πkr φ(xi |µkr , Σ) pi,r = Rk , r = 1, ..., Rk r =1 πkr φ(xi |µkr , Σ) M-step: compute the weighted MLEs for all the parameters. n i=1 I (zi = k)pi,r πkr = n i=1 I (zi = k) n i=1 xi I (zi = k)pi,r µkr = n i=1 I (zi = k)pi,r n Rzi i=1 r =1 pi,r (xi − µzi r )(xi − µzi r )t Σ= n Jia Li http://www.stat.psu.edu/∼jiali
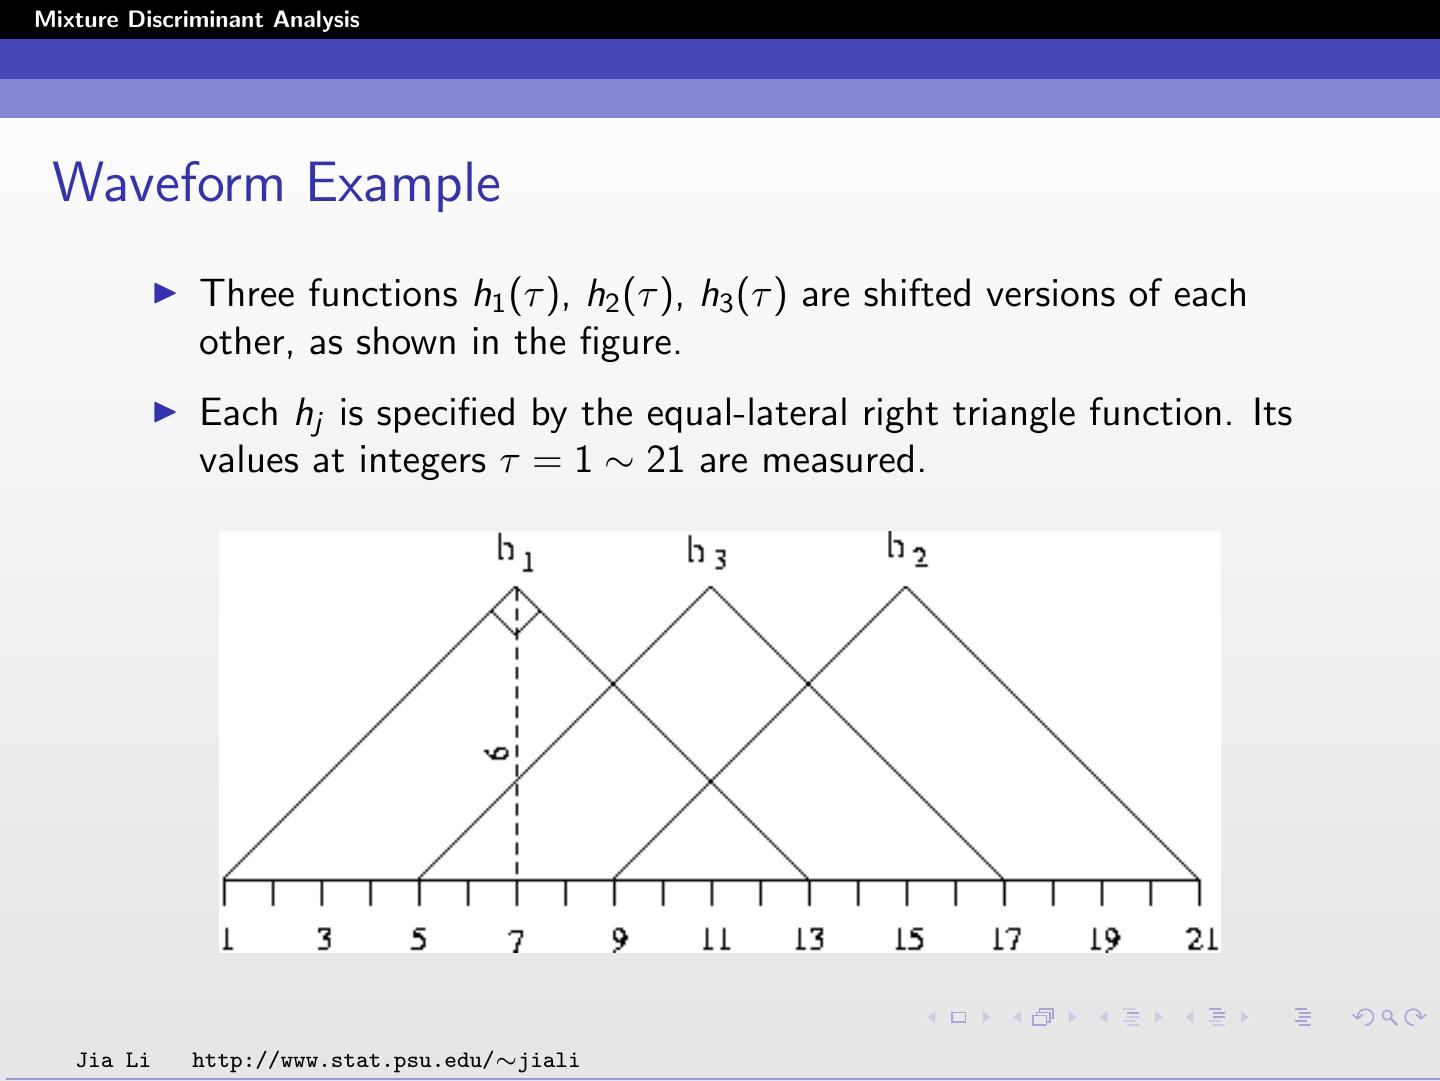
9 .Mixture Discriminant Analysis Waveform Example Three functions h1 (τ ), h2 (τ ), h3 (τ ) are shifted versions of each other, as shown in the figure. Each hj is specified by the equal-lateral right triangle function. Its values at integers τ = 1 ∼ 21 are measured. Jia Li http://www.stat.psu.edu/∼jiali
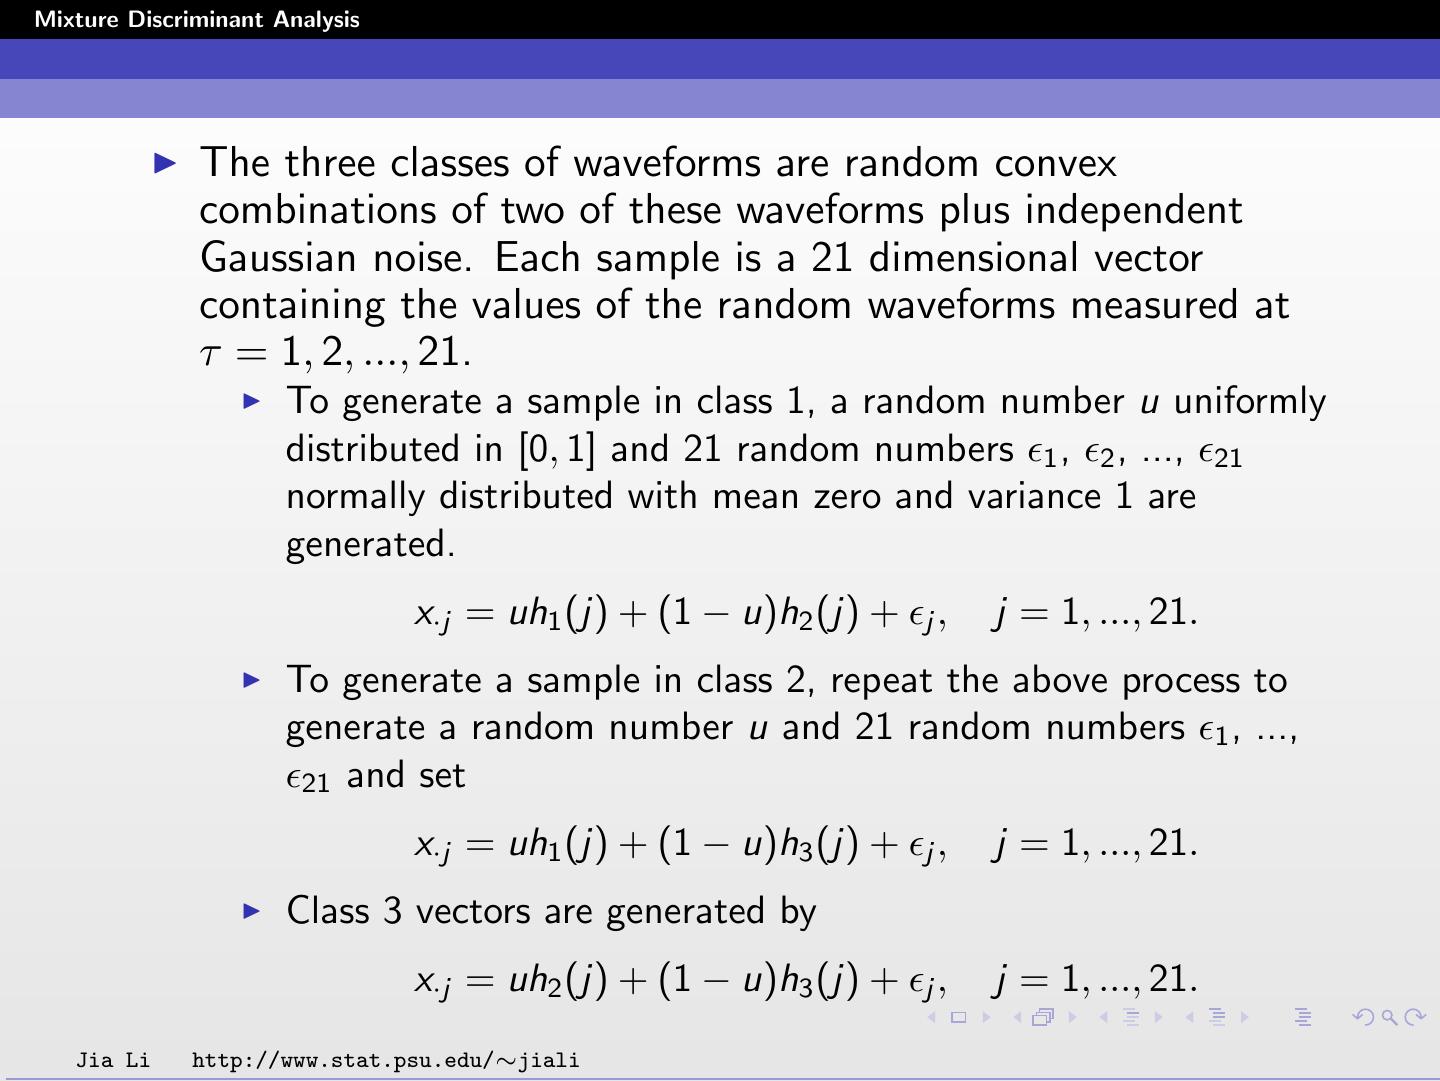
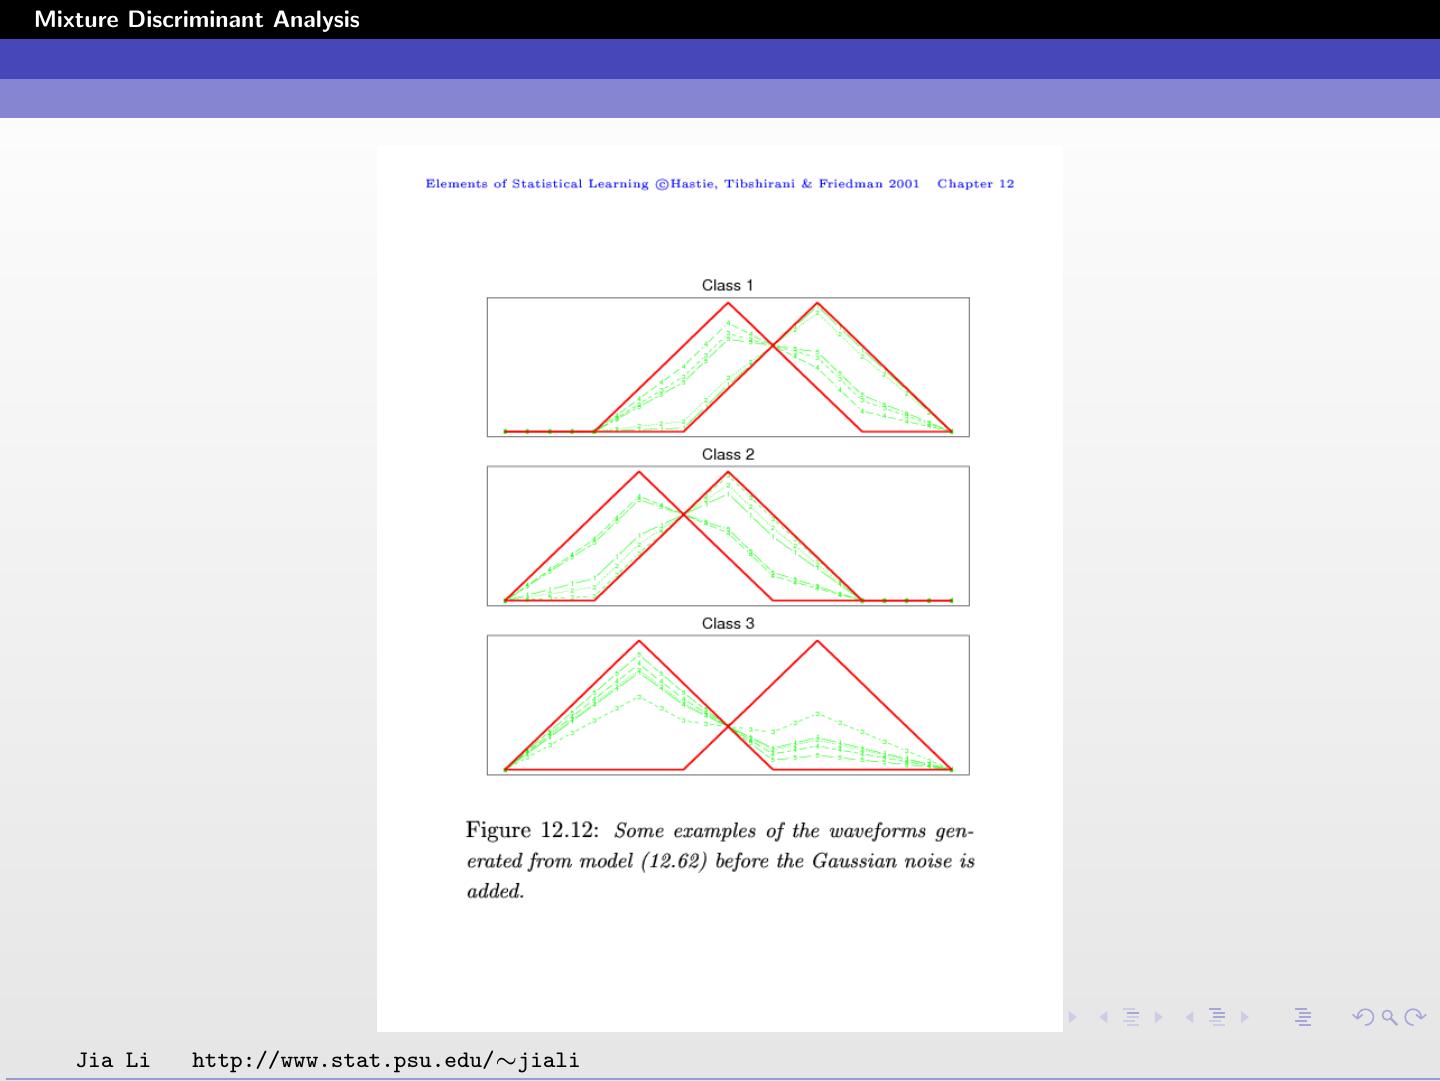
10 .Mixture Discriminant Analysis The three classes of waveforms are random convex combinations of two of these waveforms plus independent Gaussian noise. Each sample is a 21 dimensional vector containing the values of the random waveforms measured at τ = 1, 2, ..., 21. To generate a sample in class 1, a random number u uniformly distributed in [0, 1] and 21 random numbers 1 , 2 , ..., 21 normally distributed with mean zero and variance 1 are generated. x·j = uh1 (j) + (1 − u)h2 (j) + j , j = 1, ..., 21. To generate a sample in class 2, repeat the above process to generate a random number u and 21 random numbers 1 , ..., 21 and set x·j = uh1 (j) + (1 − u)h3 (j) + j , j = 1, ..., 21. Class 3 vectors are generated by x·j = uh2 (j) + (1 − u)h3 (j) + j , j = 1, ..., 21. Jia Li http://www.stat.psu.edu/∼jiali
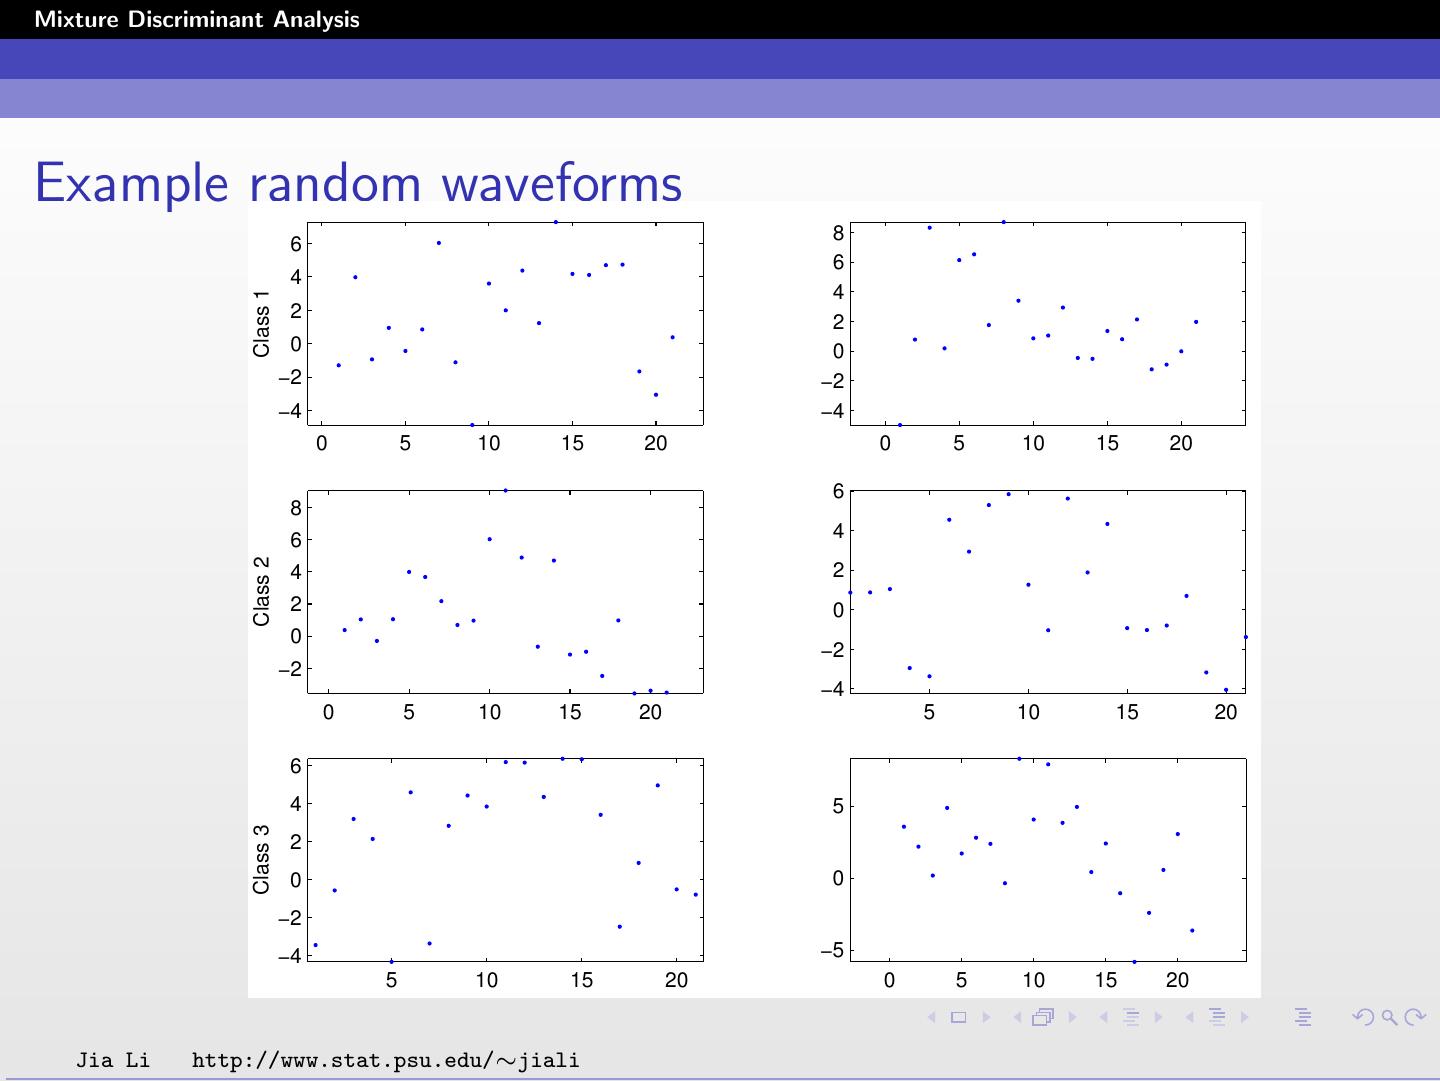
11 .Mixture Discriminant Analysis Example random waveforms 8 6 6 4 4 Class 1 2 2 0 0 −2 −2 −4 −4 0 5 10 15 20 0 5 10 15 20 6 8 6 4 Class 2 4 2 2 0 0 −2 −2 −4 0 5 10 15 20 5 10 15 20 6 4 5 Class 3 2 0 0 −2 −4 −5 5 10 15 20 0 5 10 15 20 Jia Li http://www.stat.psu.edu/∼jiali
12 .Mixture Discriminant Analysis Jia Li http://www.stat.psu.edu/∼jiali
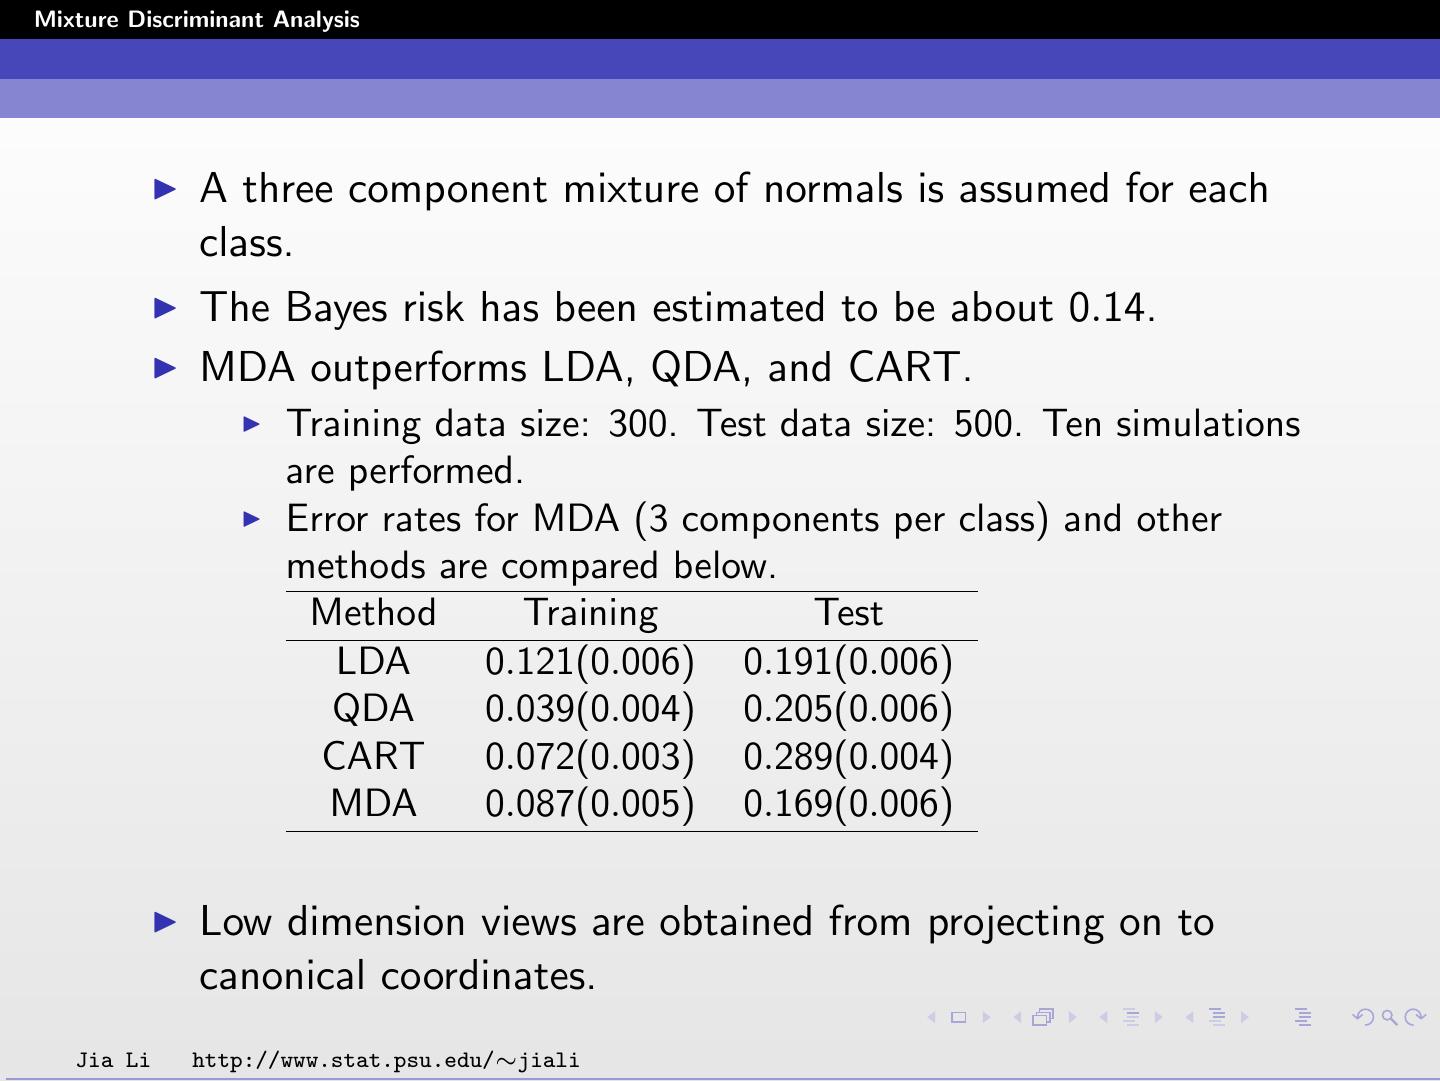
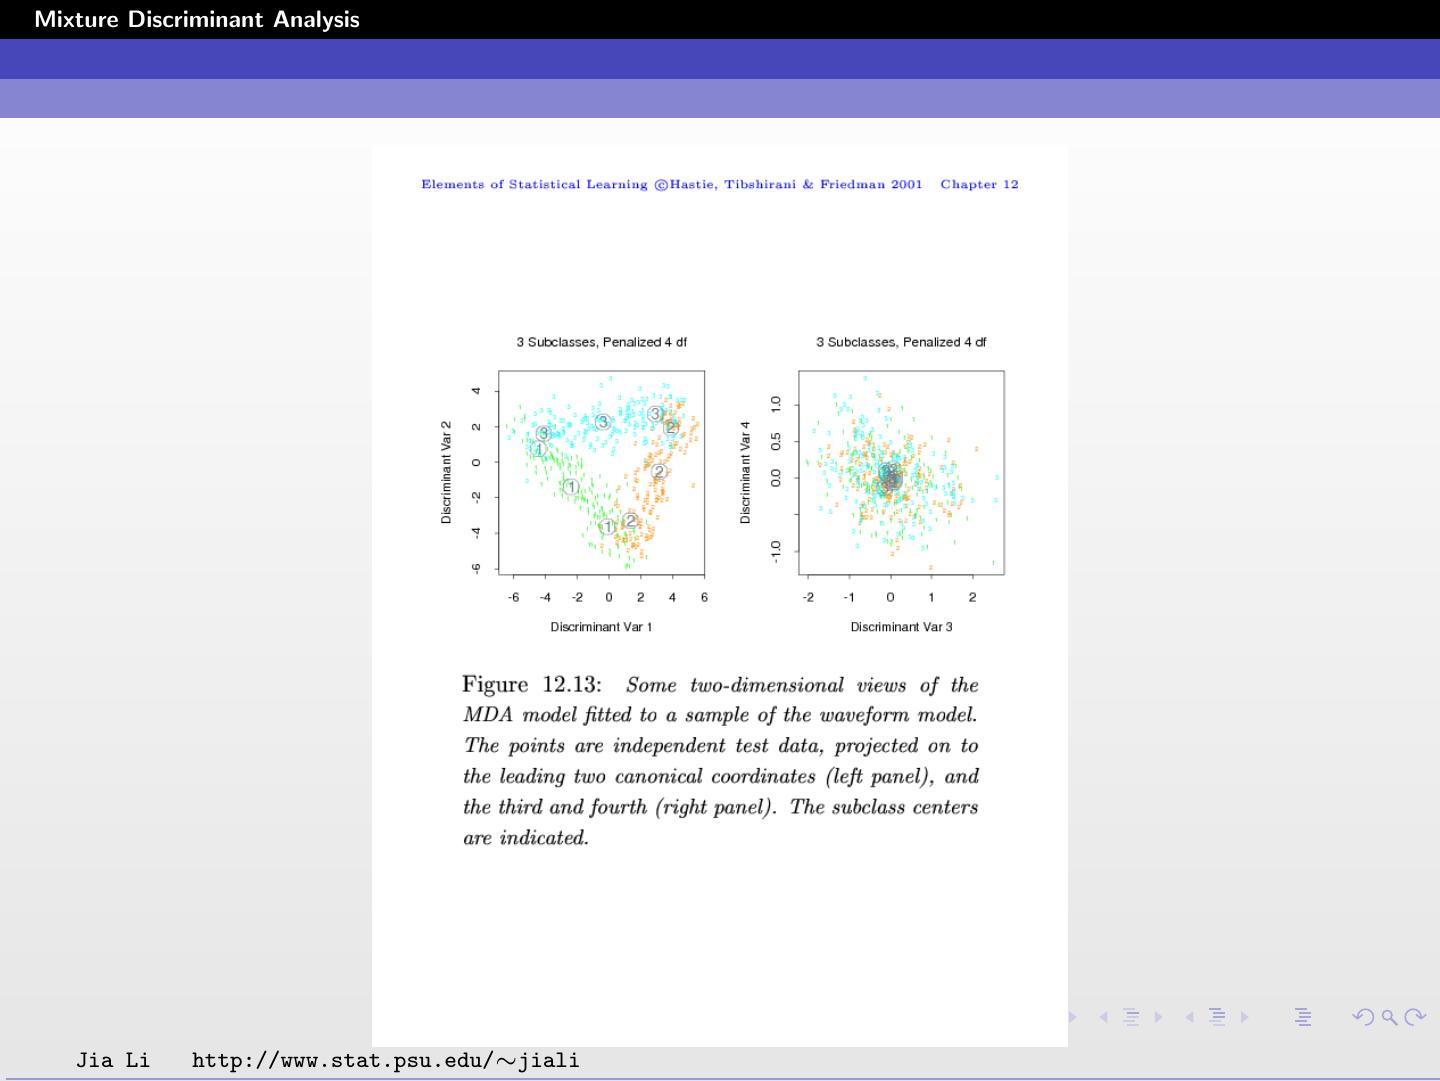
13 .Mixture Discriminant Analysis A three component mixture of normals is assumed for each class. The Bayes risk has been estimated to be about 0.14. MDA outperforms LDA, QDA, and CART. Training data size: 300. Test data size: 500. Ten simulations are performed. Error rates for MDA (3 components per class) and other methods are compared below. Method Training Test LDA 0.121(0.006) 0.191(0.006) QDA 0.039(0.004) 0.205(0.006) CART 0.072(0.003) 0.289(0.004) MDA 0.087(0.005) 0.169(0.006) Low dimension views are obtained from projecting on to canonical coordinates. Jia Li http://www.stat.psu.edu/∼jiali
14 .Mixture Discriminant Analysis Jia Li http://www.stat.psu.edu/∼jiali


