- 快召唤伙伴们来围观吧
- 微博 QQ QQ空间 贴吧
- 文档嵌入链接
- 复制
- 微信扫一扫分享
- 已成功复制到剪贴板
13_Bayesian Model Selection and Averaging - May 2017.pptx - UCL
展开查看详情
1 .Bayesian Model Selection and Averaging SPM for MEG/EEG course Peter Zeidman
2 .Contents DCM recap Comparing models Bayes rule for models, Bayes Factors, Bayesian Model Reduction Investigating the parameters Bayesian Model Averaging Comparing DCMs across subjects Fixed effects, model of models ( random effects) Parametric Empirical Bayes Models of parameters
3 .The system of interest (Hidden) Neural Circuitry ? Experimental Stimulus off on time Vector u Stimulus from Buchel and Friston, 1997 Brain by Dierk Schaefer, Flickr, CC 2.0 Observations (EEG/MEG) time Measurement y
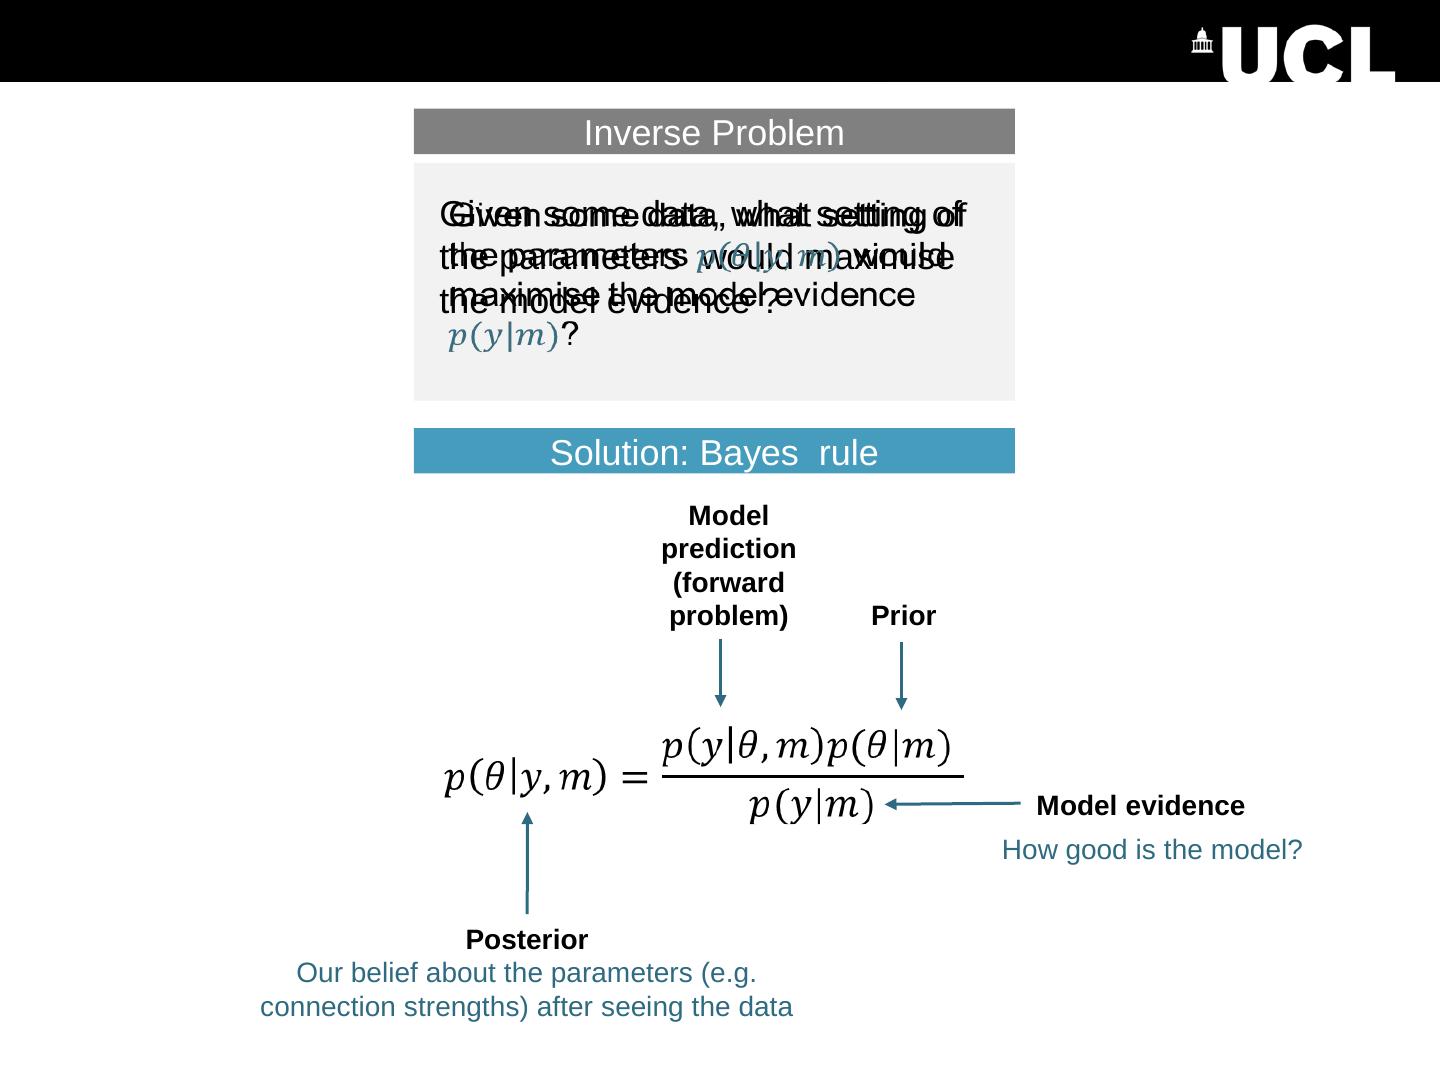
4 .Image credit: Marcin Wichary , Flickr Predicted data (e.g. timeseries) time Timing of stimuli etc . Parameter e.g. the strength of a connection Inverse Problem Given some data, what setting of the parameters maximises the model evidence ? Generative model (DCM) What data would we expect to measure given this model and a particular setting of the parameters? Forward problem
5 .DCM Recap R1 R2 Stimulus Priors determine the structure of the model R1 R2 Stimulus Connection ‘on’ Prior Connection strength (Hz) Probability 0 Connection ‘off’ 0 Prior Connection strength (Hz)
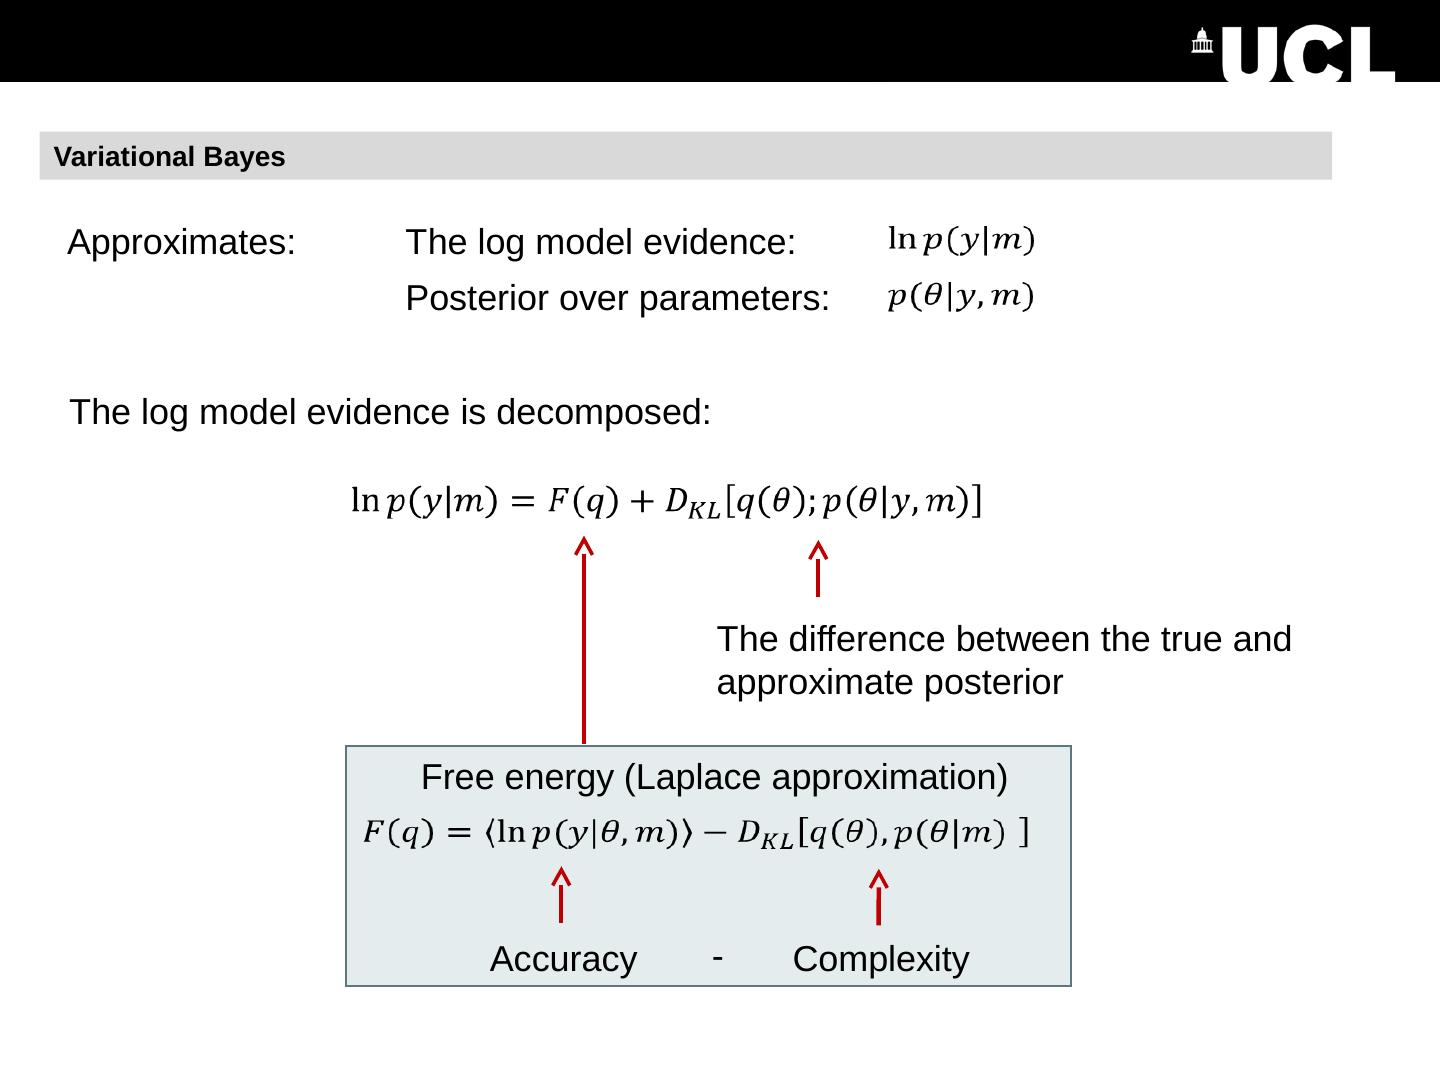
6 .DCM Recap We have: Measured data A model with prior beliefs about the parameters Model estimation (inversion) gives us: A score for the model, which we can use to compare it against other models 2. Estimated parameters – i.e. the posteriors Free energy : DCM.Ep – expected value of each parameter : DCM.Cp – covariance matrix
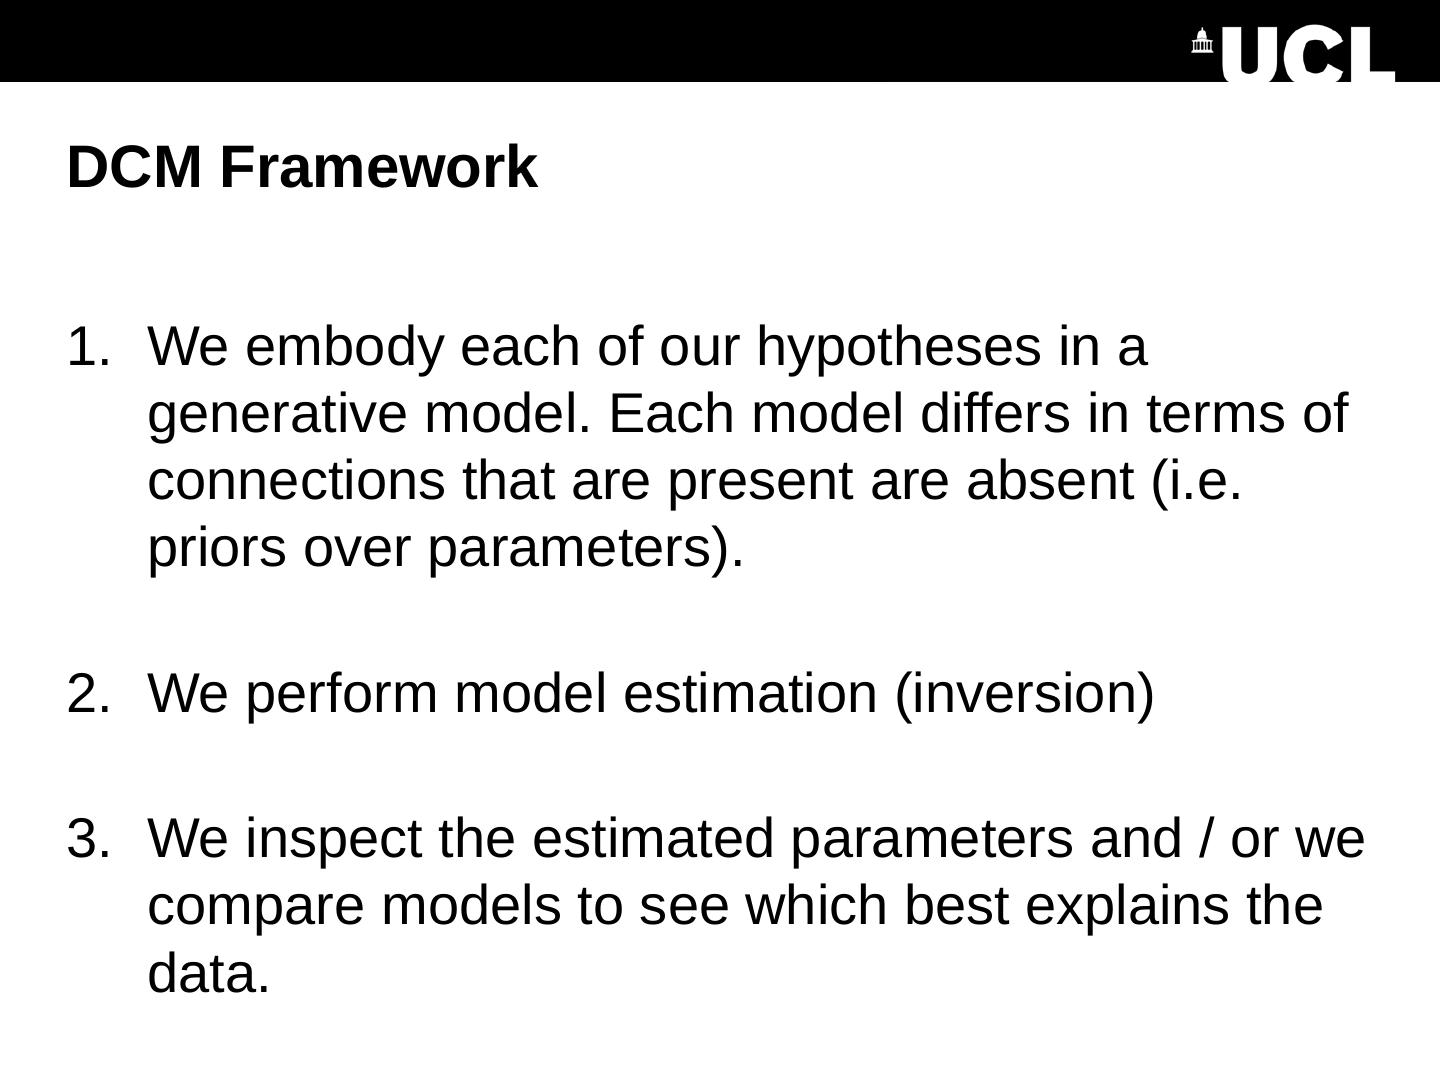
7 .DCM Framework We embody each of our hypotheses in a generative model. Each model differs in terms of connections that are present are absent (i.e. priors over parameters). We perform model estimation (inversion) We inspect the estimated parameters and / or we compare models to see which best explains the data.
8 .Contents DCM recap Comparing models (within subject) Bayes rule for models, Bayes Factors, odds ratios Investigating the parameters Bayesian Model Averaging Comparing models across subjects Fixed effects, random effects Parametric Empirical Bayes Based on slides by Will Penny
9 . Bayes Rule for Models Question: I’ve estimated 10 DCMs for a subject. What’s the posterior probability that any given model is the best? Prior on each model Probability of each model given the data Model evidence
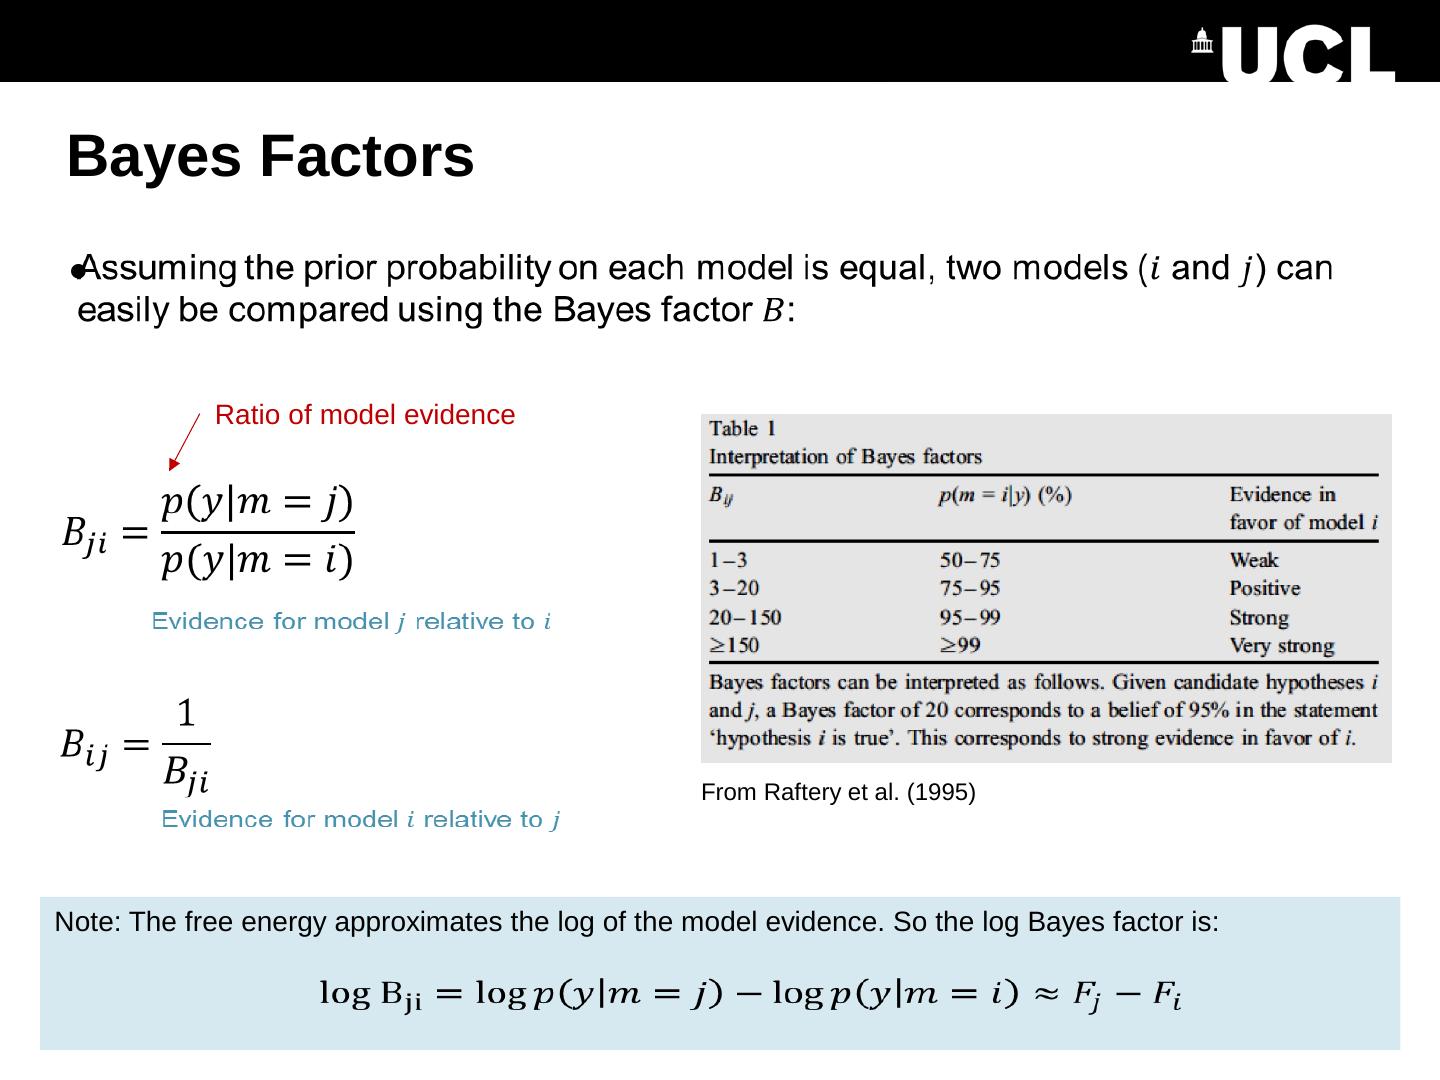
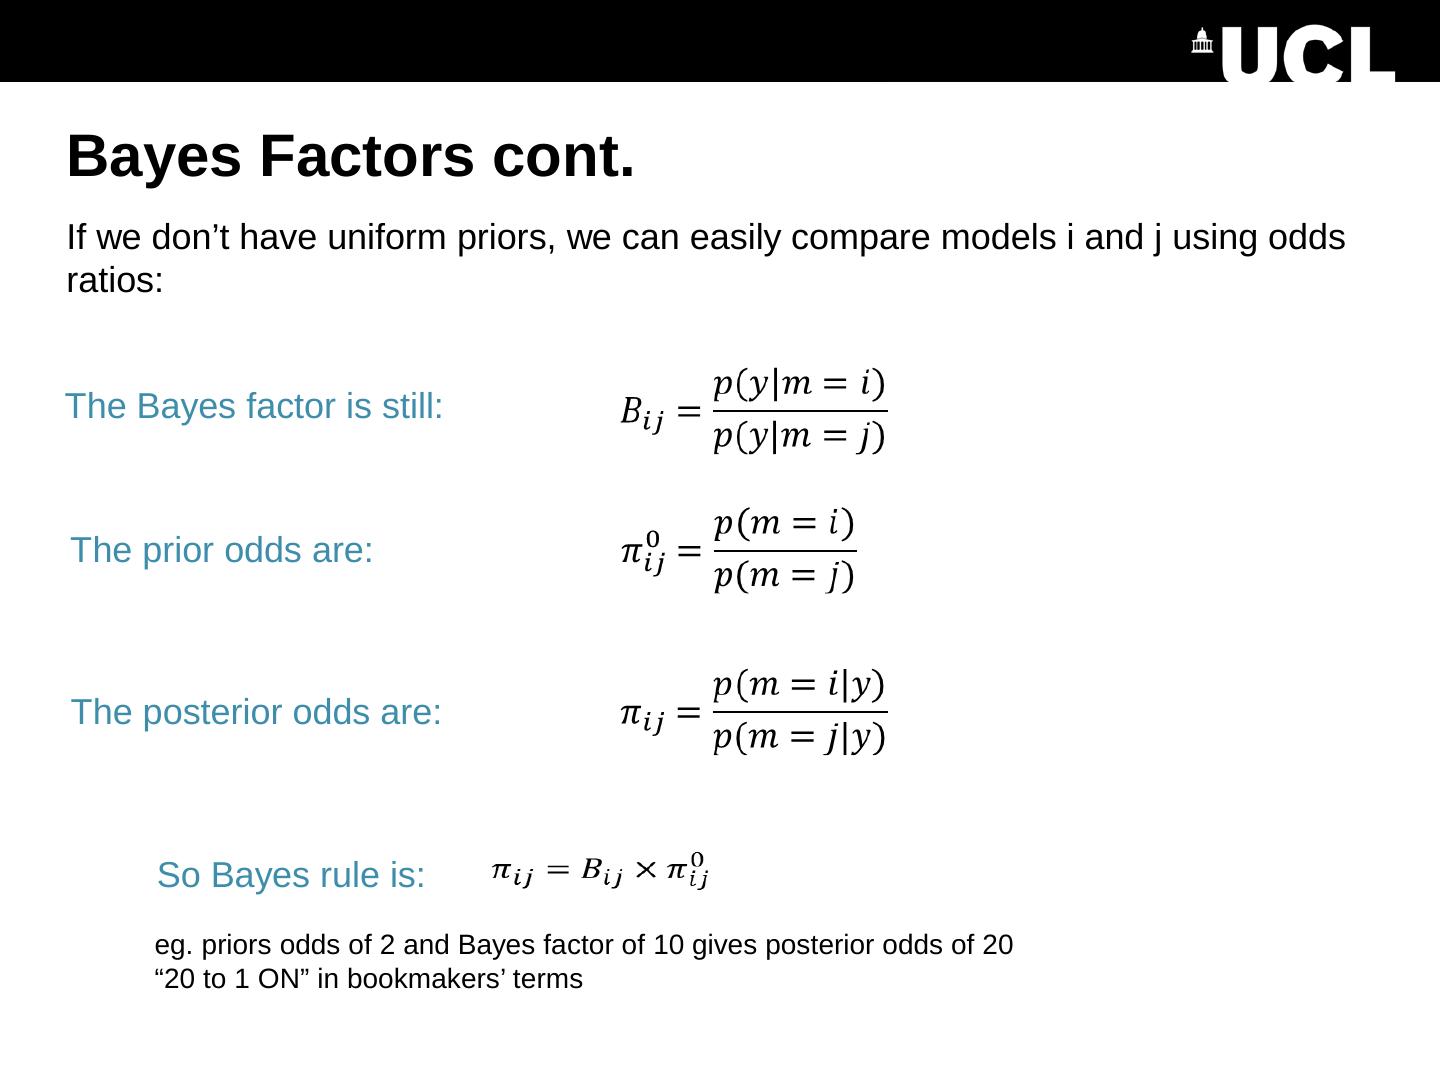
10 .Bayes Factors Ratio of model evidence Note: The free energy approximates the log of the model evidence. So the log Bayes factor is: From Raftery et al. (1995)
11 .Bayes Factors cont. Posterior probability of a model is the sigmoid function of the log Bayes factor
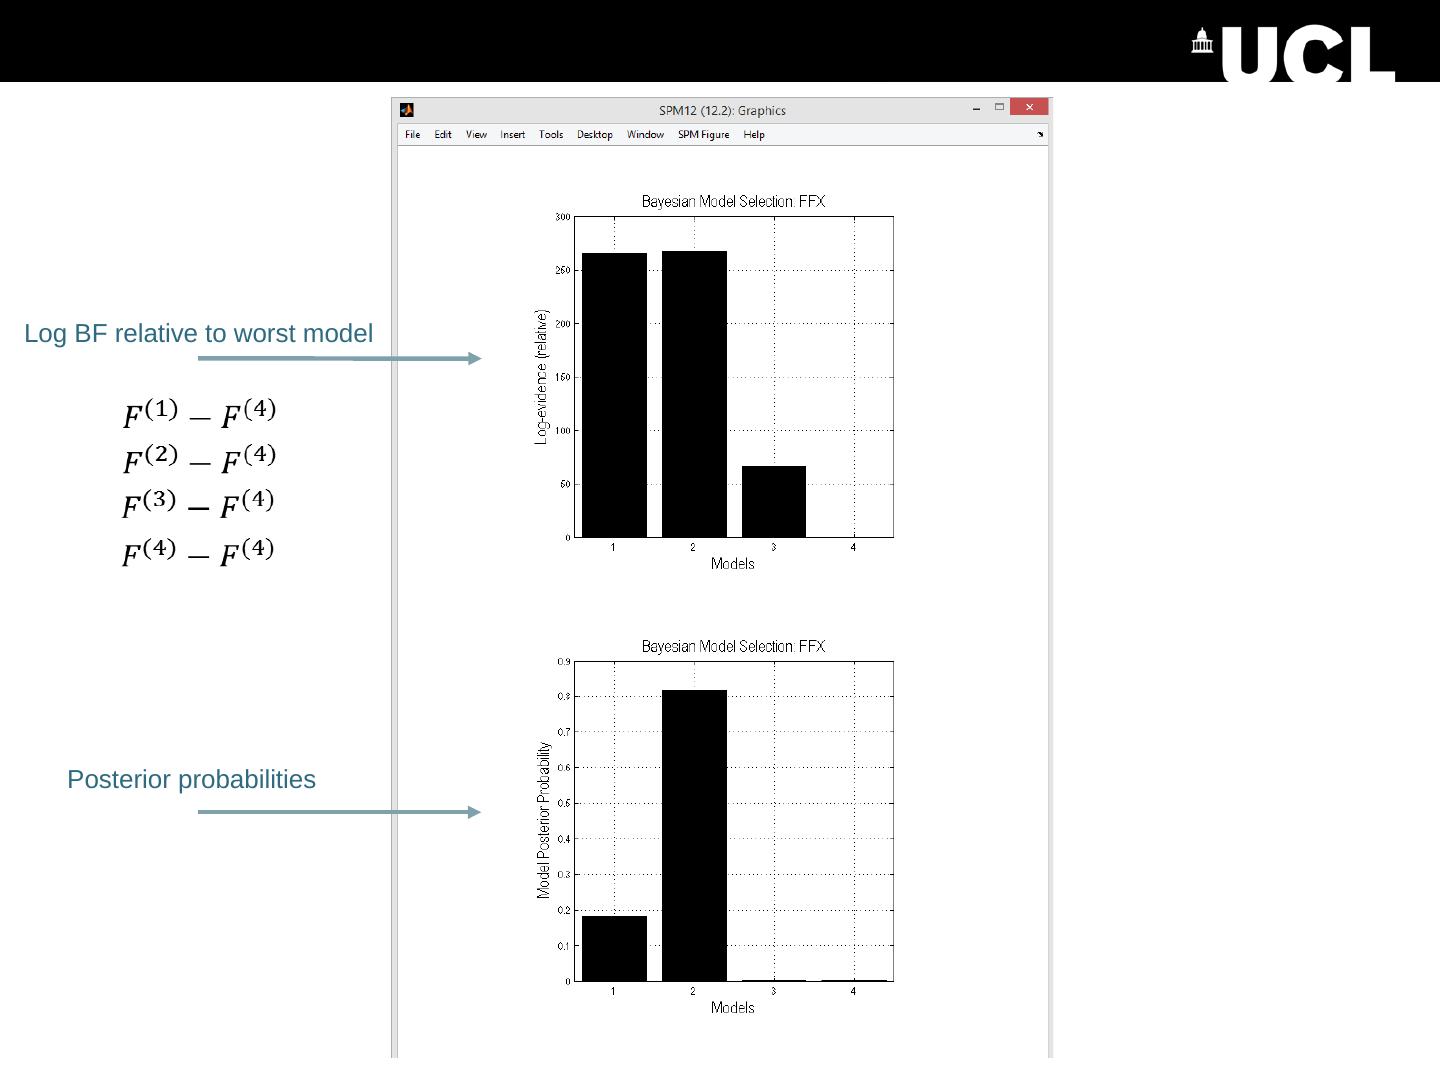
12 .Log BF relative to worst model Posterior probabilities
13 .Bayesian Model Reduction Model inversion (VB) Bayesian Model Reduction (BMR) Full model Priors: X Priors: Nested / reduced model
14 .Each competing model does not need to be separately estimated Can reduce local optima and enables searching over large model spaces Bayesian model reduction (BMR) R1 R2 Stimulus “Full” model R1 R2 Stimulus “Reduced” model BMR Friston et al., Neuroimage , 2016
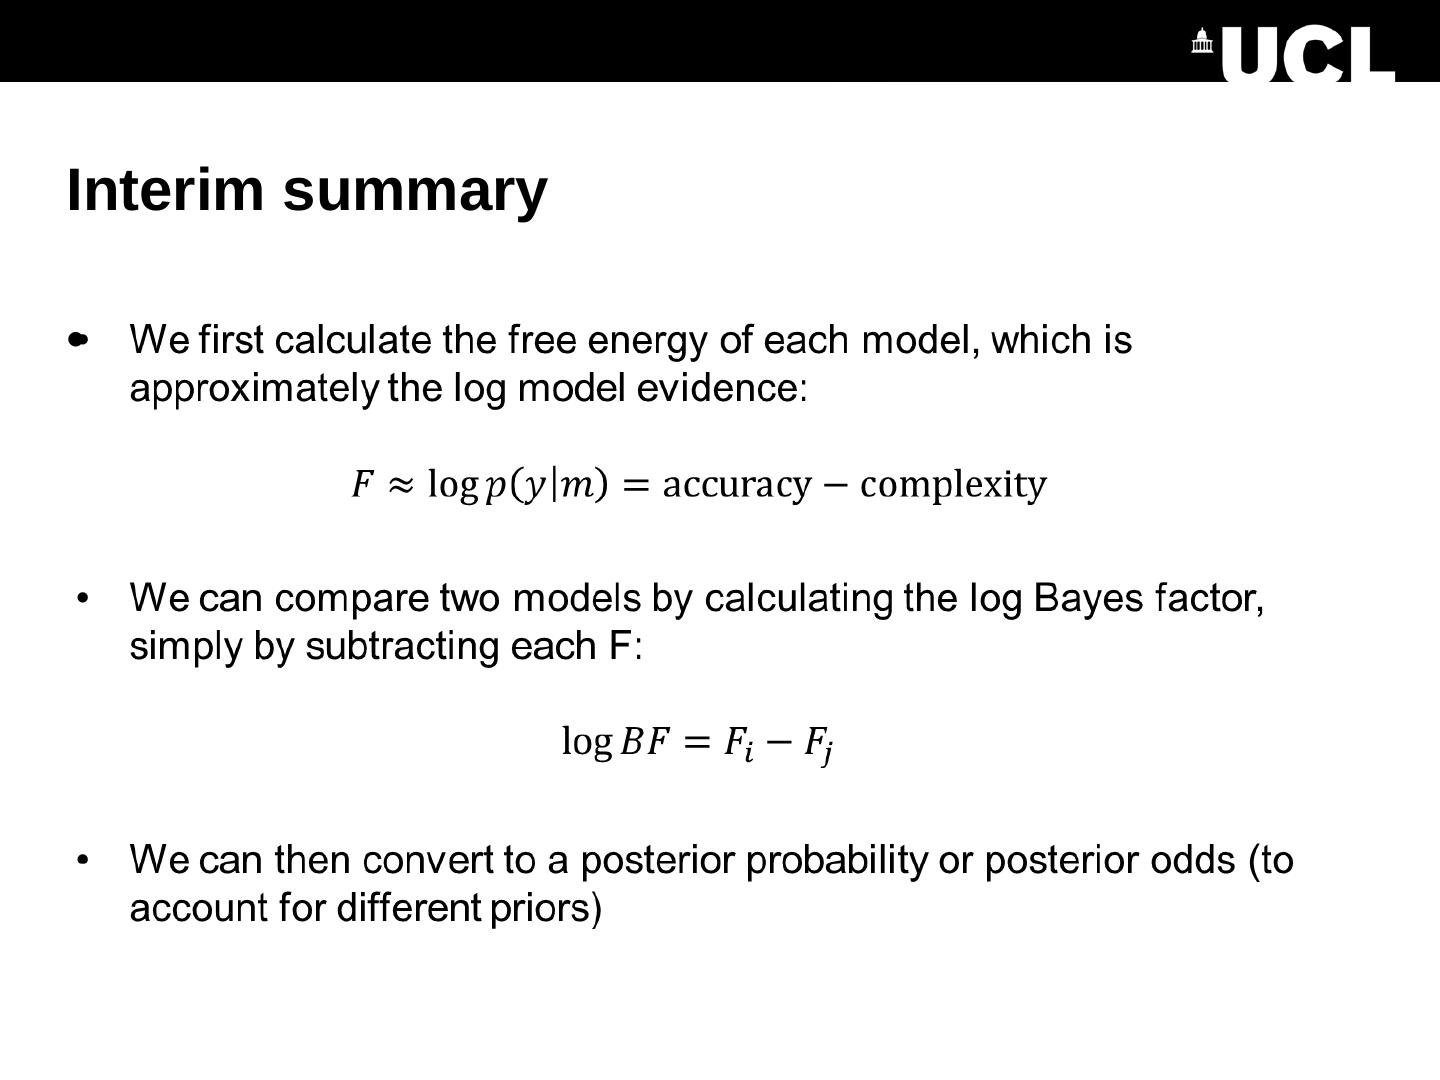
15 .Interim summary
16 .Interim summary
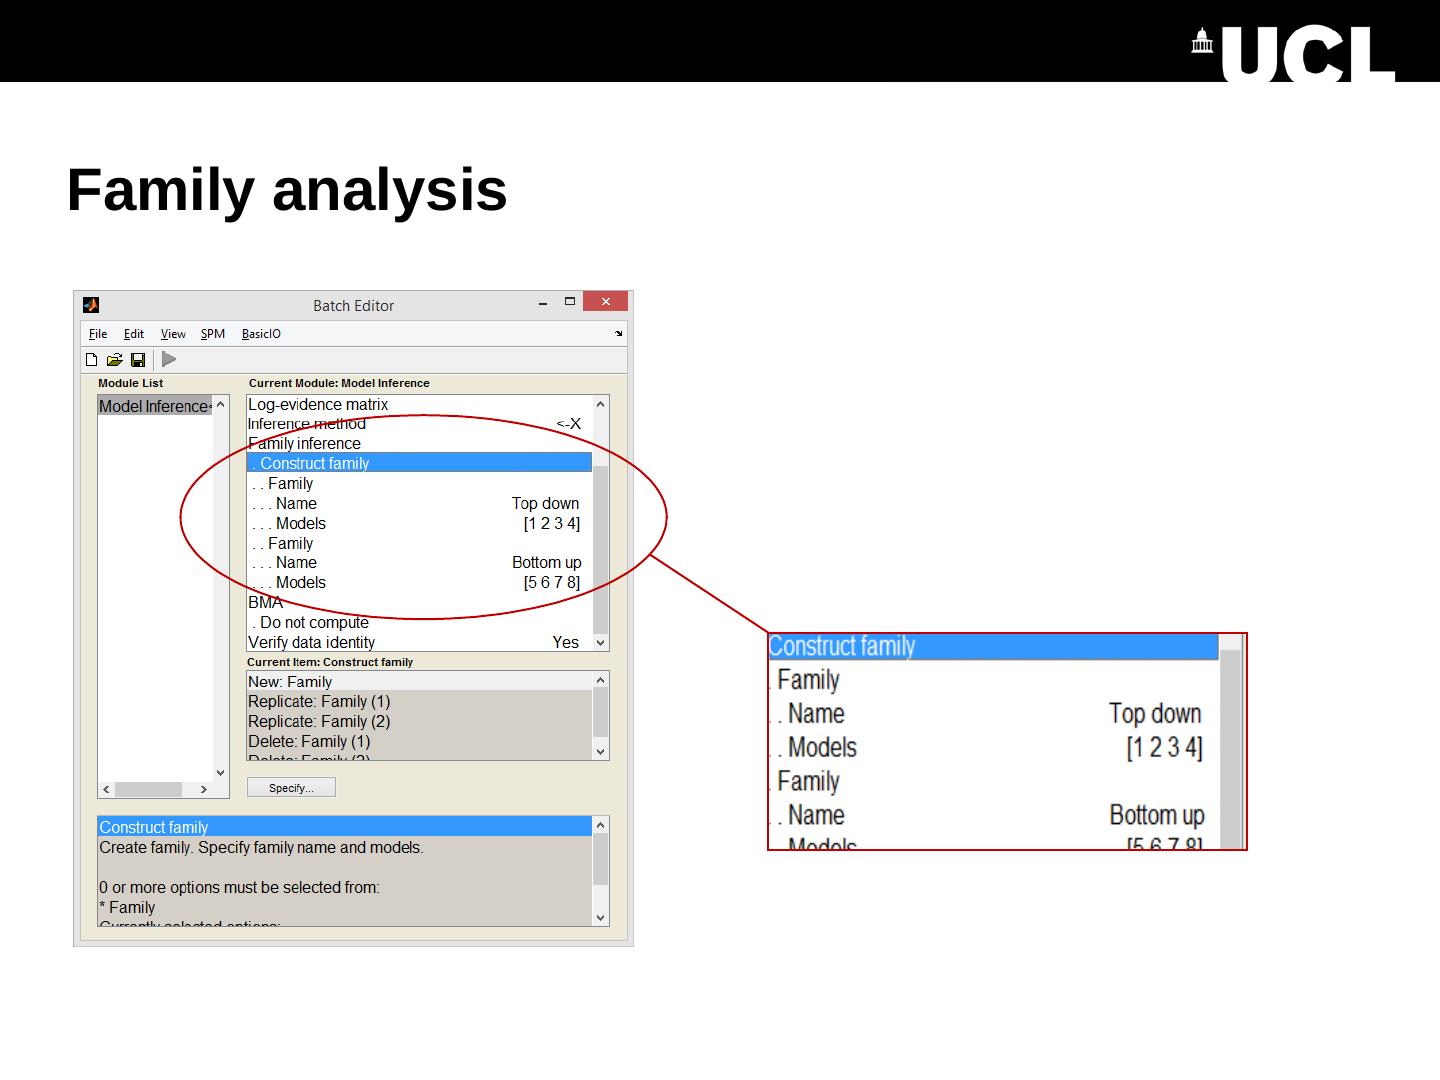
17 .Bayesian Model Averaging (BMA) Having compared models, we can look at the parameters (connection strengths). We average over models, weighted by the posterior probability of each model. This can be limited to models within the winning family. SPM does this using sampling
18 .Bayesian Model Averaging (BMA) Having compared models, we can look at the parameters (connection strengths). We average over models, weighted by the posterior probability of each model. This can be limited to models within the winning family. SPM does this using sampling
19 .Fixed effects (FFX) FFX summary of the log evidence: Group Bayes Factor (GBF): Stephan et al., Neuroimage , 2009
20 .Fixed effects (FFX) 11 out of 12 subjects favour model 1 GBF = 15 (in favour of model 2). So the FFX inference disagrees with most subjects. Stephan et al., Neuroimage , 2009
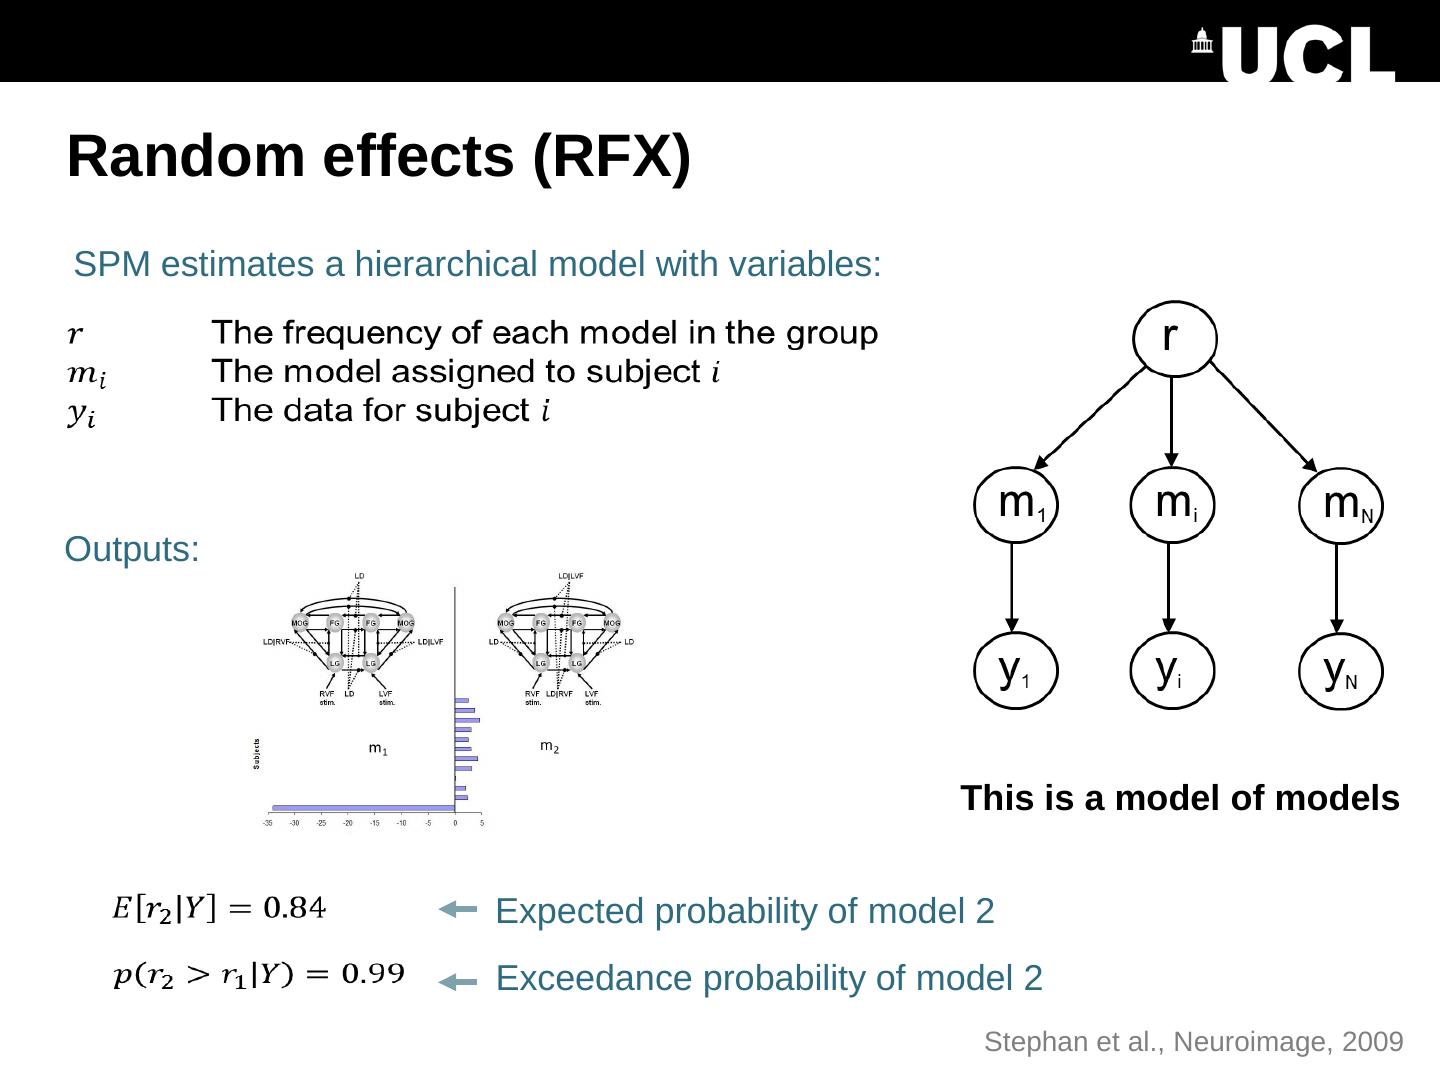
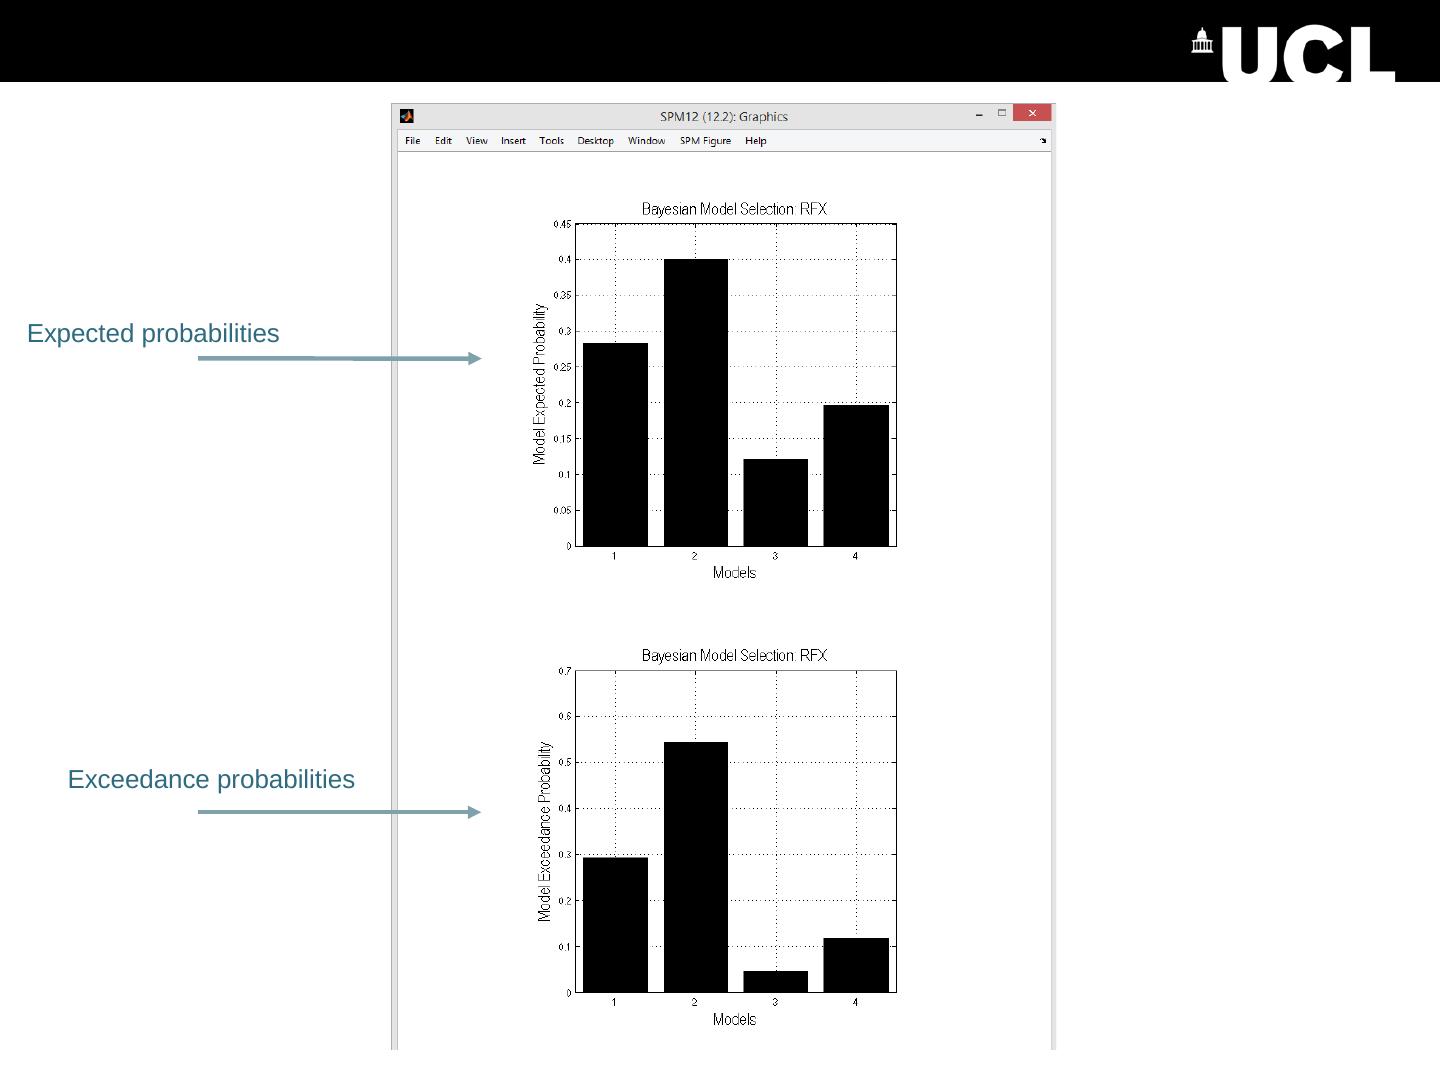
21 .Random effects (RFX) SPM estimates a hierarchical model with variables: Expected probability of model 2 Outputs: Exceedance probability of model 2 This is a model of models Stephan et al., Neuroimage , 2009
22 .Expected probabilities Exceedance probabilities
23 .Expected probabilities Exceedance probabilities
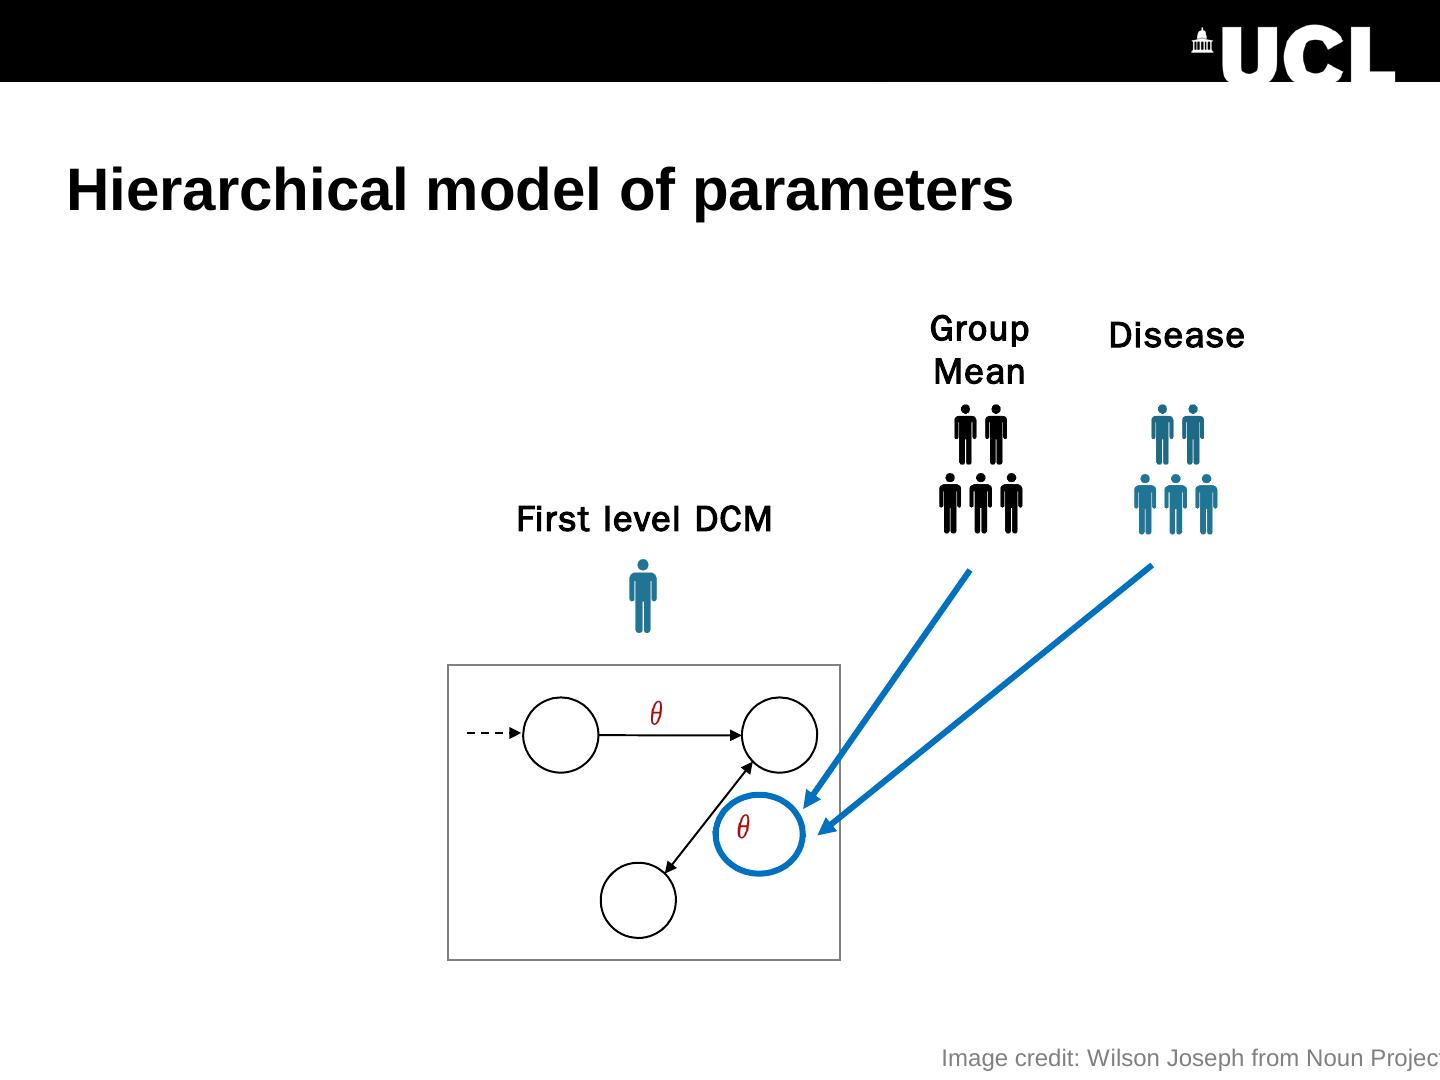
24 .Hierarchical model of parameters First level DCM Image credit: Wilson Joseph from Noun Project Group Mean Disease
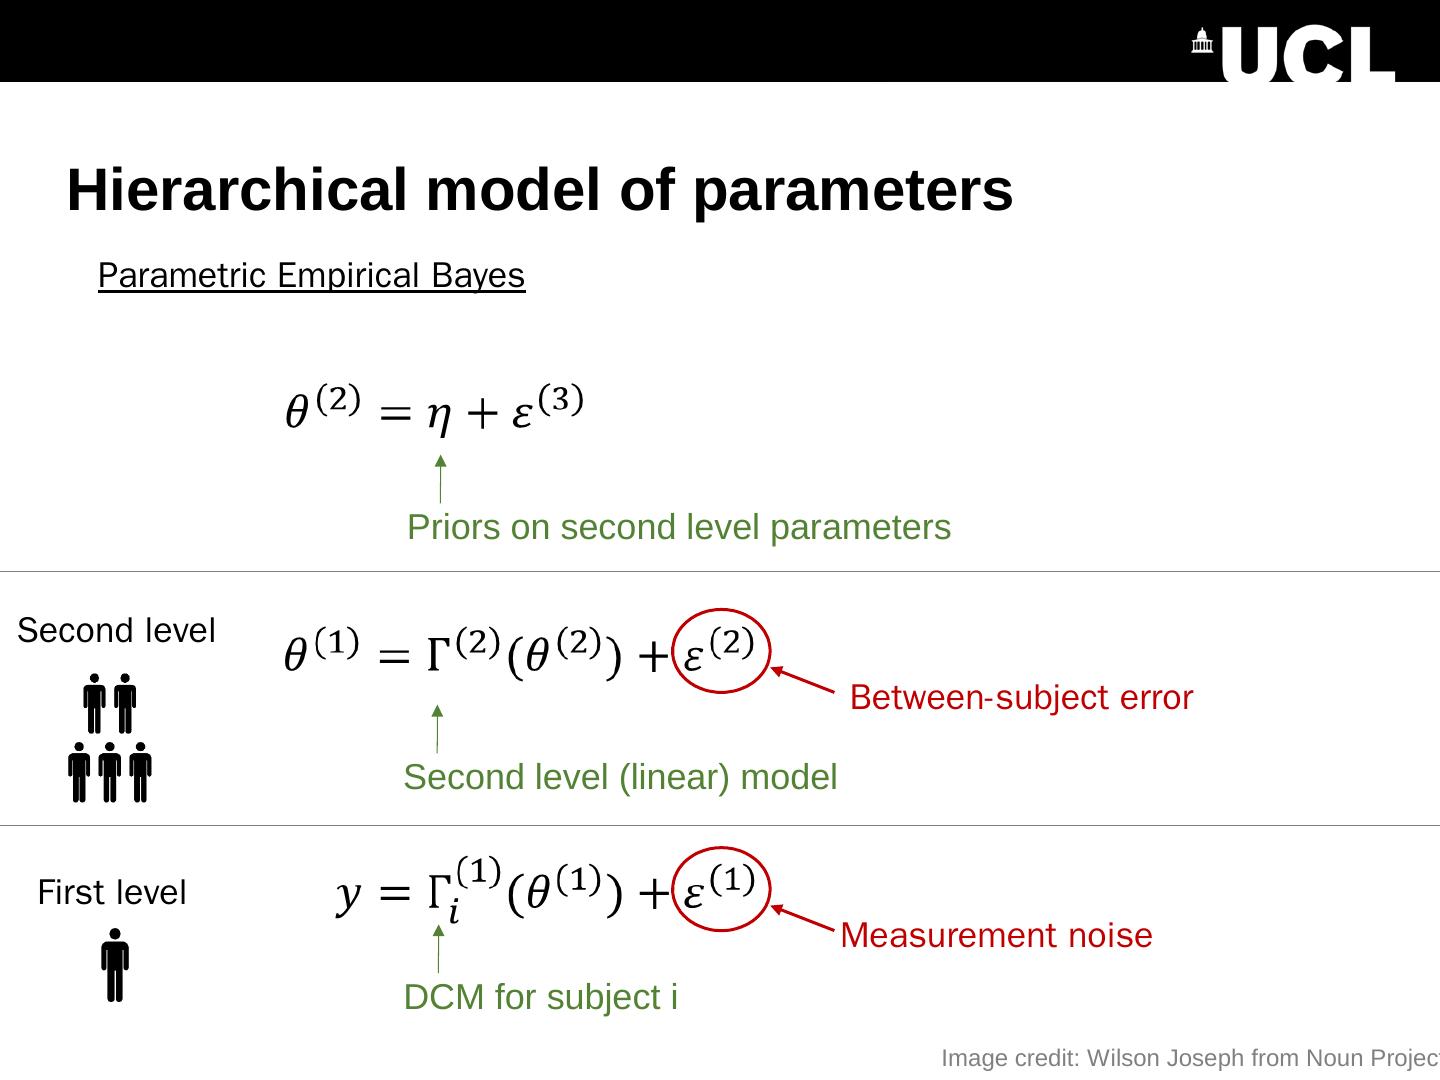
25 .Hierarchical model of parameters Second level (linear) model Priors on second level parameters Parametric Empirical Bayes Between-subject error DCM for subject i Measurement noise First level Second level Image credit: Wilson Joseph from Noun Project
26 .Hierarchical model of parameters Group level parameters Design matrix (covariates) Group-level effects Connection 5 10 15 1 2 3 4 5 6 = Connection 1 2 3 4 5 6 Mean Covariate 1 Covariate 2 Between-subjects effects Covariate Subject 1 2 3 5 10 15 20 25 30
27 .PEB Estimation DCMs Subject 1 . Subject N . PEB Estimation First level Second level First level free energy / parameters with empirical priors
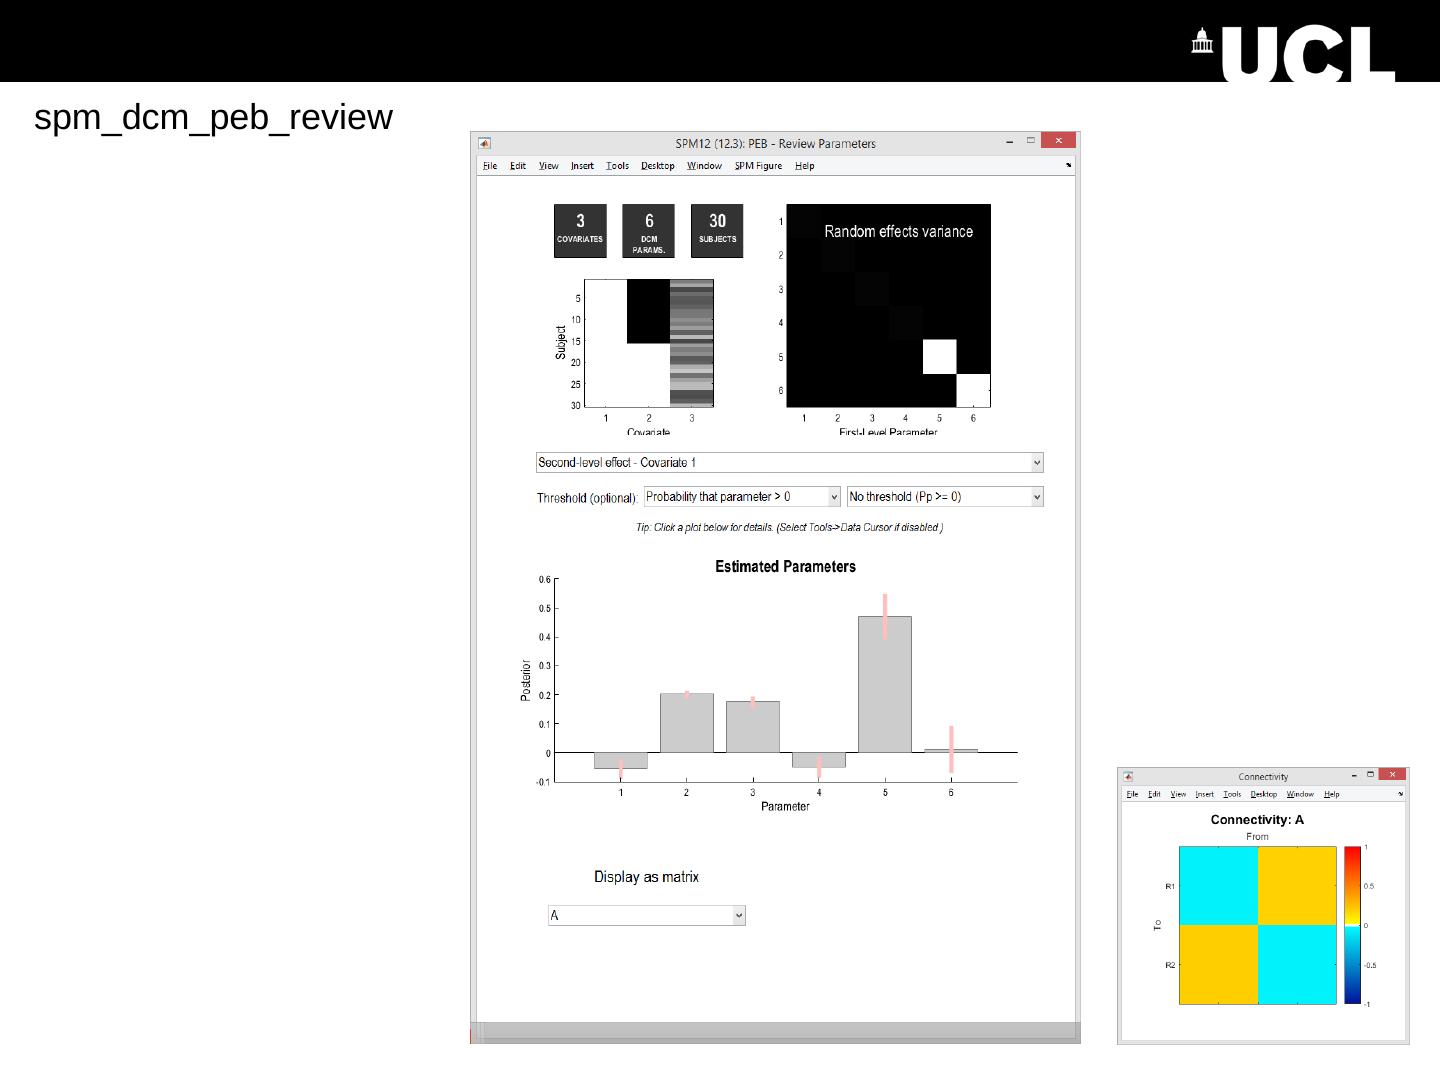
28 .spm_dcm_peb_review
29 .subjects DCMs PEB spm_dcm_peb Model comparison at the group level Has parameters representing the effect of each covariate on each connection Step 3: Specify reduced (nested) PEB models Certain parameters ‘turned off’ e.g. all those pertaining to one covariate or connection spm_dcm_peb_bmc Bayesian Model Average Step 1: Estimate a DCM for each subject Step 2: Estimate a PEB model


