- 快召唤伙伴们来围观吧
- 微博 QQ QQ空间 贴吧
- 文档嵌入链接
- 复制
- 微信扫一扫分享
- 已成功复制到剪贴板
Classification: Probabilistic Generative Model
展开查看详情
1 .Classification: Probabilistic Generative Model
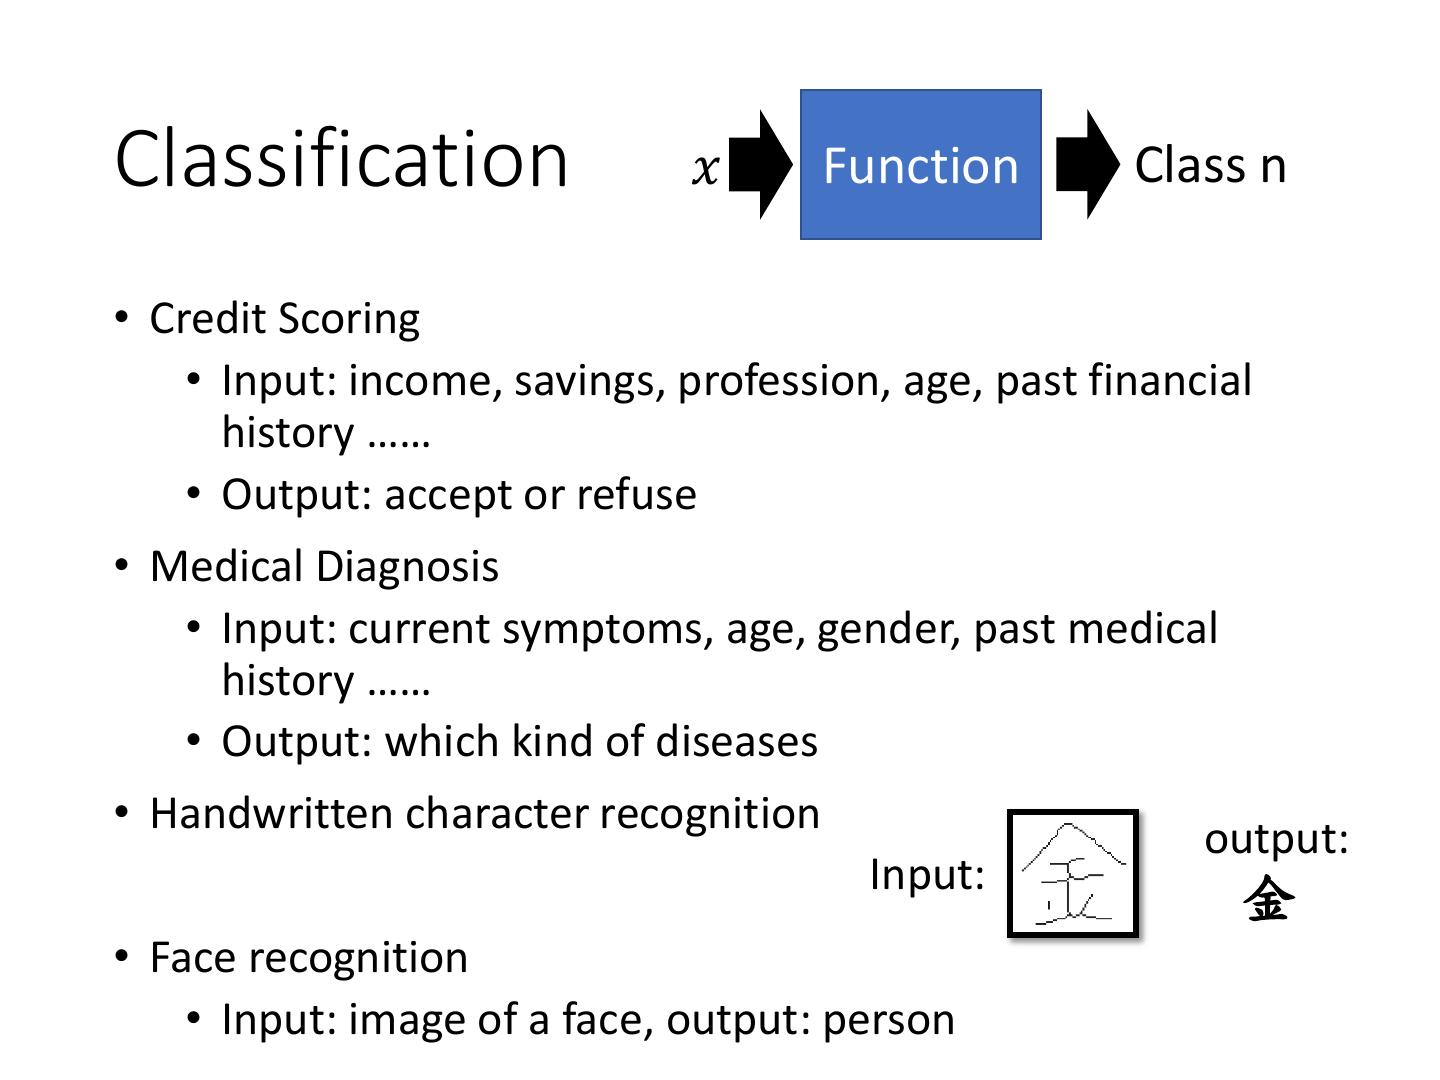
2 .Classification 𝑥 Function Class n • Credit Scoring • Input: income, savings, profession, age, past financial history …… • Output: accept or refuse • Medical Diagnosis • Input: current symptoms, age, gender, past medical history …… • Output: which kind of diseases • Handwritten character recognition output: Input: 金 • Face recognition • Input: image of a face, output: person
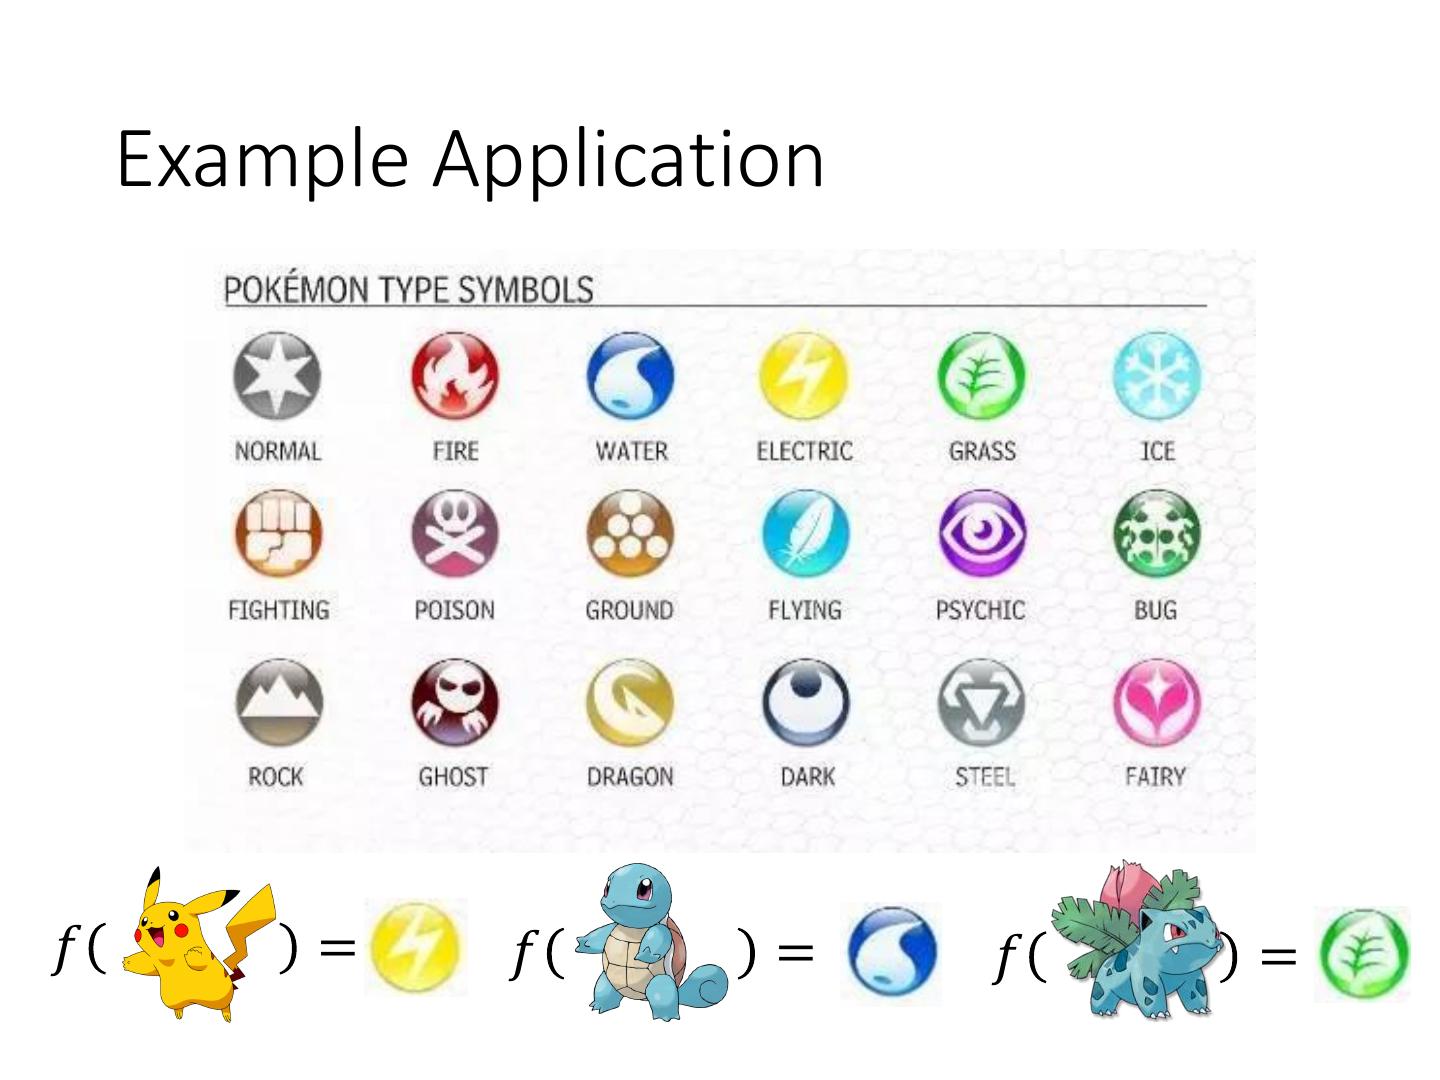
3 . Example Application 𝑓 = 𝑓 = 𝑓 =
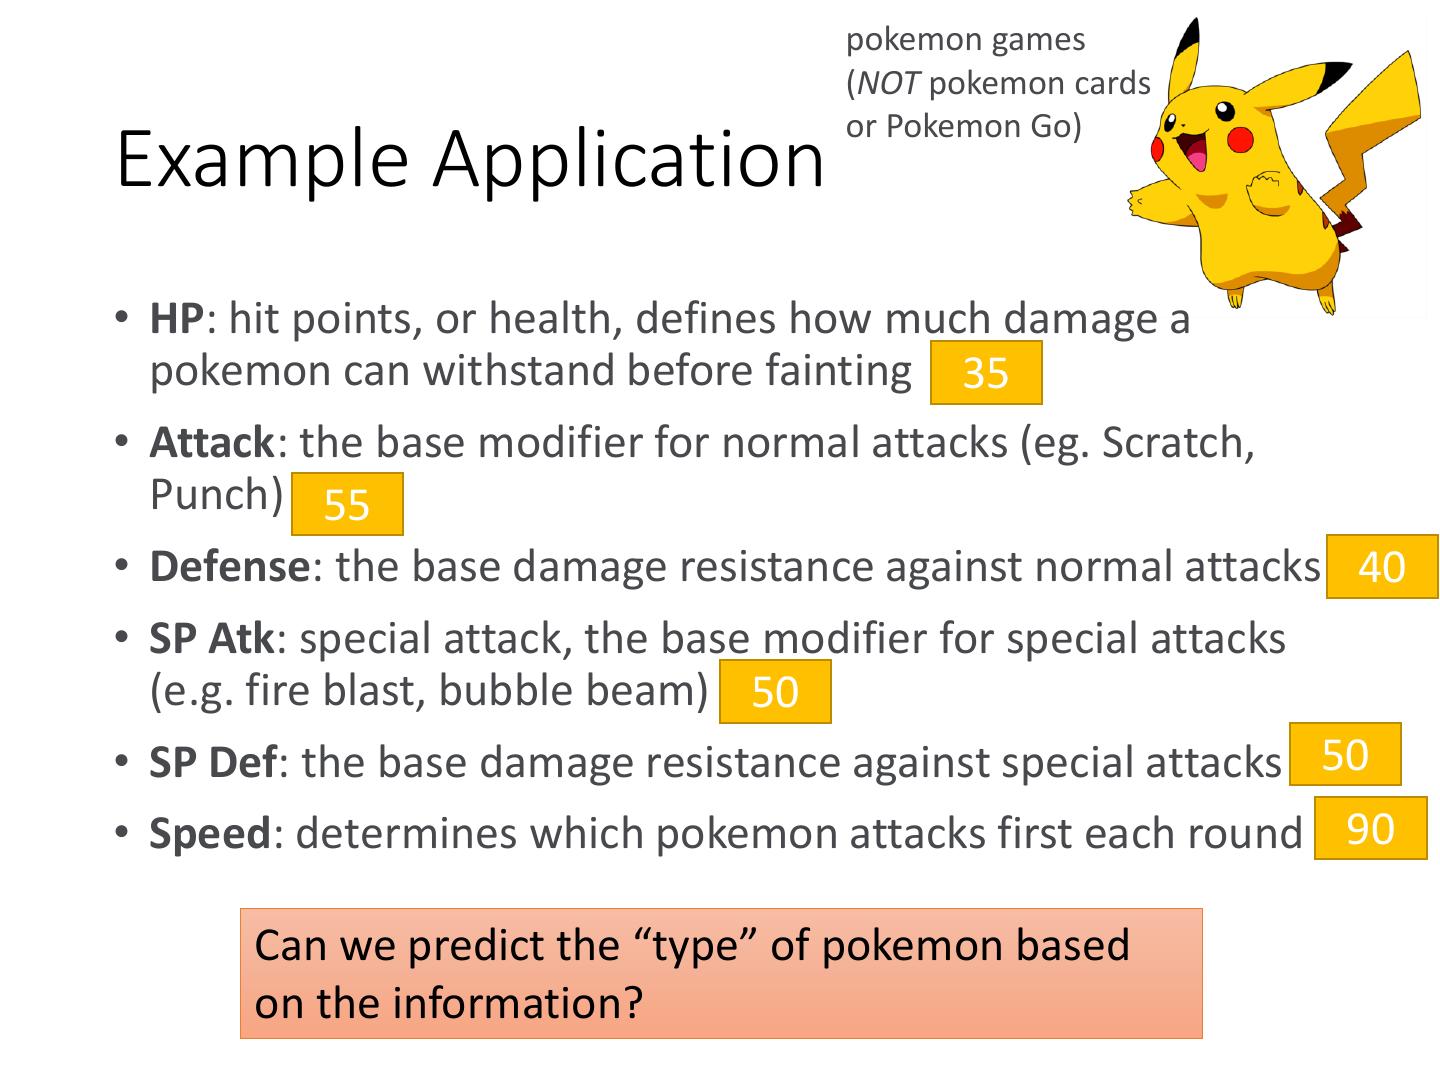
4 . pokemon games (NOT pokemon cards or Pokemon Go) Example Application • HP: hit points, or health, defines how much damage a pokemon can withstand before fainting 35 • Attack: the base modifier for normal attacks (eg. Scratch, Punch) 55 • Defense: the base damage resistance against normal attacks 40 • SP Atk: special attack, the base modifier for special attacks (e.g. fire blast, bubble beam) 50 • SP Def: the base damage resistance against special attacks 50 • Speed: determines which pokemon attacks first each round 90 Can we predict the “type” of pokemon based on the information?
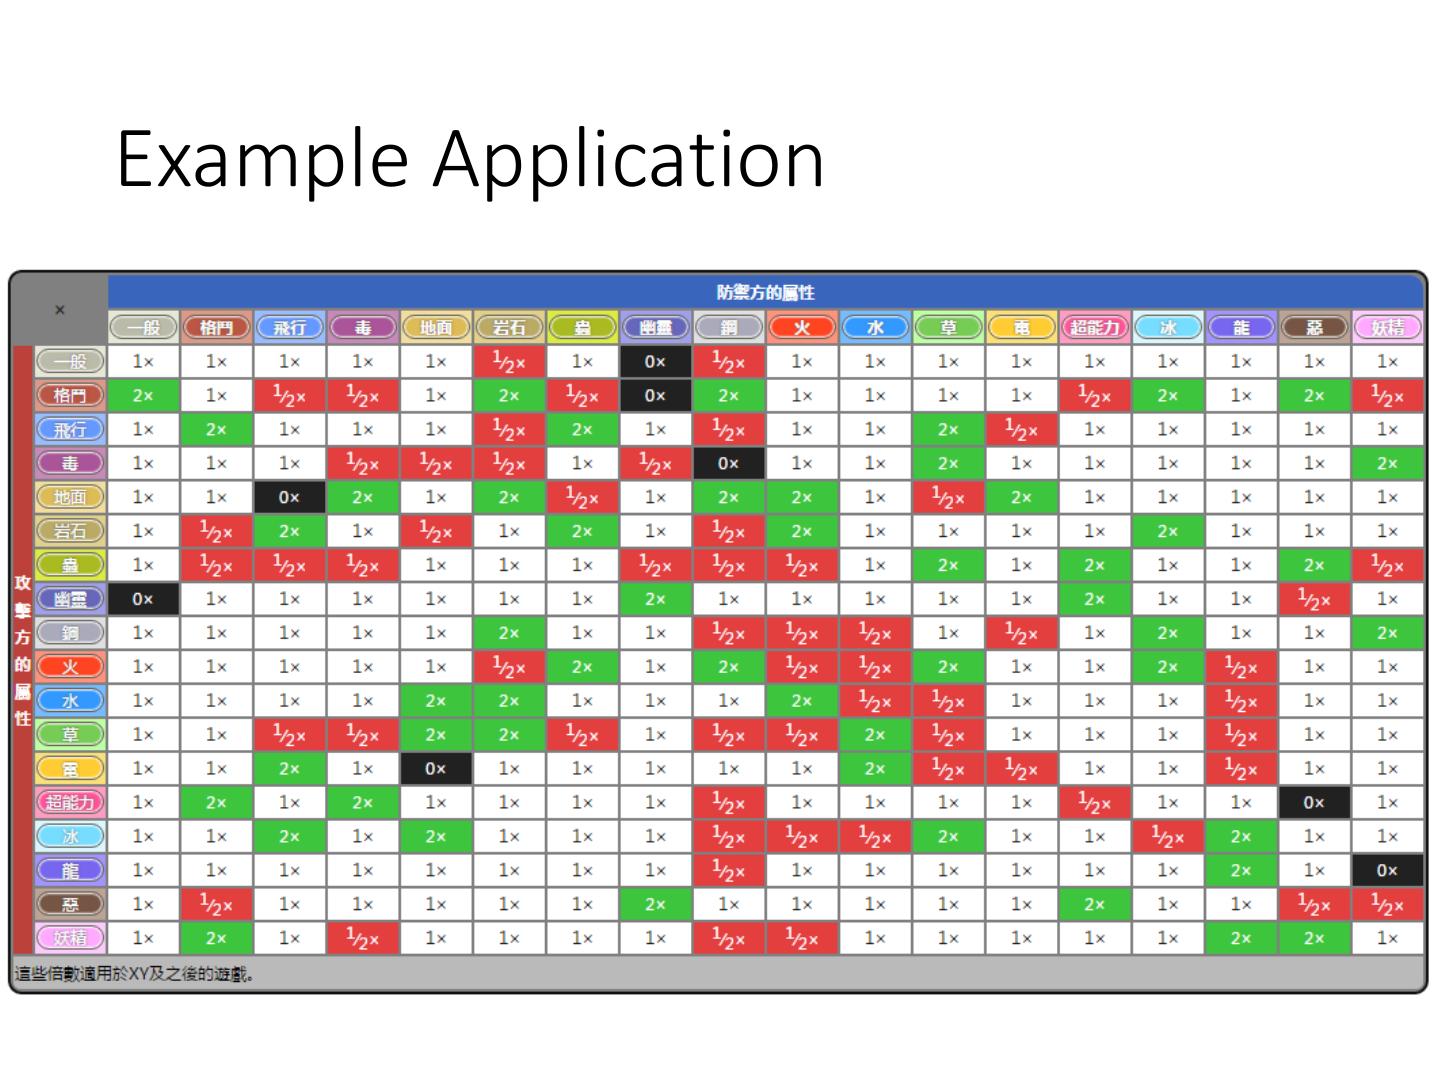
5 .Example Application
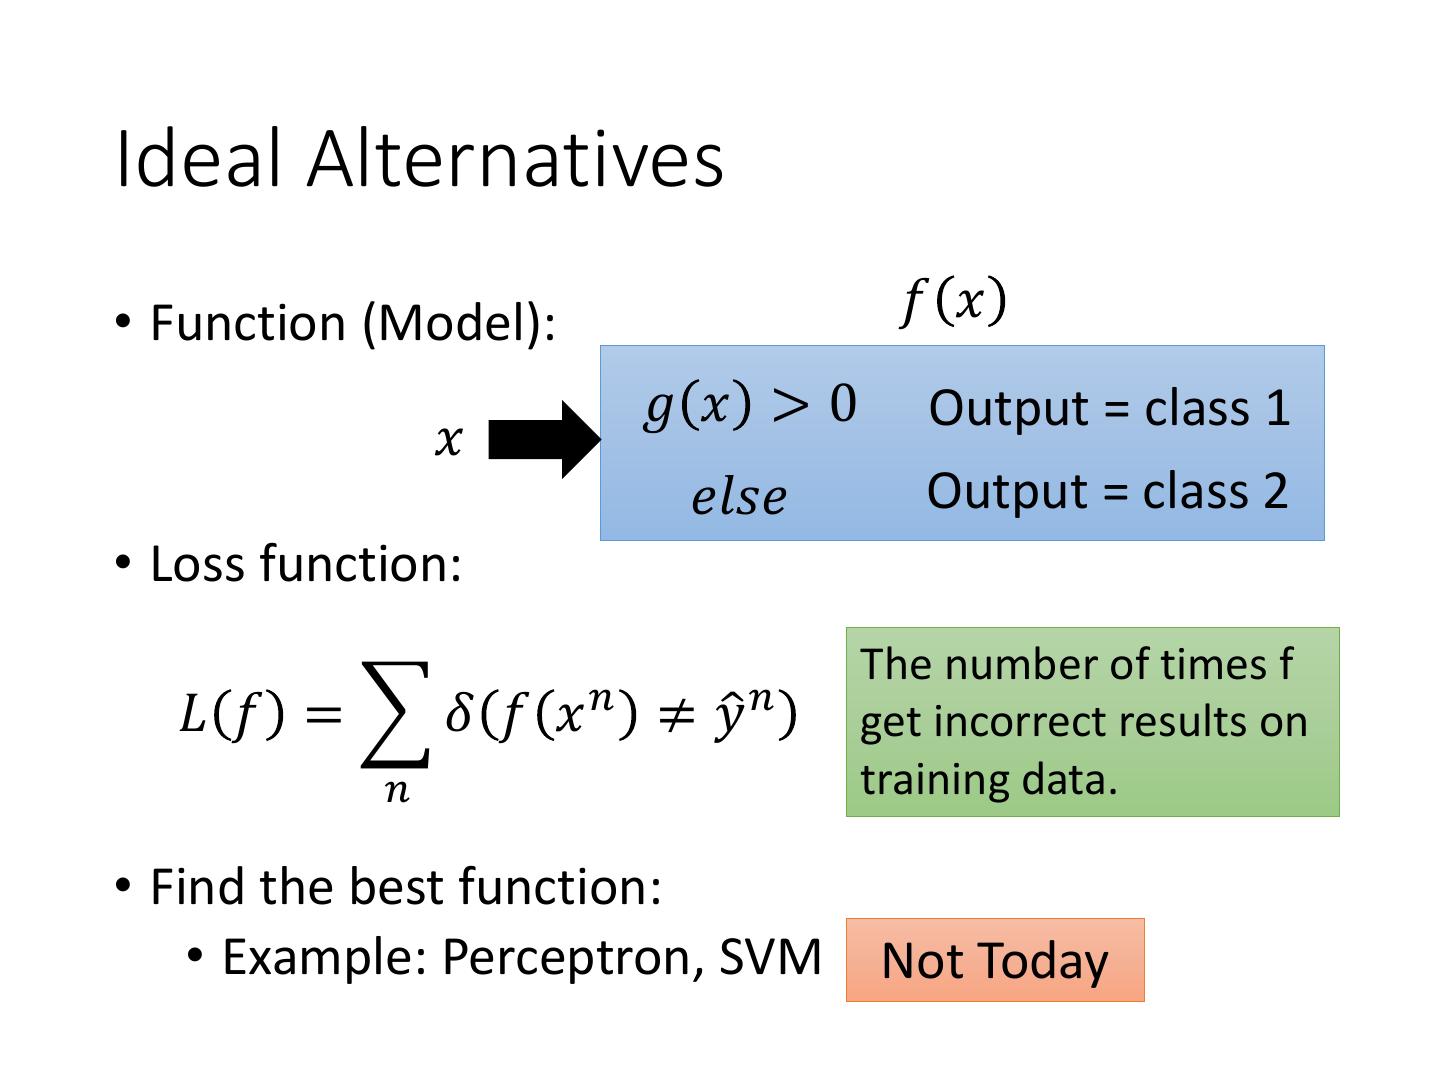
6 .Ideal Alternatives • Function (Model): 𝑓 𝑥 𝑔 𝑥 >0 Output = class 1 𝑥 𝑒𝑙𝑠𝑒 Output = class 2 • Loss function: The number of times f 𝐿 𝑓 = 𝛿 𝑓 𝑥 𝑛 ≠ 𝑦ො 𝑛 get incorrect results on 𝑛 training data. • Find the best function: • Example: Perceptron, SVM Not Today
7 .How to do Classification • Training data for Classification 𝑥 1 , 𝑦ො 1 𝑥 2 , 𝑦ො 2 …… 𝑥 𝑁 , 𝑦ො 𝑁 Classification as Regression? Binary classification as example Training: Class 1 means the target is 1; Class 2 means the target is -1 Testing: closer to 1 → class 1; closer to -1 → class 2
8 . b + w1x1 + w2x2 = 0 to decrease error Class 2 Class 2 -1 -1 1 1 x2 x2 Class 1 Class 1 >>1 y = b + w1x1 + w2x2 error x1 x1 Penalize to the examples that are “too correct” … (Bishop, P186) • Multiple class: Class 1 means the target is 1; Class 2 means the target is 2; Class 3 means the target is 3 …… problematic
9 . Two Boxes Box 1 Box 2 P(B1) = 2/3 P(B2) = 1/3 P(Blue|B1) = 4/5 P(Blue|B1) = 2/5 P(Green|B1) = 1/5 P(Green|B1) = 3/5 from one of the boxes Where does it come from? 𝑃 Blue|𝐵1 𝑃 𝐵1 P(B1 | Blue) = 𝑃 Blue|𝐵1 𝑃 𝐵1 + 𝑃 Blue|𝐵2 𝑃 𝐵2
10 . Estimating the Probabilities Two Classes From training data Class 1 Class 2 P(C1) P(C2) P(x|C1) P(x|C2) Given an x, which class does it belong to 𝑃 𝑥|𝐶1 𝑃 𝐶1 𝑃 𝐶1 |𝑥 = 𝑃 𝑥|𝐶1 𝑃 𝐶1 + 𝑃 𝑥|𝐶2 𝑃 𝐶2 Generative Model 𝑃 𝑥 = 𝑃 𝑥|𝐶1 𝑃 𝐶1 + 𝑃 𝑥|𝐶2 𝑃 𝐶2
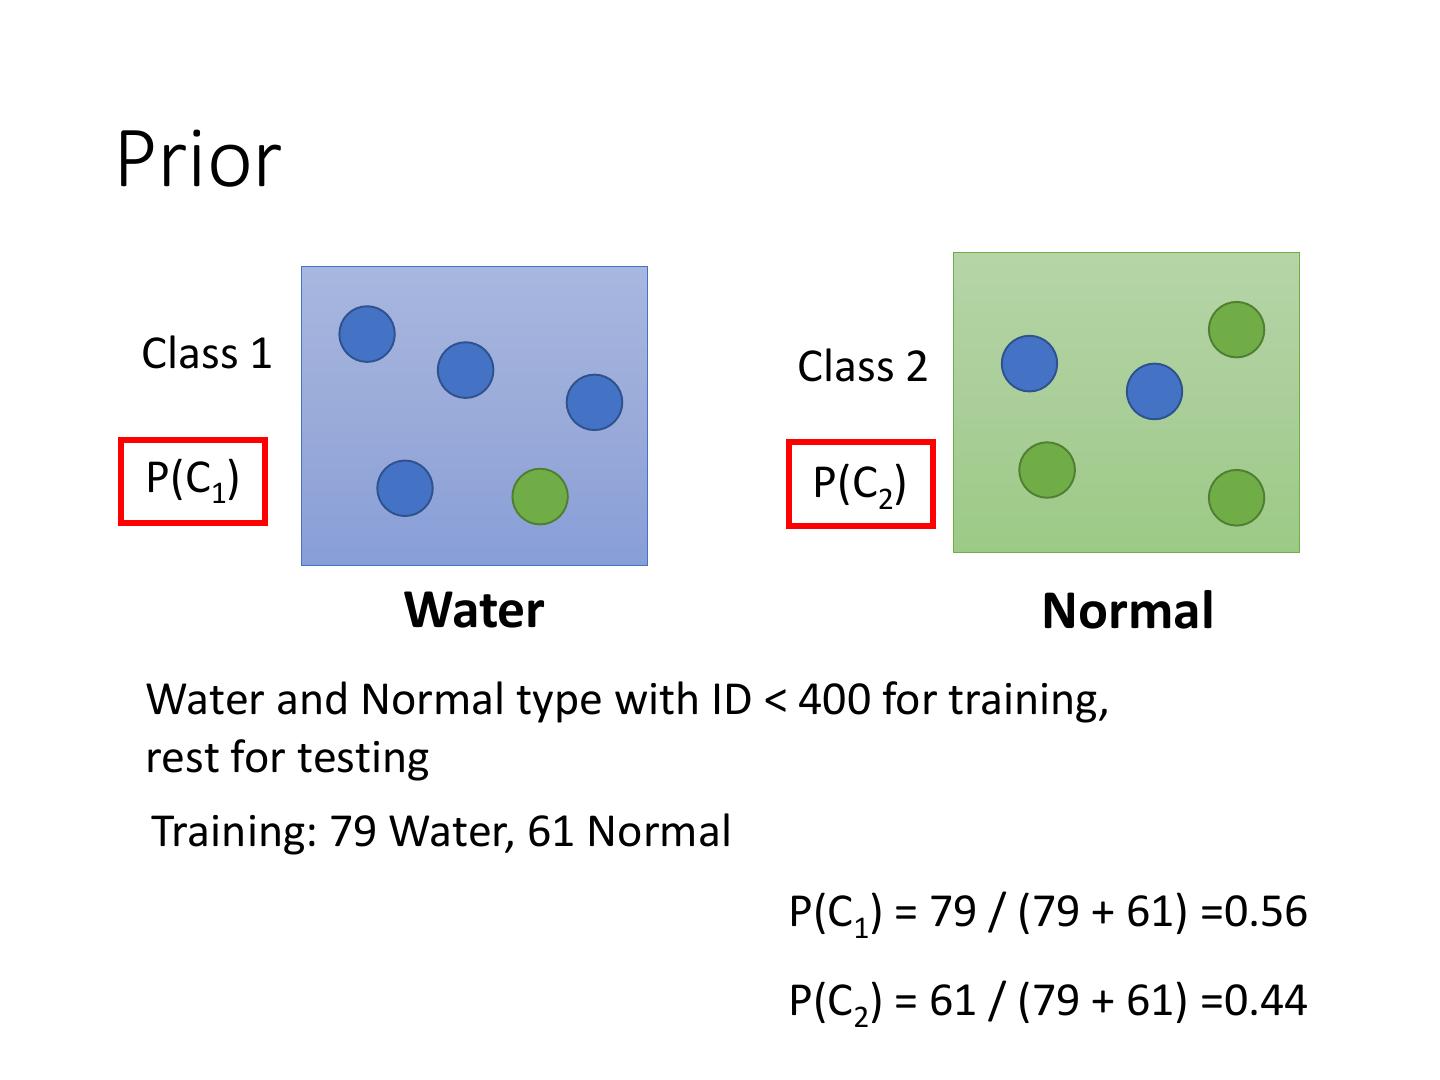
11 .Prior Class 1 Class 2 P(C1) P(C2) Water Normal Water and Normal type with ID < 400 for training, rest for testing Training: 79 Water, 61 Normal P(C1) = 79 / (79 + 61) =0.56 P(C2) = 61 / (79 + 61) =0.44
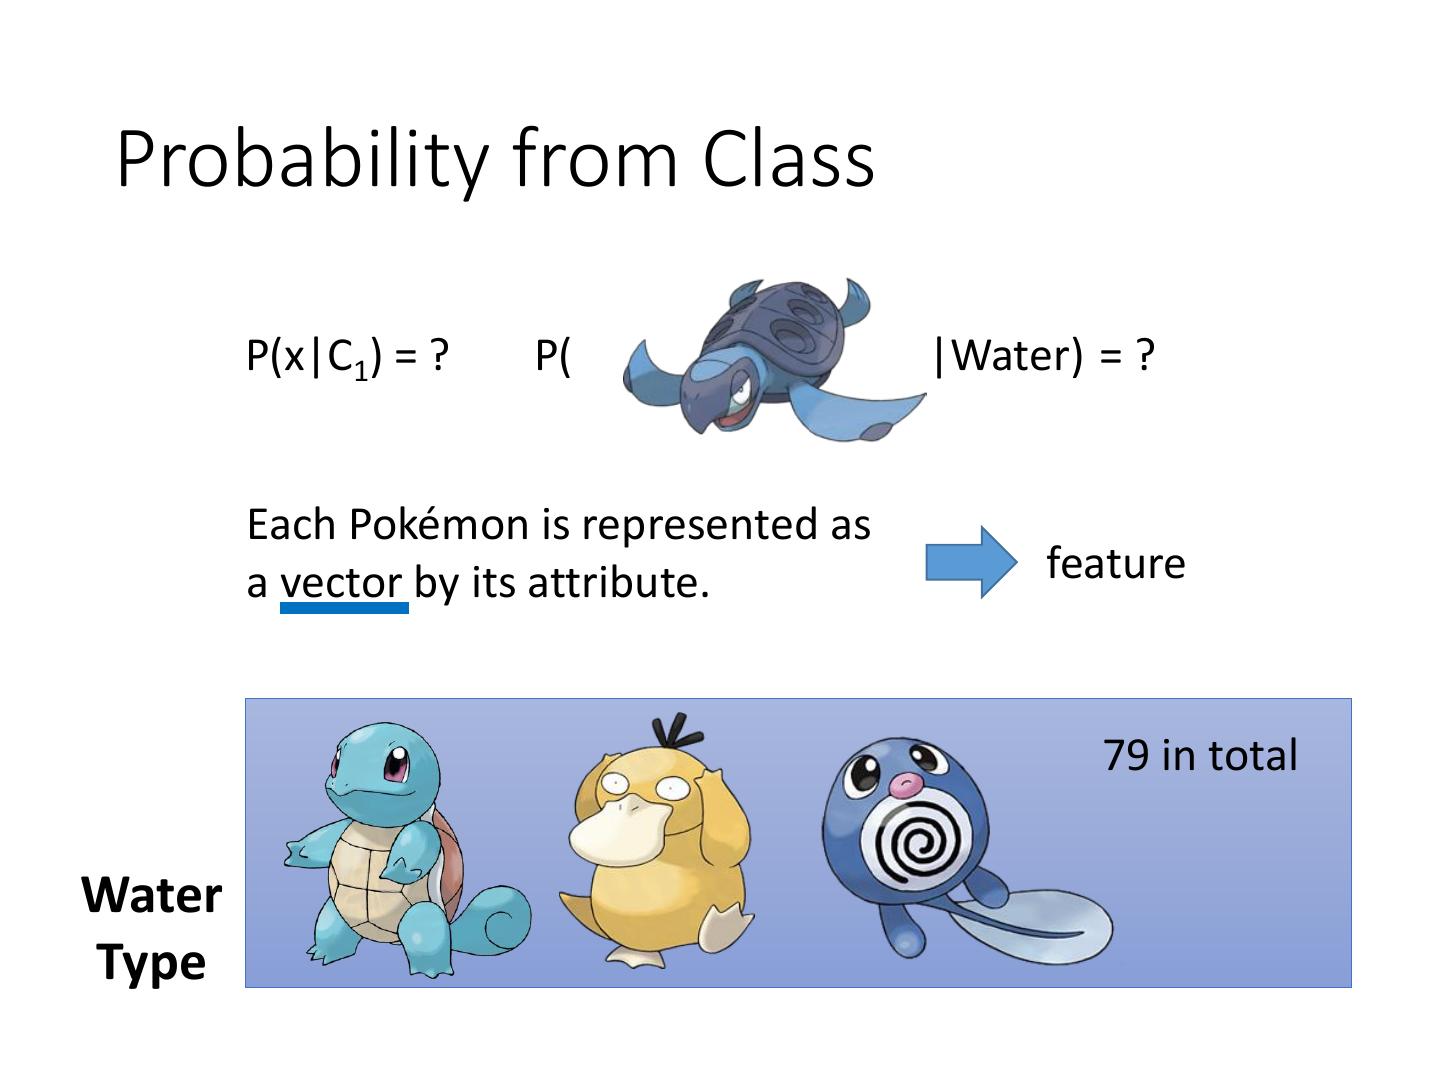
12 . Probability from Class P(x|C1) = ? P( |Water) = ? Each Pokémon is represented as a vector by its attribute. feature 79 in total Water Type
13 . Probability from Class - Feature • Considering Defense and SP Defense 48 𝑥 1 , 𝑥 2 , 𝑥 3 , …… ,𝑥 79 50 65 64 P(x|Water)=? 0? Assume the points 103 Water 45 are sampled from a Type Gaussian distribution.
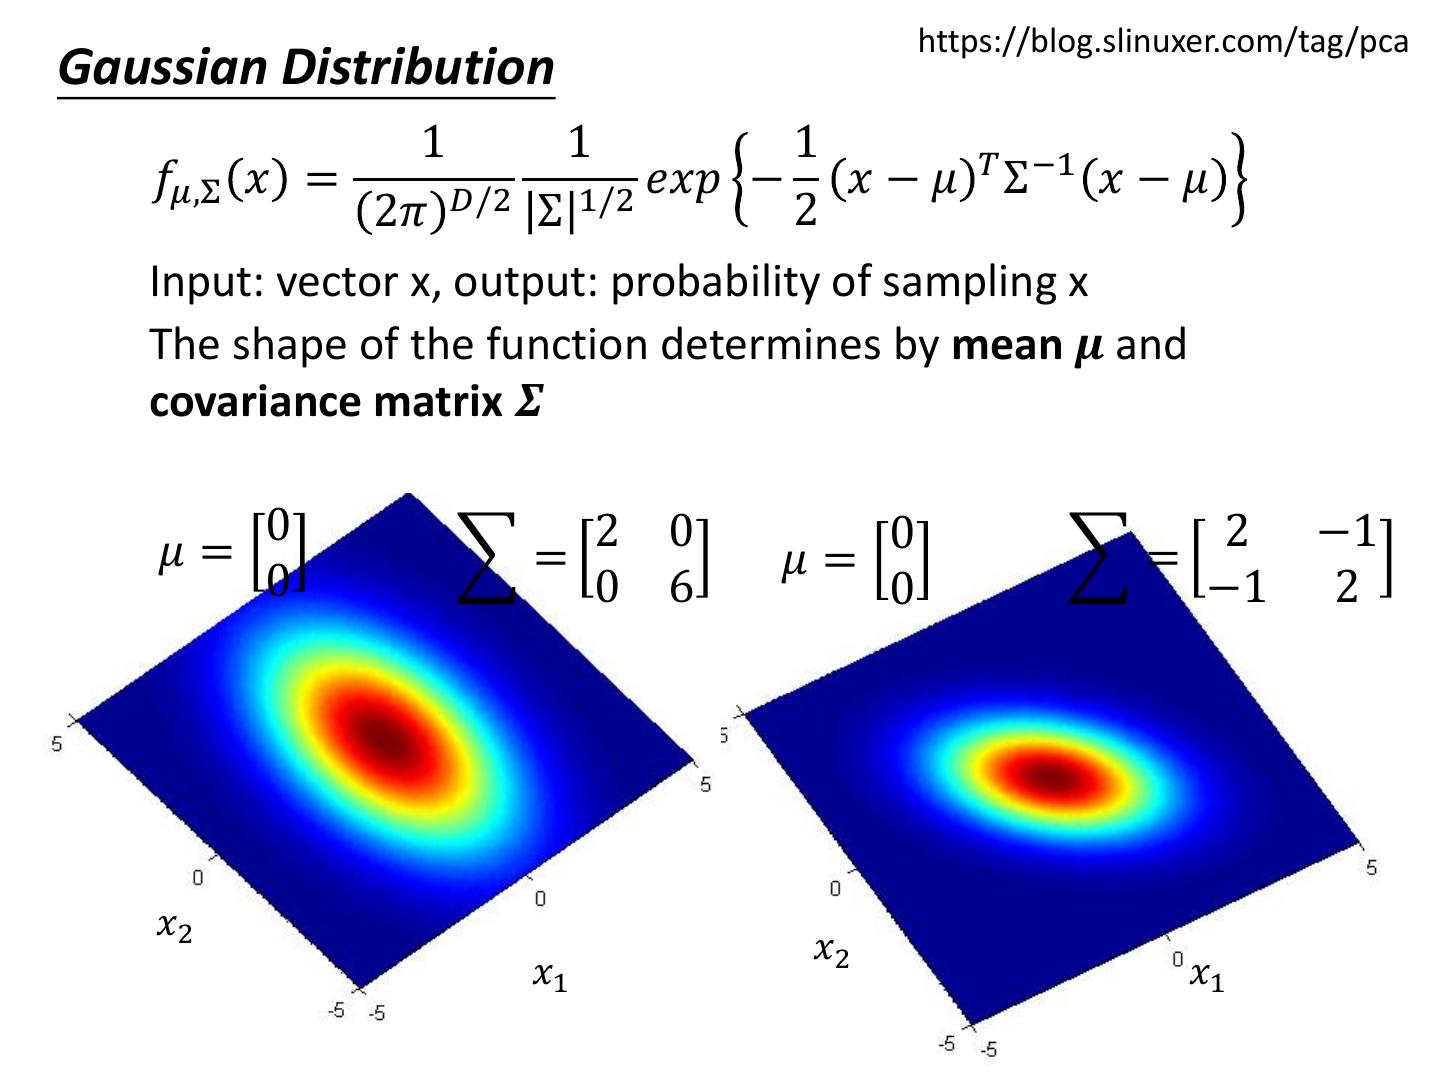
14 . https://blog.slinuxer.com/tag/pca Gaussian Distribution 1 1 1 𝑇 −1 𝑓𝜇,Σ 𝑥 = 𝐷/2 1/2 𝑒𝑥𝑝 − 𝑥 − 𝜇 Σ 𝑥−𝜇 2𝜋 Σ 2 Input: vector x, output: probability of sampling x The shape of the function determines by mean 𝝁 and covariance matrix 𝜮 0 2 0 2 2 0 𝜇= = 𝜇= = 0 0 2 3 0 2 𝑥2 𝑥2 𝑥1 𝑥1
15 . https://blog.slinuxer.com/tag/pca Gaussian Distribution 1 1 1 𝑇 −1 𝑓𝜇,Σ 𝑥 = 𝐷/2 1/2 𝑒𝑥𝑝 − 𝑥 − 𝜇 Σ 𝑥−𝜇 2𝜋 Σ 2 Input: vector x, output: probability of sampling x The shape of the function determines by mean 𝝁 and covariance matrix 𝜮 0 2 0 0 2 −1 𝜇= = 𝜇= = 0 0 6 0 −1 2 𝑥2 𝑥2 𝑥1 𝑥1
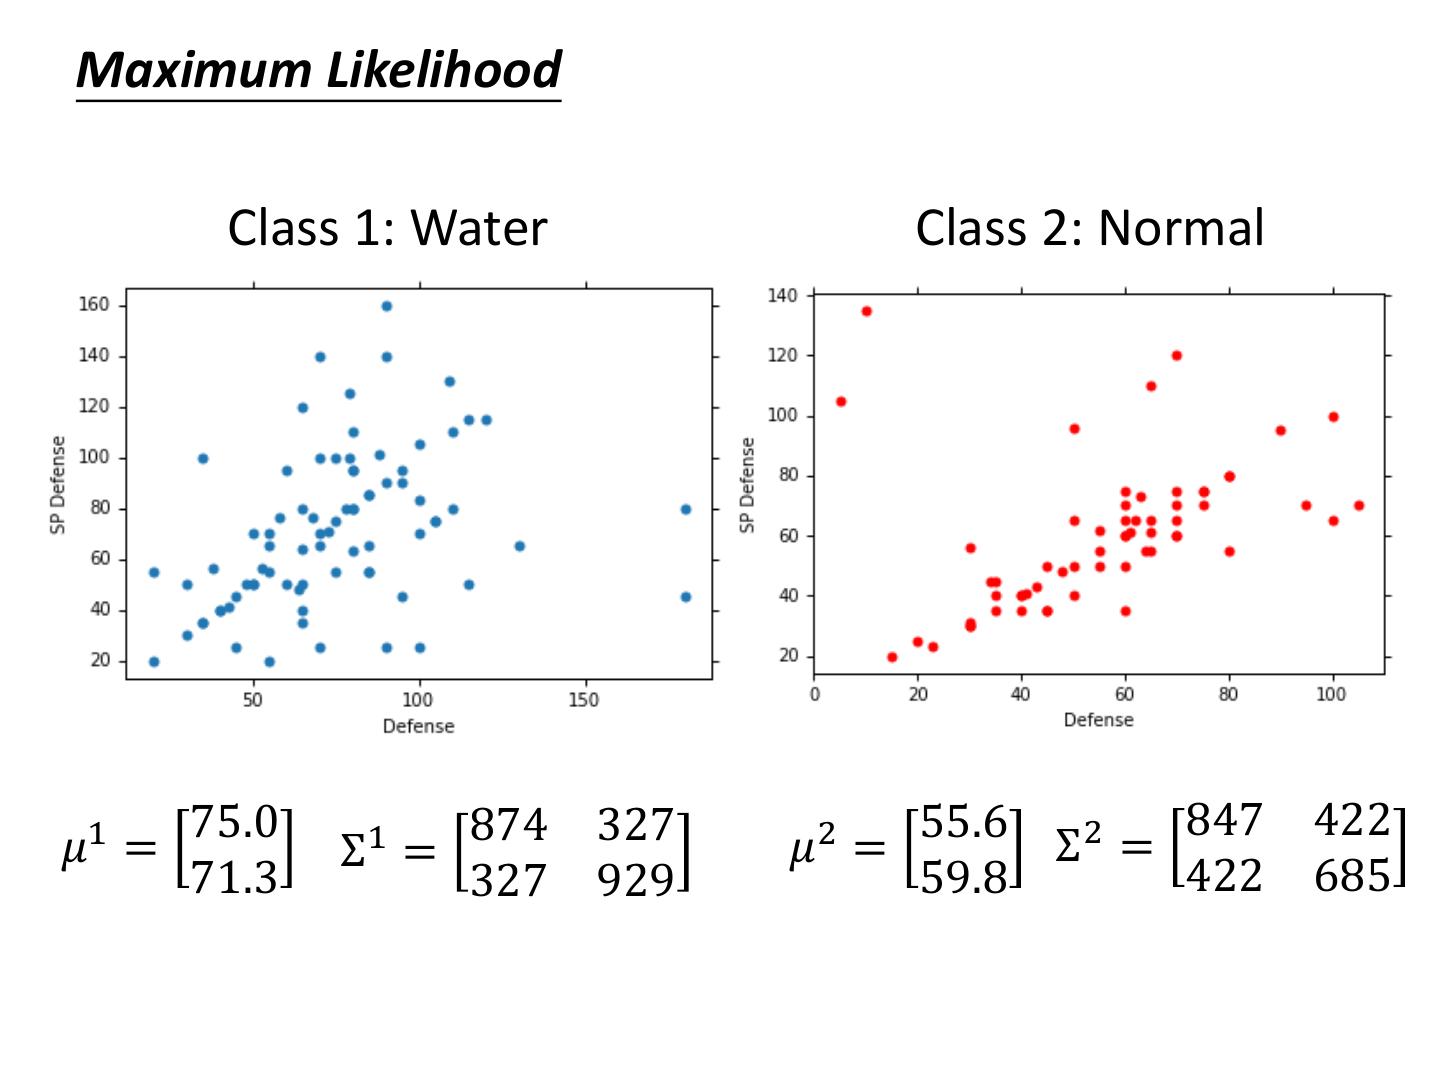
16 . Probability from Class Assume the points are sampled from a Gaussian distribution Find the Gaussian distribution behind them Probability for new points 𝑥 1 , 𝑥 2 , 𝑥 3 , …… ,𝑥 79 New x 75.0 𝜇= 71.3 874 327 Σ= 327 929 How to find them? 1 1 1 Water 𝑓𝜇,Σ 𝑥 = 𝑒𝑥𝑝 − 𝑥 − 𝜇 𝑇 Σ −1 𝑥 − 𝜇 2𝜋 𝐷/2 Σ 1/2 2 Type
17 . 1 1 1 Maximum Likelihood 𝑓𝜇,Σ 𝑥 = 𝐷/2 1/2 𝑒𝑥𝑝 − 𝑥 − 𝜇 𝑇 Σ −1 𝑥 − 𝜇 2𝜋 Σ 2 5 0 𝑥 1 , 𝑥 2 , 𝑥 3 , …… ,𝑥 79 = 150 0 5 𝜇= 140 2 −1 = 75 −1 2 𝜇= 75 The Gaussian with any mean 𝜇 and covariance matrix 𝛴 can generate these points. Different Likelihood Likelihood of a Gaussian with mean 𝜇 and covariance matrix 𝛴 = the probability of the Gaussian samples 𝑥 1 , 𝑥 2 , 𝑥 3 , …… ,𝑥 79 𝐿 𝜇, Σ = 𝑓𝜇,Σ 𝑥 1 𝑓𝜇,Σ 𝑥 2 𝑓𝜇,Σ 𝑥 3 … … 𝑓𝜇,Σ 𝑥 79
18 .Maximum Likelihood We have the “Water” type Pokémons: 𝑥 1 , 𝑥 2 , 𝑥 3 , …… ,𝑥 79 We assume 𝑥 1 , 𝑥 2 , 𝑥 3 , …… ,𝑥 79 generate from the Gaussian (𝜇∗ , Σ ∗ ) with the maximum likelihood 𝐿 𝜇, Σ = 𝑓𝜇,Σ 𝑥 1 𝑓𝜇,Σ 𝑥 2 𝑓𝜇,Σ 𝑥 3 … … 𝑓𝜇,Σ 𝑥 79 1 1 1 𝑓𝜇,Σ 𝑥 = 𝐷/2 1/2 𝑒𝑥𝑝 − 𝑥 − 𝜇 𝑇 Σ −1 𝑥 − 𝜇 2𝜋 Σ 2 𝜇∗ , Σ ∗ = 𝑎𝑟𝑔 max 𝐿 𝜇, Σ 𝜇,Σ 79 79 1 1 𝜇∗ = 𝑥𝑛 ∗ Σ = 𝑥 𝑛 − 𝜇∗ 𝑥 𝑛 − 𝜇∗ 𝑇 79 79 𝑛=1 average 𝑛=1
19 .Maximum Likelihood Class 1: Water Class 2: Normal 75.0 874 327 55.6 847 422 𝜇1 = Σ1 = 𝜇2 = Σ2 = 71.3 327 929 59.8 422 685
20 . Now we can do classification 1 1 1 1 𝑇 𝑓𝜇1,Σ1 𝑥 = 𝑒𝑥𝑝 − 𝑥 − 𝜇 Σ1 −1 𝑥 − 𝜇1 P(C1) 2𝜋 𝐷/2 Σ1 1/2 2 = 79 / (79 + 61) =0.56 75.0 874 327 𝜇1 = Σ1 = 71.3 327 929 𝑃 𝑥|𝐶1 𝑃 𝐶1 𝑃 𝐶1 |𝑥 = 𝑃 𝑥|𝐶1 𝑃 𝐶1 + 𝑃 𝑥|𝐶2 𝑃 𝐶2 1 1 1 P(C2) 𝑓𝜇2,Σ2 𝑥 = 𝐷/2 2 1/2 𝑒𝑥𝑝 − 𝑥 − 𝜇2 𝑇 Σ2 −1 𝑥 − 𝜇2 2𝜋 Σ 2 = 61 / (79 + 61) =0.44 55.6 847 422 𝜇2 = Σ2 = 59.8 422 685 If 𝑃 𝐶1 |𝑥 > 0.5 x belongs to class 1 (Water)
21 . 𝑃 𝐶1 |𝑥 > 0.5 𝑃 𝐶1 |𝑥 𝑃 𝐶1 |𝑥 < 0.5 Blue points: C1 (Water), Red points: C2 (Normal) How’s the results? 𝑃 𝐶1 |𝑥 Testing data: 47% accuracy > 0.5 All: hp, att, sp att, de, sp de, speed (6 features) 𝜇1 , 𝜇2 : 6-dim vector Σ1 , Σ 2 : 6 x 6 matrices 𝑃 𝐶1 |𝑥 64% accuracy … < 0.5
22 . Modifying Model Class 1: Water Class 2: Normal 75.0 874 327 55.6 847 422 𝜇1 = 1 Σ = 𝜇2 = Σ2 = 71.3 327 929 59.8 422 685 The same Σ Less parameters
23 . Ref: Bishop, Modifying Model chapter 4.2.2 • Maximum likelihood “Water” type Pokémons: “Normal” type Pokémons: 𝑥 1 , 𝑥 2 , 𝑥 3 , …… ,𝑥 79 𝑥 80 , 𝑥 81 , 𝑥 82 , …… ,𝑥 140 𝜇1 Σ 𝜇2 Find 𝜇1 , 𝜇2 , Σ maximizing the likelihood 𝐿 𝜇1 ,𝜇2 ,Σ 𝐿 𝜇1 ,𝜇2 ,Σ = 𝑓𝜇1 ,Σ 𝑥 1 𝑓𝜇1 ,Σ 𝑥 2 ⋯ 𝑓𝜇1 ,Σ 𝑥 79 × 𝑓𝜇2 ,Σ 𝑥 80 𝑓𝜇2 ,Σ 𝑥 81 ⋯ 𝑓𝜇2 ,Σ 𝑥 140 79 1 61 2 𝜇1 and 𝜇2 is the same Σ= Σ + Σ 140 140
24 .Modifying Model The boundary is linear The same covariance matrix All: hp, att, sp att, de, sp de, speed 54% accuracy 73% accuracy
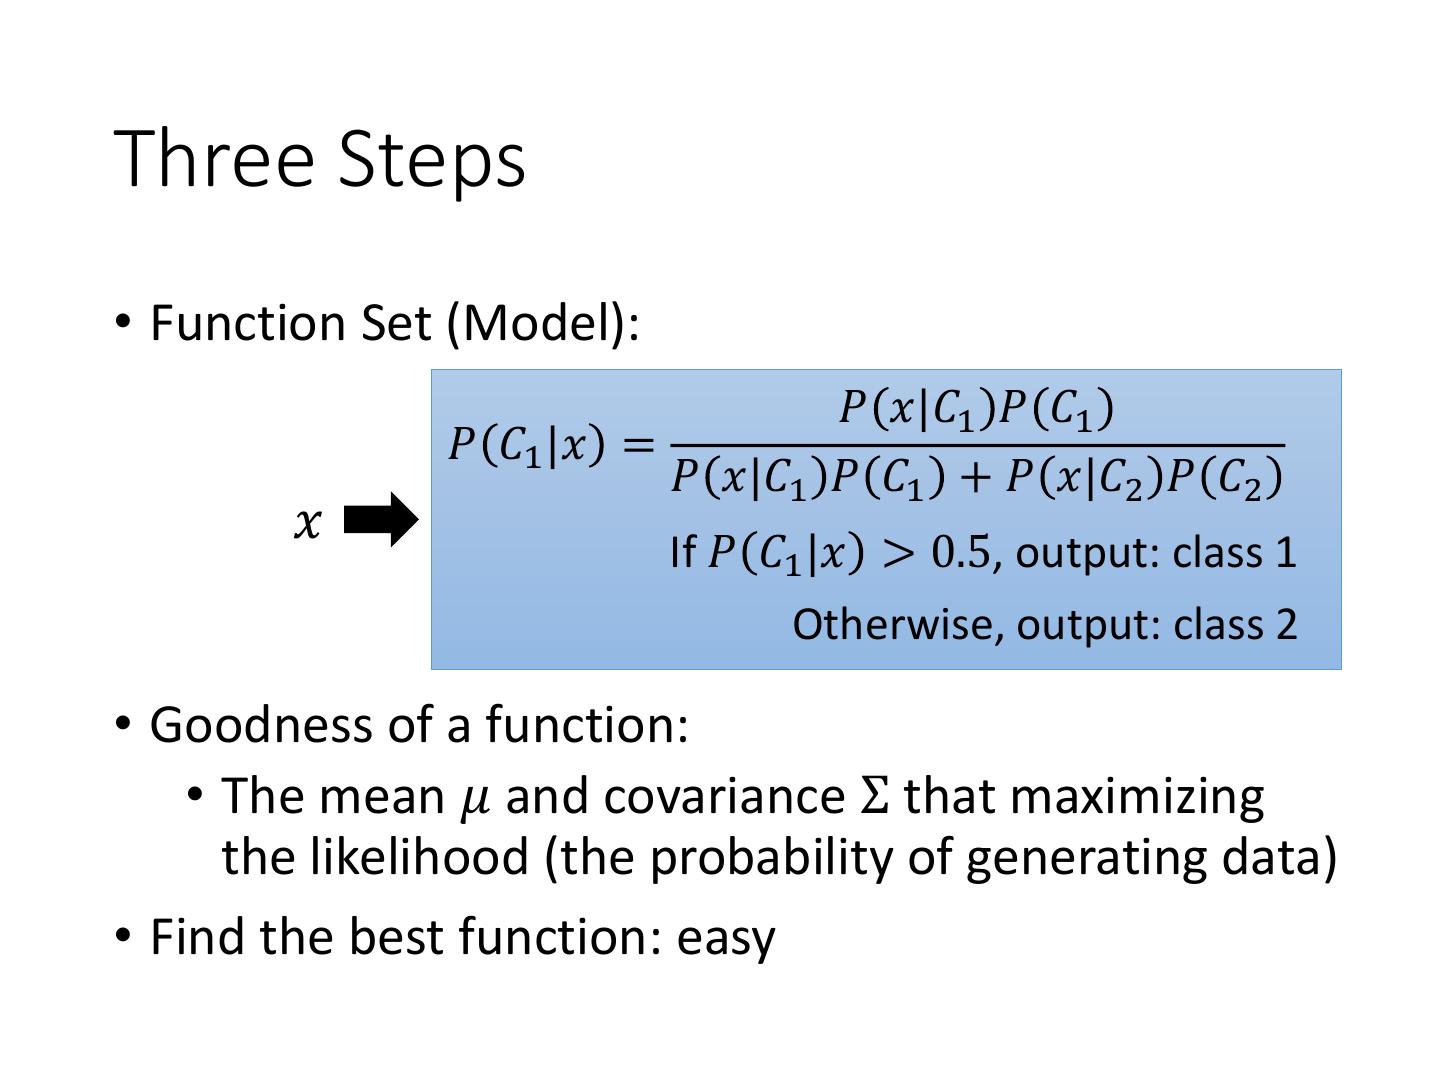
25 .Three Steps • Function Set (Model): 𝑃 𝑥|𝐶1 𝑃 𝐶1 𝑃 𝐶1 |𝑥 = 𝑃 𝑥|𝐶1 𝑃 𝐶1 + 𝑃 𝑥|𝐶2 𝑃 𝐶2 𝑥 If 𝑃 𝐶1 |𝑥 > 0.5, output: class 1 Otherwise, output: class 2 • Goodness of a function: • The mean 𝜇 and covariance Σ that maximizing the likelihood (the probability of generating data) • Find the best function: easy
26 .Probability Distribution • You can always use the distribution you like 𝑃 𝑥|𝐶1 = 𝑃 𝑥1 |𝐶1 𝑃 𝑥2 |𝐶1 …… 𝑃 𝑥 |𝐶 …… 𝑘 1 𝑥1 𝑥2 1-D Gaussian ⋮ 𝑥𝑘 For binary features, you may assume ⋮ they are from Bernoulli distributions. 𝑥𝐾 If you assume all the dimensions are independent, then you are using Naive Bayes Classifier.
27 .Posterior Probability 𝑃 𝑥|𝐶1 𝑃 𝐶1 𝑃 𝐶1 |𝑥 = 𝑃 𝑥|𝐶1 𝑃 𝐶1 + 𝑃 𝑥|𝐶2 𝑃 𝐶2 1 1 = = =𝜎 𝑧 𝑃 𝑥|𝐶2 𝑃 𝐶2 1 + 𝑒𝑥𝑝 −𝑧 1+ Sigmoid 𝑃 𝑥|𝐶1 𝑃 𝐶1 function z 𝑃 𝑥|𝐶1 𝑃 𝐶1 𝑧 = 𝑙𝑛 𝑃 𝑥|𝐶2 𝑃 𝐶2 z
28 .Warning of Math
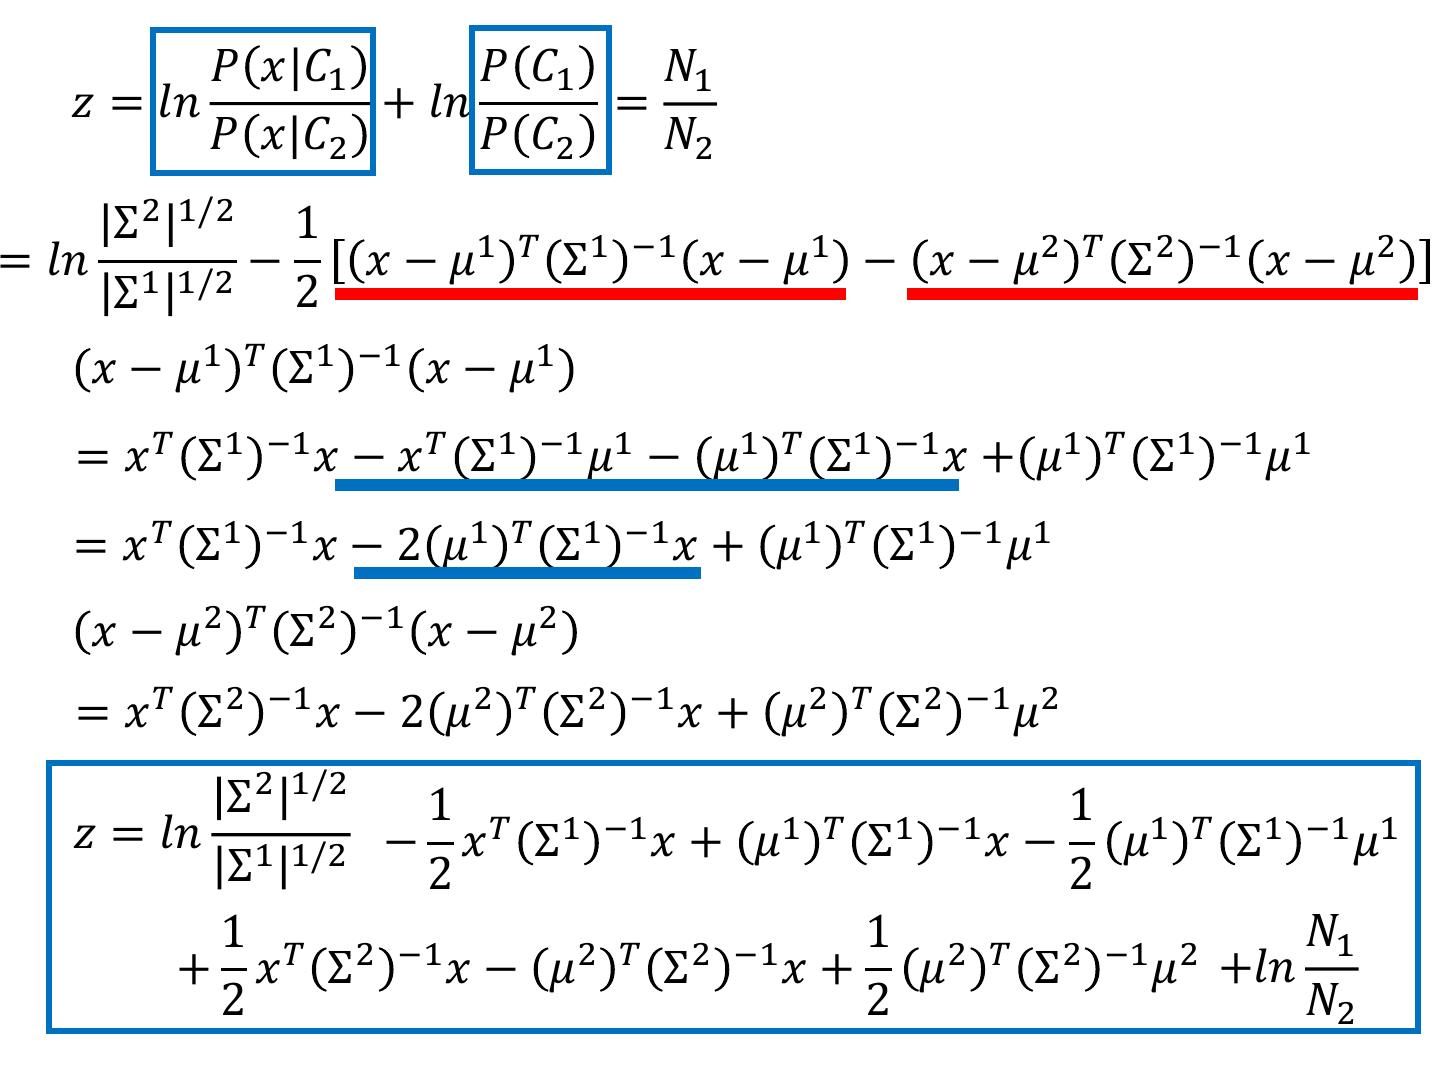
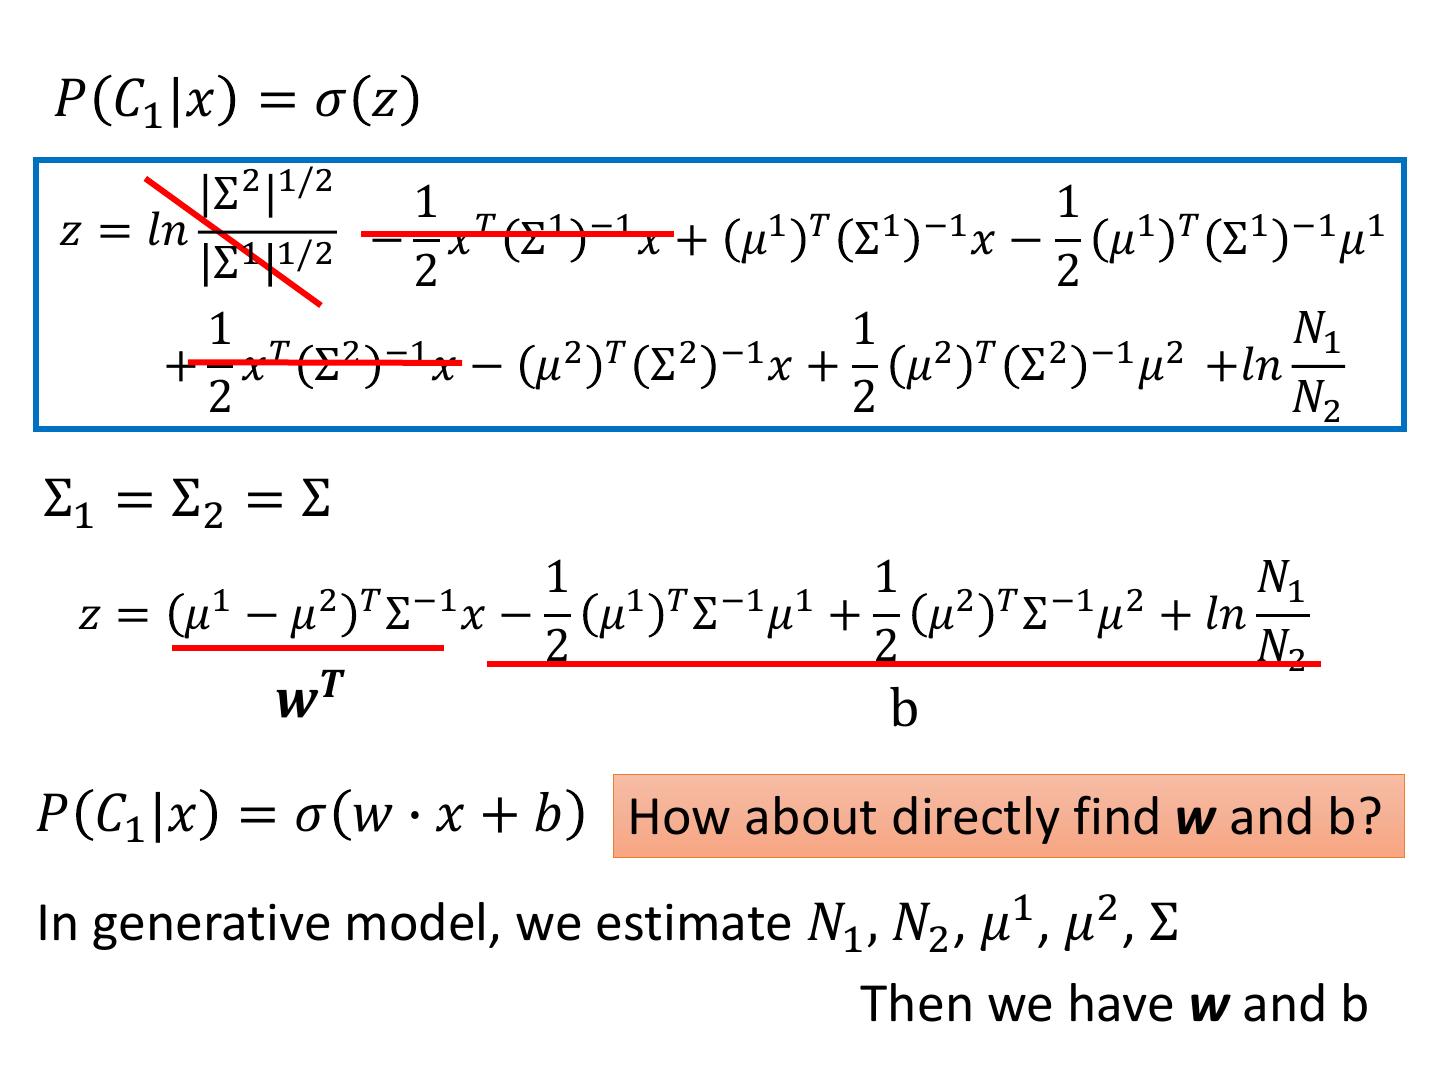
29 .Posterior Probability 𝑃 𝑥|𝐶1 𝑃 𝐶1 𝑃 𝐶1 |𝑥 = 𝜎 𝑧 sigmoid 𝑧 = 𝑙𝑛 𝑃 𝑥|𝐶2 𝑃 𝐶2 𝑁1 𝑃 𝑥|𝐶1 𝑃 𝐶1 𝑁1 + 𝑁2 𝑁1 𝑧 = 𝑙𝑛 + 𝑙𝑛 = 𝑃 𝑥|𝐶2 𝑃 𝐶2 𝑁2 𝑁2 𝑁1 + 𝑁2 1 1 1 1 𝑇 𝑃 𝑥|𝐶1 = 𝑒𝑥𝑝 − 𝑥 − 𝜇 Σ1 −1 𝑥 − 𝜇1 2𝜋 𝐷/2 Σ1 1/2 2 1 1 1 2 𝑇 𝑃 𝑥|𝐶2 = 𝑒𝑥𝑝 − 𝑥 − 𝜇 Σ2 −1 𝑥 − 𝜇2 2𝜋 𝐷/2 Σ 2 1/2 2


