- 快召唤伙伴们来围观吧
- 微博 QQ QQ空间 贴吧
- 文档嵌入链接
- <iframe src="https://www.slidestalk.com/u41/ride_hong_kong_baptist_university_kbifcm?embed" frame border="0" width="640" height="360" scrolling="no" allowfullscreen="true">复制
- 微信扫一扫分享
RIDE - Hong Kong Baptist University
展开查看详情
1 .Residue Iteration Decomposition (RIDE) Restoring latency-variable ERP components from single trials Sometimes we respond slow, sometimes fast Guang Ouyang Changsong Zhou Dept. Physics, Center for Nonlinear Studies, ICTS Hong Kong Baptist University Werner Sommer Department of Psychology Humboldt University Berlin, Germany Team: 2/18/2015 1 Intra-person & inter-person Variability: Difficulty for cognitive data analysis Opportunity for studying brain activity-function relation RIDE: Un-mix ERP components Restore ERP component shapes Get useful information about sub-process variability in single trials
2 .Outline Motivation: P roblems in ERP due to latency variability Alternative model for ERP : L atency variable components RIDE C omponent decomposition ERP reconstruction Single trial variability Comparison with ICA Applications of RIDE in neuropsychology Summary 2/18/2015 2
3 .How do ERP researchers deal with “noisy” EEG signal? ERP EEG (a) (b) average 50 μ V Stimulus onset ERP (Event-related Potential) 2/18/2015 3
4 .Averaging ERPs: Basic Idea 2/18/2015 4
5 .ERP components as p robes into cognitive stages Stage 1 Stage 2 Stage n Stimulus Response C 1 C n C 2 ERP- component 2/18/2015 5
6 .A A A A A A B B B B B B C C C C C C signal signal signal signal signal signal output output output output output output … … … … … … I dentical processes in each realization; Contradictory to strong response variability Assumption of averaging ERP implying… 0ms 1000ms 200ms 400ms 600ms 800ms 2/18/2015 6
7 .A lternative assumption about brain response A A A A A A B B B B B B C C C C C C signal signal signal signal signal signal output output output output output output … … … … … … 0ms 1000ms 200ms 400ms 600ms 800ms Latency jitters in each realization 2/18/2015 7
8 .Reality: systematic v ariability in the EEG data 2/18/2015 8 What is the consequence of latency variability on ERP? Sorting by RT
9 .Latency variability: Smearing effect (convolution) Generally, the convolution reduces the amplitude When the ‘spreading’ distribution is broad , the convolution approaches to zero 2/18/2015 9
10 .Stimulus . . . 1800 ms 0 ms 1800 ms 0 ms 1800 ms 0 ms 1800 ms 0 ms 1800 ms 0 ms Trial 1 Trial 2 Trial 3 Trial i Average ERP Limitations of average ERP method Smearing and mixing of components Limited precision of amplitude/latency and conditional effects Vague interpretation in mental chronometry Lose valuable single trial dynamic information A possible solution? 2/18/2015 10
11 .Stimulus . . . 1800 ms 0 ms 1800 ms 0 ms 1800 ms 0 ms 1800 ms 0 ms 1800 ms 0 ms Trial 1 Trial 2 Trial 3 Trial i Average ERP Reconstructed ERP RIDE Find latency-variable components Locate the latency in single trials Reconstruct latency-corrected ERP Improve understanding of brain-behavior relationship 2/18/2015 11
12 .A A A B B B C C C signal signal signal output output output … … … Alternative model of ERP: temporal superposition Previous attempts: (with all time markers known) Fourier decomposition Hansen, 1983 (low-frequency divergence) Takeda et al, 2008 (no asymmetry in R ) Iterative de-convolution Wordorff , 1993 Zhang, 1998 General Linear Model decomposition (least square-based) Dandekar , et al, 2012 Mathematically they are the same! ✘ Cannot deal with latency-unknown components ✘ Suffer from strong low-frequency distortion 2/18/2015 12
13 .2/18/2015 13 How does the single trials look like This is a single trial ERP data synchronized to stimulus onset and sorted by reaction time from a speech production data (from Oz). This is a very excellent data showing dissociated component clusters, but what if the components are serious overlapped? Stimulus locked component cluster S Response locked component cluster R Central component cluster C
14 .2/18/2015 14 How does the single trials look like This is a single trial ERP data synchronized to stimulus onset and sorted by reaction time from a speech production data (from Oz). Stimulus locked component cluster S Response locked component cluster R Central component cluster C ? ? ?
15 .2/18/2015 15 RIDE : basic framwork 3. R e-estimation of latency of C Remove S and R from single trials and estimate the latency of C by template matching between C and residue. 1. Initial estimation of latency of C 2. Decomposition Module Obtain S, C and R based on L s , L c and L R convergence
16 .2/18/2015 16 Latency for S Latency for C Latency for R RIDE : decomposition module Remove C and R from single trials get median of the residue for S Remove S and R from single trials get median of the residue for C Remove S and C from single trials get median of the residue for R Initially set S= C = R=0
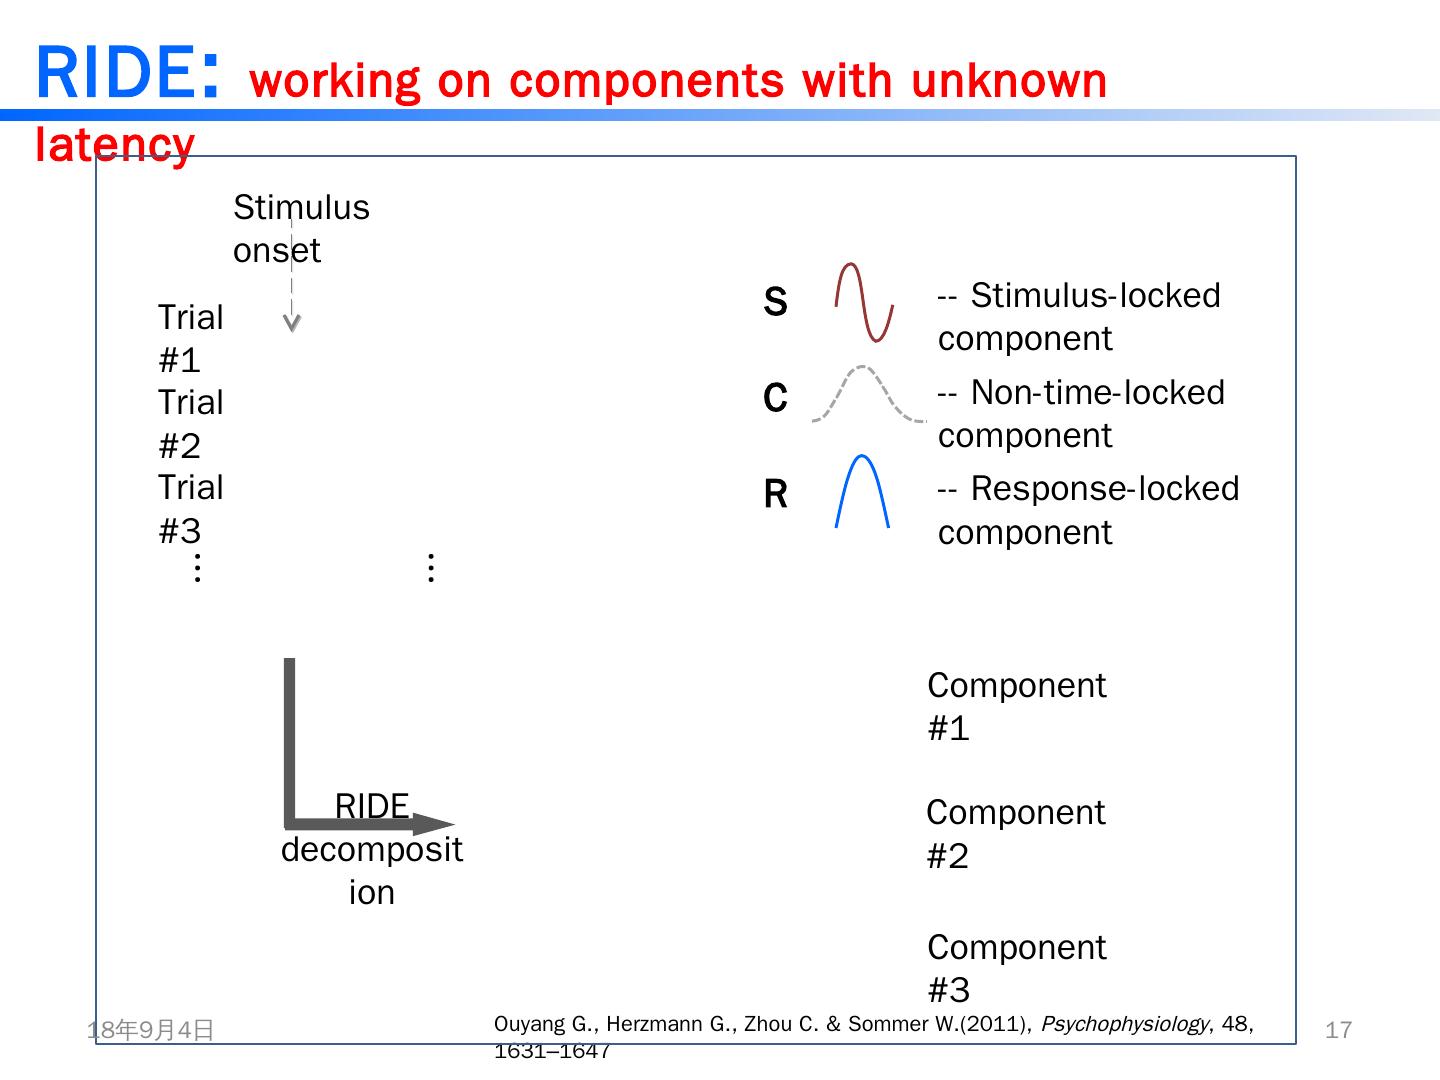
17 .RIDE : working on components with unknown latency Ouyang G., Herzmann G., Zhou C. & Sommer W.(2011), Psychophysiology , 48, 1631–1647 Trial #1 Trial #2 Trial #3 Stimulus onset Component #1 Component #3 … … RIDE decomposition Component #2 -- Stimulus-locked component -- Response-locked component -- Non-time-locked component S C R 2/18/2015 17
18 .RIDE : solving distortion problem Instead of using average in the iteration, we used median Novelty of RIDE Median based Numerical iteration (prevent distortion) Estimate unknown latency Hansen, 1983 Zhang, 1998 Takeda et al., 2008 D andekar et al., 2012 … 2/18/2015 18
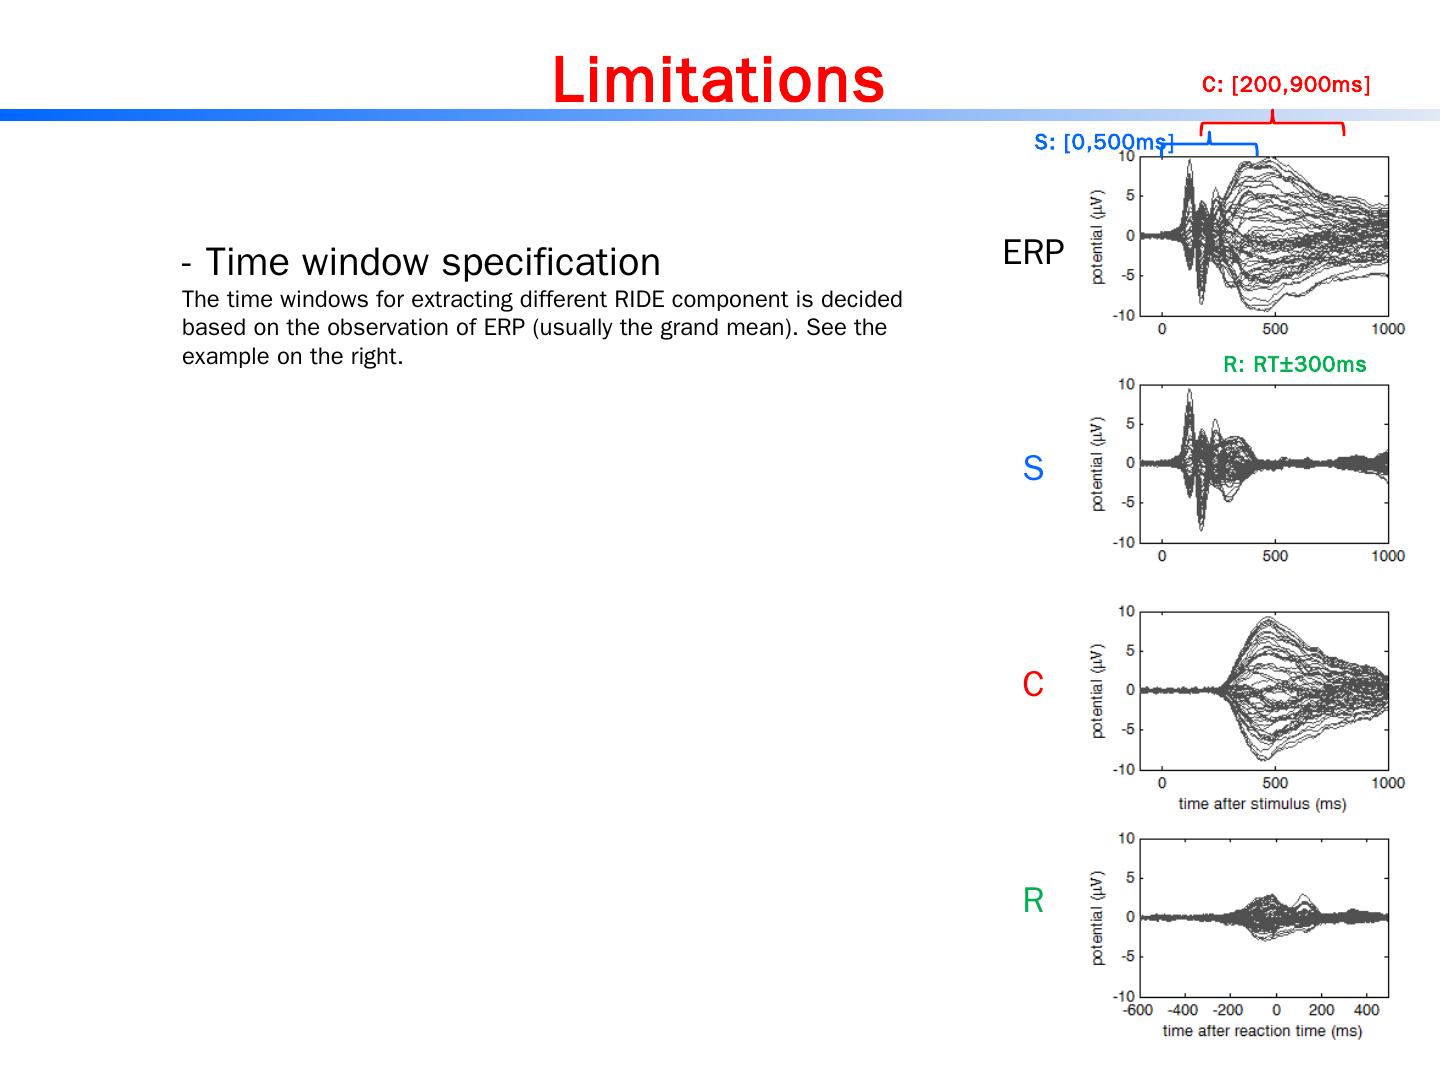
19 .RIDE : Typical assumptions in applications 2/18/2015 19 This coincides with the assumption that the brain response goes through several stages, e.g., * RIDE is also Extendable to experiments without response markers: Nogo (S+C), Language (S+N400+P600) Stimulus-locked component cluster S Latency-variable central component cluster C Response-locked component cluster R Single trials S Decomposition … C R Average ERP RIDE assumes:
20 .RIDE Outcome : ERP component decomposition: 2/18/2015 20 C R Consistency across subjects G rand mean ERP S C R *This figure is from the earliest RIDE algorithm, Ouyang et al. 2011
21 .2/18/2015 21 RIDE Outcome : ERP re-construction--method t rial #1: t rial #2: t rial #3: t rial #n: . . . Blurred ERP c omponent 1 c omponent 2 c omponent 3 Decomposition Reconstruction Reconstructed ERP wave form: most probably observable in single trials Put at the most probable latency
22 .2/18/2015 22 RIDE Outcome : ERP re-construction: real data
23 .2/18/2015 23 RIDE Outcome : ERP re-construction: conditional effects To solve the smearing effect due to latency variability Cond. 1 Cond. 2 Case I1. Latency variability reduces the amplitude effect Case I2. Different latency variability makes to amplitude effect
24 .2/18/2015 24 RIDE Outcome: conditional effects in re-constructed ERP
25 .2/19/2015 25 Rectified conditional effect in language processing RIDE Outcome: conditional effects in re-constructed ERP Wang Fang et al., 2015
26 .2/18/2015 26 Does RIDE find artificial effect? - No To test it, we randomly divided ERP dataset into two groups. In this case, there is not supposed to be significant conditional effects between the two groups. We did this permutation for 100000 times, and did t test. If RIDE finds more fake effects, the t distribution should be broader, as compared to standard ERP(see left). However they are identical (see right) t distribution Standard ERP Re- ERP
27 .2/18/2015 27 Does RIDE find artificial effect? - No Another test: We generated 100000 set of data simulated by pink noise (1/f). 2 conditions and 20 subjects. In this simulation: The number of finding p<0.05 effect is 4981 out of 100000 (4 . 981%) The number of finding p<0.01 effect is 956 out of 100000 (0.956%) * Note: the two values above may change in other simulation but will be still extremely close to the threshold - > From noise, RIDE does not find an effect with probability higher than chance.
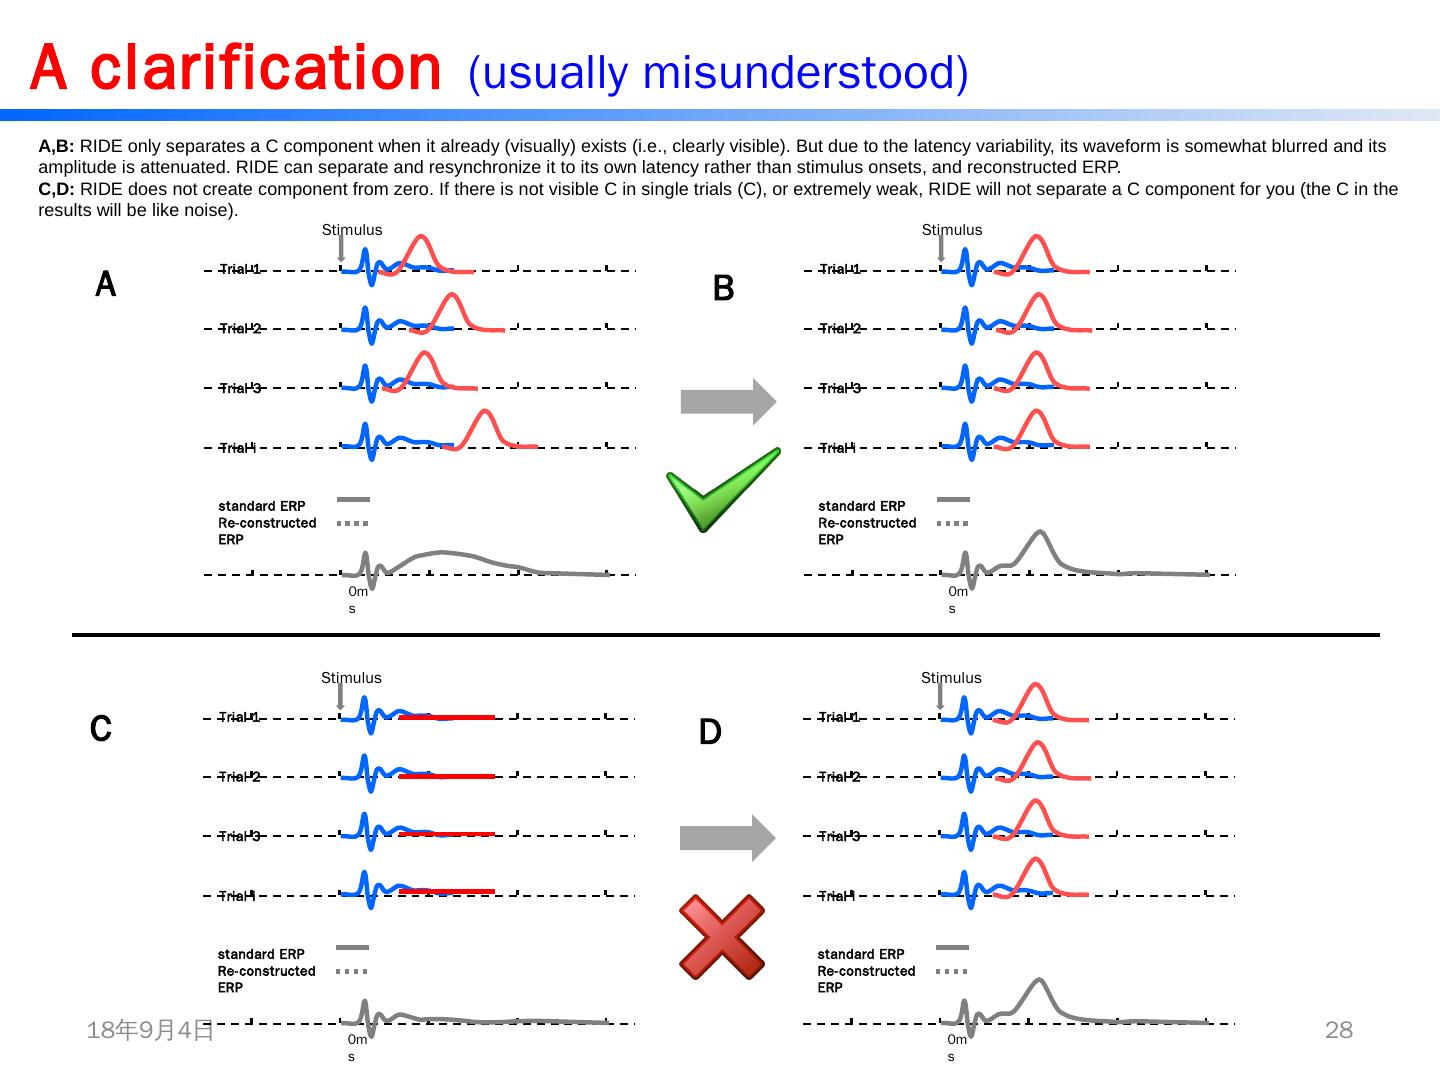
28 .2/19/2015 28 A clarification (usually misunderstood) Stimulus 0 ms Trial 1 Trial 2 Trial 3 Trial i standard ERP Re-constructed ERP Stimulus 0 ms Trial 1 Trial 2 Trial 3 Trial i standard ERP Re-constructed ERP Stimulus 0 ms Trial 1 Trial 2 Trial 3 Trial i standard ERP Re-constructed ERP Stimulus 0 ms Trial 1 Trial 2 Trial 3 Trial i standard ERP Re-constructed ERP A,B: RIDE only separates a C component when it already (visually) exists (i.e., clearly visible). But due to the latency variability, its waveform is somewhat blurred and its amplitude is attenuated. RIDE can separate and resynchronize it to its own latency rather than stimulus onsets , and reconstructed ERP . C,D: RIDE does not create component from zero. If there is not visible C in single trials (C), or extremely weak, RIDE will not separate a C component for you (the C in the results will be lik e noise). A B C D
29 .2/18/2015 29 C is clearly visible in the standard ERP (usually a clear hump) If a ‘C’ is not even visible from standard ERP, then RIDE might not be able to extract it. C1 C2 RIDE restores component (from blurring), not creates components. A clarification (usually misunderstood) Examples


