- 快召唤伙伴们来围观吧
- 微博 QQ QQ空间 贴吧
- 文档嵌入链接
- <iframe src="https://www.slidestalk.com/u5174/lec21_Disks_Block?embed" frame border="0" width="640" height="360" scrolling="no" allowfullscreen="true">复制
- 微信扫一扫分享
Disks and FLASH Queueing Theory
展开查看详情
1 . Goals for Today CS194-24 • Disk Drives Advanced Operating Systems • FLASH and Alternatives Structures and Implementation • Queueing Theory Lecture 21 Disks and FLASH Queueing Theory Interactive is important! Ask Questions! April 21st, 2014 Prof. John Kubiatowicz http://inst.eecs.berkeley.edu/~cs194-24 Note: Some slides and/or pictures in the following are adapted from slides ©2013 4/21/14 Kubiatowicz CS194-24 ©UCB Fall 2014 Lec 21.2 Recall: Hard Disk Drives Recall: Properties of a Hard Disk Track Sector Sector Head Cylinder Track Platter • Properties – Head moves in to address circular track of information Read/Write Head – Independently addressable element: sector Side View » OS always transfers groups of sectors together—”blocks” – Items addressable without moving head: cylinder – A disk can be rewritten in place: it is possible to read/modify/write a block from the disk • Typical numbers (depending on the disk size): – 500 to more than 20,000 tracks per surface Western Digital Drive – 32 to 800 sectors per track http://www.storagereview.com/guide/ • Zoned bit recording – Constant bit density: more sectors on outer tracks IBM/Hitachi Microdrive – Speed varies with track location 4/21/14 Kubiatowicz CS194-24 ©UCB Fall 2014 Lec 21.3 4/21/14 Kubiatowicz CS194-24 ©UCB Fall 2014 Lec 21.4
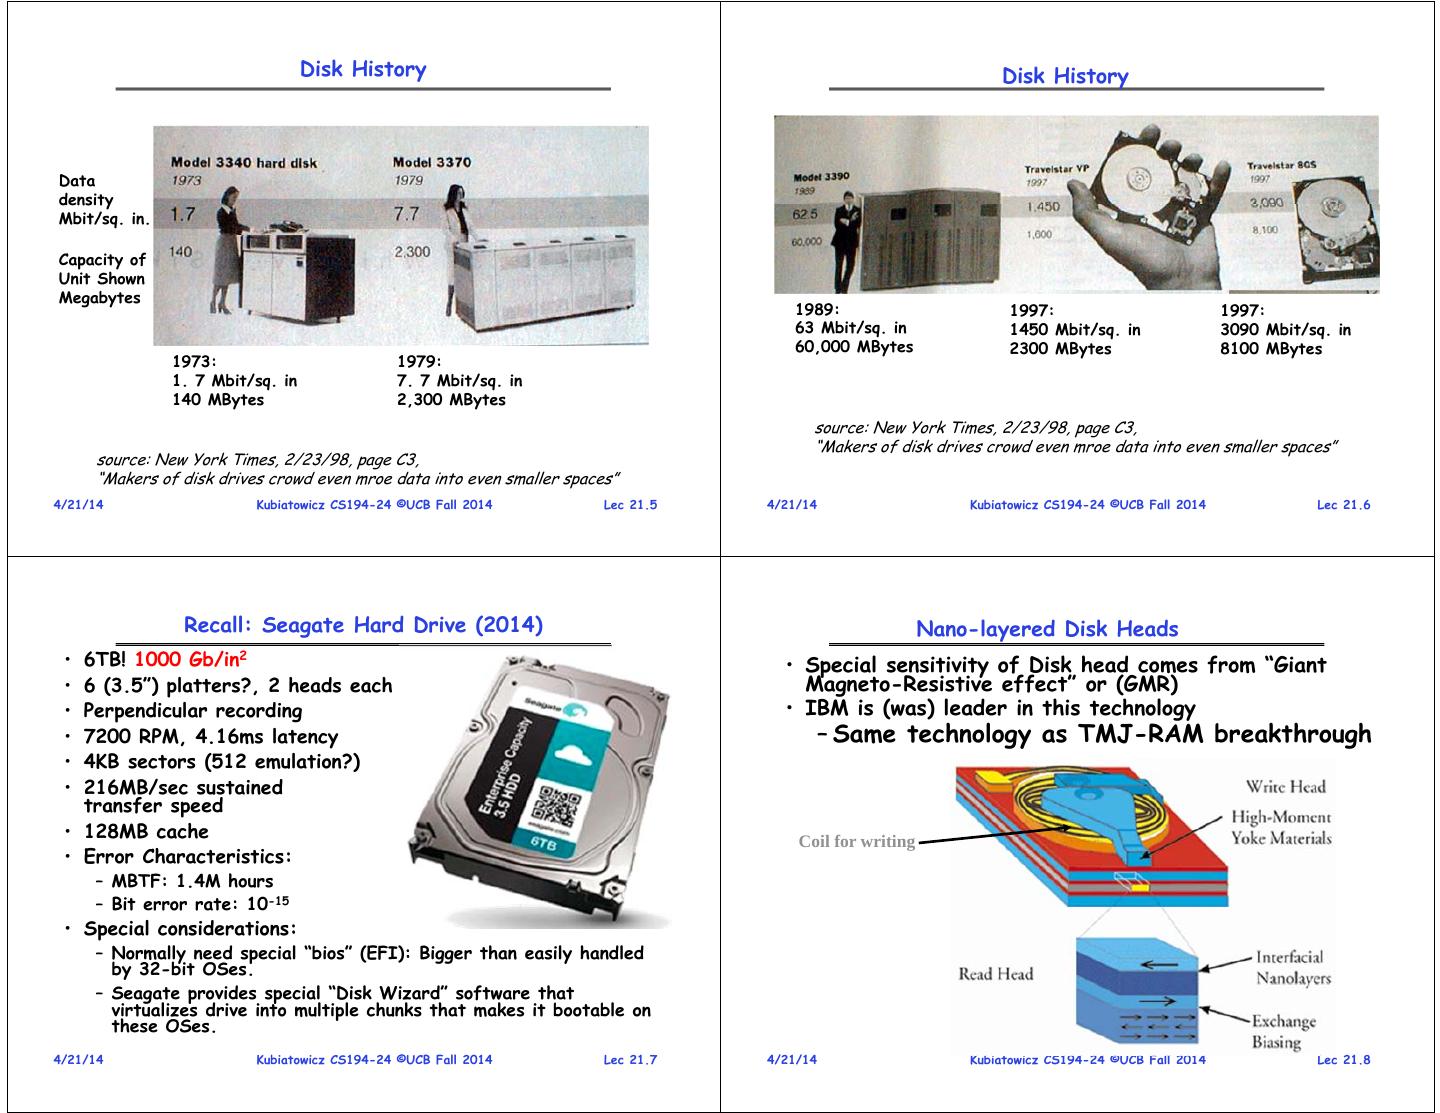
2 . Disk History Disk History Data density Mbit/sq. in. Capacity of Unit Shown Megabytes 1989: 1997: 1997: 63 Mbit/sq. in 1450 Mbit/sq. in 3090 Mbit/sq. in 60,000 MBytes 2300 MBytes 8100 MBytes 1973: 1979: 1. 7 Mbit/sq. in 7. 7 Mbit/sq. in 140 MBytes 2,300 MBytes source: New York Times, 2/23/98, page C3, “Makers of disk drives crowd even mroe data into even smaller spaces” source: New York Times, 2/23/98, page C3, “Makers of disk drives crowd even mroe data into even smaller spaces” 4/21/14 Kubiatowicz CS194-24 ©UCB Fall 2014 Lec 21.5 4/21/14 Kubiatowicz CS194-24 ©UCB Fall 2014 Lec 21.6 Recall: Seagate Hard Drive (2014) Nano-layered Disk Heads • 6TB! 1000 Gb/in2 • Special sensitivity of Disk head comes from “Giant • 6 (3.5”) platters?, 2 heads each Magneto-Resistive effect” or (GMR) • Perpendicular recording • IBM is (was) leader in this technology • 7200 RPM, 4.16ms latency – Same technology as TMJ-RAM breakthrough • 4KB sectors (512 emulation?) • 216MB/sec sustained transfer speed • 128MB cache Coil for writing • Error Characteristics: – MBTF: 1.4M hours – Bit error rate: 10-15 • Special considerations: – Normally need special “bios” (EFI): Bigger than easily handled by 32-bit OSes. – Seagate provides special “Disk Wizard” software that virtualizes drive into multiple chunks that makes it bootable on these OSes. 4/21/14 Kubiatowicz CS194-24 ©UCB Fall 2014 Lec 21.7 4/21/14 Kubiatowicz CS194-24 ©UCB Fall 2014 Lec 21.8
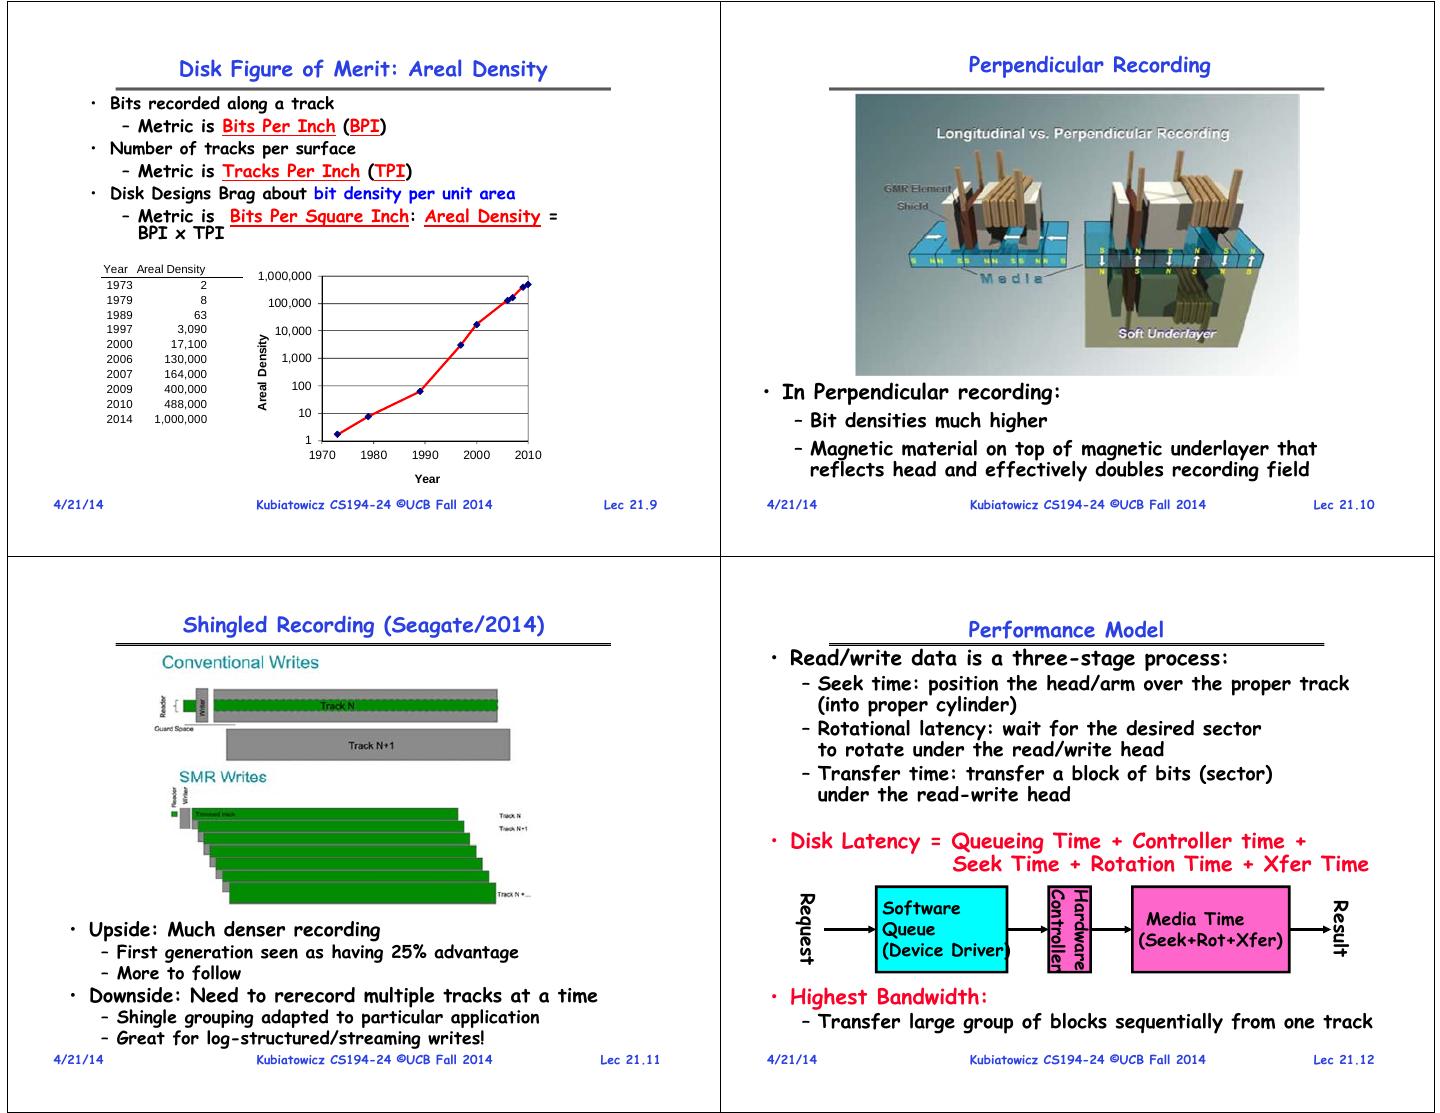
3 . Disk Figure of Merit: Areal Density Perpendicular Recording • Bits recorded along a track – Metric is Bits Per Inch (BPI) • Number of tracks per surface – Metric is Tracks Per Inch (TPI) • Disk Designs Brag about bit density per unit area – Metric is Bits Per Square Inch: Areal Density = BPI x TPI Year Areal Density 1,000,000 1973 2 1979 8 100,000 1989 63 1997 3,090 10,000 Areal Density 2000 17,100 2006 130,000 1,000 2007 164,000 2009 2010 400,000 488,000 100 • In Perpendicular recording: – Bit densities much higher 2014 1,000,000 10 – Magnetic material on top of magnetic underlayer that 1 1970 1980 1990 2000 2010 Year reflects head and effectively doubles recording field 4/21/14 Kubiatowicz CS194-24 ©UCB Fall 2014 Lec 21.9 4/21/14 Kubiatowicz CS194-24 ©UCB Fall 2014 Lec 21.10 Shingled Recording (Seagate/2014) Performance Model • Read/write data is a three-stage process: – Seek time: position the head/arm over the proper track (into proper cylinder) – Rotational latency: wait for the desired sector to rotate under the read/write head – Transfer time: transfer a block of bits (sector) under the read-write head • Disk Latency = Queueing Time + Controller time + Seek Time + Rotation Time + Xfer Time Controller Hardware Request Software Result Media Time • Upside: Much denser recording Queue (Seek+Rot+Xfer) – First generation seen as having 25% advantage (Device Driver) – More to follow • Downside: Need to rerecord multiple tracks at a time • Highest Bandwidth: – Shingle grouping adapted to particular application – Transfer large group of blocks sequentially from one track – Great for log-structured/streaming writes! 4/21/14 Kubiatowicz CS194-24 ©UCB Fall 2014 Lec 21.11 4/21/14 Kubiatowicz CS194-24 ©UCB Fall 2014 Lec 21.12
4 . Typical Numbers of a Magnetic Disk Example: Disk Performance • Average seek time as reported by the industry: • Question: How long does it take to fetch 1 Kbyte sector? – Typically in the range of 4 ms to 12 ms • Assumptions: – Locality of reference may only be 25% to 33% of the advertised number – Ignoring queuing and controller times for now • Rotational Latency: – Avg seek time of 5ms, avg rotational delay of 4ms – Most disks rotate at 3,600 to 7200 RPM (Up to 15,000RPM – Transfer rate of 4MByte/s, sector size of 1 KByte or more) • Random place on disk: – Approximately 16 ms to 8 ms per revolution, respectively – Seek (5ms) + Rot. Delay (4ms) + Transfer (0.25ms) – An average latency to the desired information is halfway around the disk: 8 ms at 3600 RPM, 4 ms at 7200 RPM – Roughly 10ms to fetch/put data: 100 KByte/sec • Transfer Time is a function of: • Random place in same cylinder: – Transfer size (usually a sector): 512B – 1KB per sector – Rot. Delay (4ms) + Transfer (0.25ms) – Rotation speed: 3600 RPM to 15000 RPM – Roughly 5ms to fetch/put data: 200 KByte/sec – Recording density: bits per inch on a track • Next sector on same track: – Diameter: ranges from 1 in to 5.25 in – Transfer (0.25ms): 4 MByte/sec – Typical values: up to 216 MB per second (sustained) • Key to using disk effectively (esp. for filesystems) is to • Controller time depends on controller hardware minimize seek and rotational delays 4/21/14 Kubiatowicz CS194-24 ©UCB Fall 2014 Lec 21.13 4/21/14 Kubiatowicz CS194-24 ©UCB Fall 2014 Lec 21.14 Disk Scheduling Linux Block Layer (Love Book, Ch 14) • Disk can do only one request at a time; What order do • Linux Block Layer you choose to do queued requests? VFS – Generic support for block- oriented devices User 2,2 5,2 7,2 3,10 2,1 2,3 Head – Page Cache may hold data Requests Disk items Caches • FIFO Order » On read, cache filled – Fair among requesters, but order of arrival may be to » On write, cache filled random spots on the disk Very long seeks before write occurs Disk Disk Block – Mapping layer • SSTF: Shortest seek time first Disk Head Filesystem Filesystem Device File » Determines where physical – Pick the request that’s closest on the disk 3 blocks stored – Although called SSTF, today must include Mapping Layer rotational delay in calculation, since 2 – Generic Block Layer rotation can be as long as seek 1 » Presents abstracted view of block device – Con: SSTF good at reducing seeks, but Generic Block Layer 4 » Ops represented by Block may lead to starvation I/O (“bio”) structures • SCAN: Implements an Elevator Algorithm: take the I/O Scheduler Layer – I/O Scheduler closest request in the direction of travel » Orders requests based on – No starvation, but retains flavor of SSTF pre-defined policies • C-SCAN: Circular-Scan: only goes in one direction Block Block – Block Device Driver – Skips any requests on the way back Device Device » Device-specific control – Fairer than SCAN, not biased towards pages in middle Driver Driver 4/21/14 Kubiatowicz CS194-24 ©UCB Fall 2014 Lec 21.15 4/21/14 Kubiatowicz CS194-24 ©UCB Fall 2014 Lec 21.16
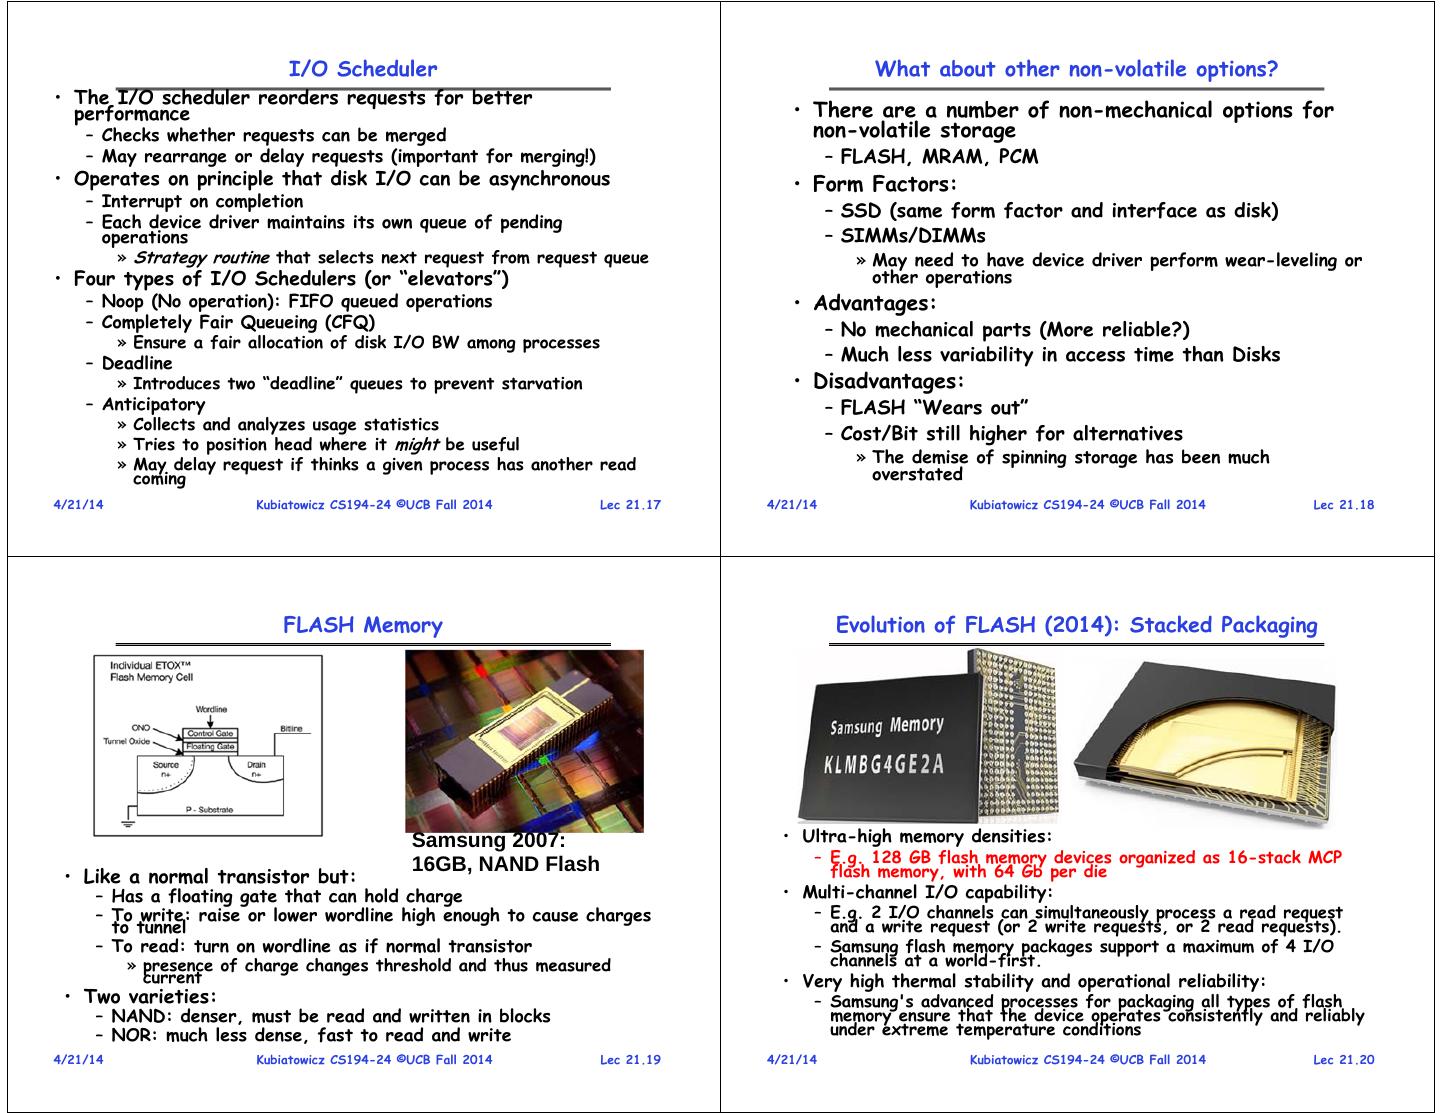
5 . I/O Scheduler What about other non-volatile options? • The I/O scheduler reorders requests for better performance • There are a number of non-mechanical options for – Checks whether requests can be merged non-volatile storage – May rearrange or delay requests (important for merging!) – FLASH, MRAM, PCM • Operates on principle that disk I/O can be asynchronous • Form Factors: – Interrupt on completion – SSD (same form factor and interface as disk) – Each device driver maintains its own queue of pending operations – SIMMs/DIMMs » Strategy routine that selects next request from request queue » May need to have device driver perform wear-leveling or • Four types of I/O Schedulers (or “elevators”) other operations – Noop (No operation): FIFO queued operations • Advantages: – Completely Fair Queueing (CFQ) – No mechanical parts (More reliable?) » Ensure a fair allocation of disk I/O BW among processes – Deadline – Much less variability in access time than Disks » Introduces two “deadline” queues to prevent starvation • Disadvantages: – Anticipatory – FLASH “Wears out” » Collects and analyzes usage statistics – Cost/Bit still higher for alternatives » Tries to position head where it might be useful » May delay request if thinks a given process has another read » The demise of spinning storage has been much coming overstated 4/21/14 Kubiatowicz CS194-24 ©UCB Fall 2014 Lec 21.17 4/21/14 Kubiatowicz CS194-24 ©UCB Fall 2014 Lec 21.18 FLASH Memory Evolution of FLASH (2014): Stacked Packaging Samsung 2007: • Ultra-high memory densities: 16GB, NAND Flash – E.g. 128 GB flash memory devices organized as 16-stack MCP • Like a normal transistor but: flash memory, with 64 Gb per die – Has a floating gate that can hold charge • Multi-channel I/O capability: – To write: raise or lower wordline high enough to cause charges – E.g. 2 I/O channels can simultaneously process a read request to tunnel and a write request (or 2 write requests, or 2 read requests). – To read: turn on wordline as if normal transistor – Samsung flash memory packages support a maximum of 4 I/O » presence of charge changes threshold and thus measured channels at a world-first. current • Very high thermal stability and operational reliability: • Two varieties: – Samsung's advanced processes for packaging all types of flash – NAND: denser, must be read and written in blocks memory ensure that the device operates consistently and reliably – NOR: much less dense, fast to read and write under extreme temperature conditions 4/21/14 Kubiatowicz CS194-24 ©UCB Fall 2014 Lec 21.19 4/21/14 Kubiatowicz CS194-24 ©UCB Fall 2014 Lec 21.20
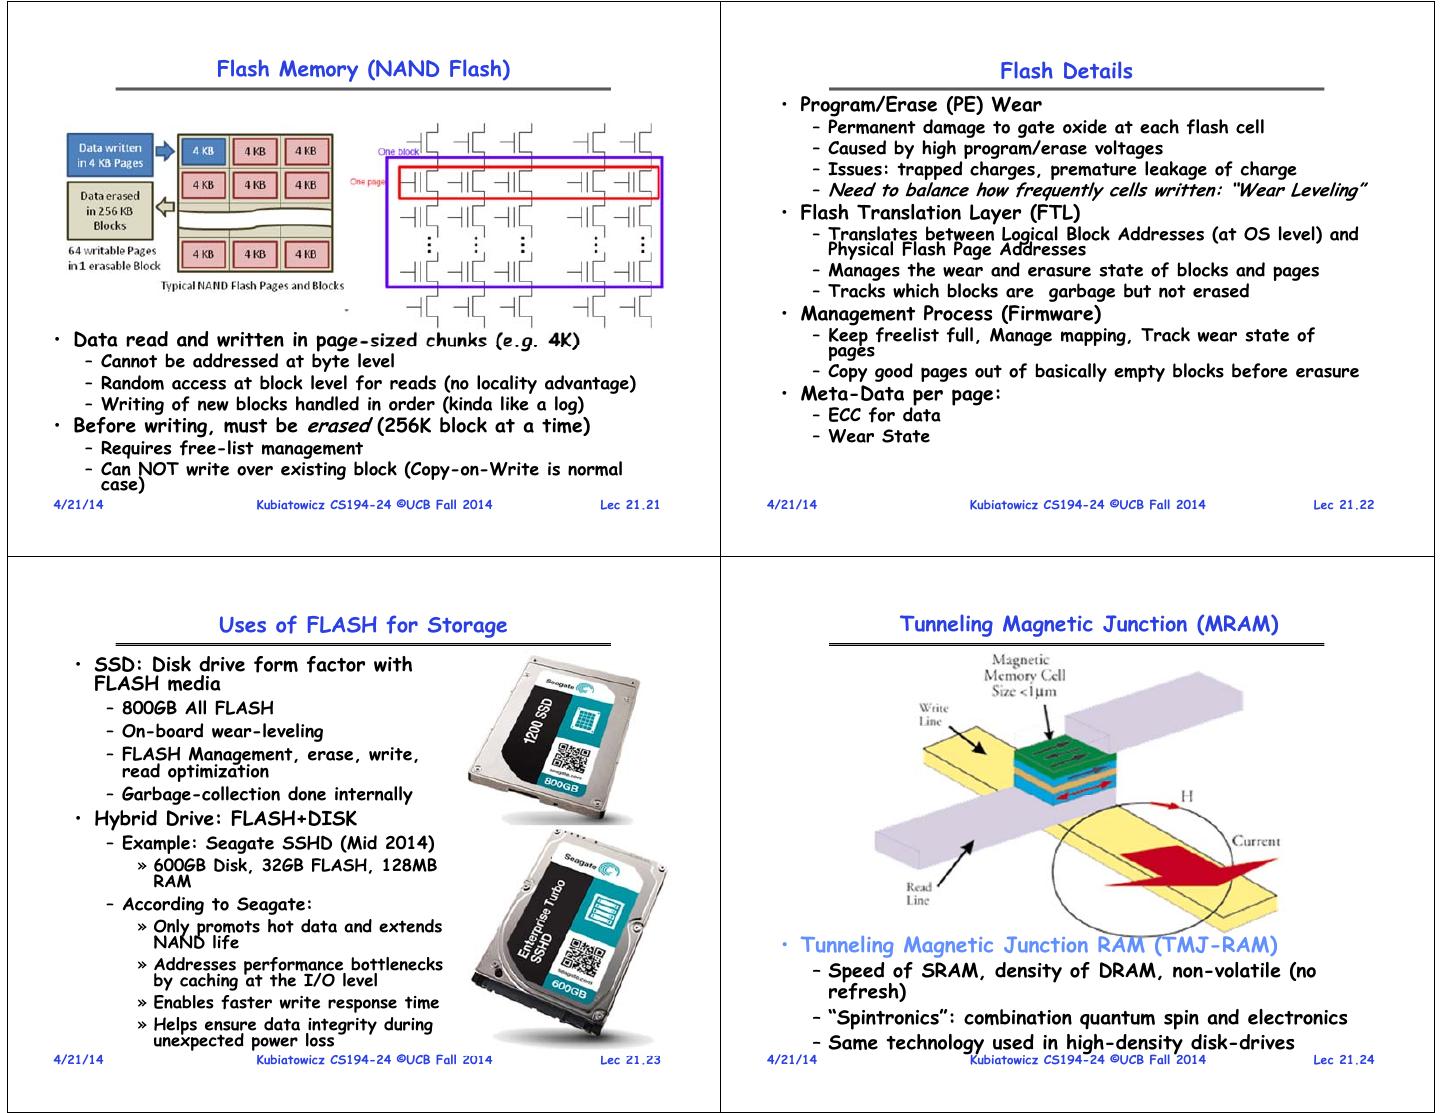
6 . Flash Memory (NAND Flash) Flash Details • Program/Erase (PE) Wear – Permanent damage to gate oxide at each flash cell – Caused by high program/erase voltages – Issues: trapped charges, premature leakage of charge Need to balance how frequently cells written: “Wear Leveling” – • Flash Translation Layer (FTL) – Translates between Logical Block Addresses (at OS level) and Physical Flash Page Addresses – Manages the wear and erasure state of blocks and pages – Tracks which blocks are garbage but not erased • Management Process (Firmware) • Data read and written in page-sized chunks (e.g. 4K) – Keep freelist full, Manage mapping, Track wear state of pages – Cannot be addressed at byte level – Copy good pages out of basically empty blocks before erasure – Random access at block level for reads (no locality advantage) – Writing of new blocks handled in order (kinda like a log) • Meta-Data per page: – ECC for data • Before writing, must be erased (256K block at a time) – Wear State – Requires free-list management – Can NOT write over existing block (Copy-on-Write is normal case) 4/21/14 Kubiatowicz CS194-24 ©UCB Fall 2014 Lec 21.21 4/21/14 Kubiatowicz CS194-24 ©UCB Fall 2014 Lec 21.22 Uses of FLASH for Storage Tunneling Magnetic Junction (MRAM) • SSD: Disk drive form factor with FLASH media – 800GB All FLASH – On-board wear-leveling – FLASH Management, erase, write, read optimization – Garbage-collection done internally • Hybrid Drive: FLASH+DISK – Example: Seagate SSHD (Mid 2014) » 600GB Disk, 32GB FLASH, 128MB RAM – According to Seagate: » Only promots hot data and extends NAND life • Tunneling Magnetic Junction RAM (TMJ-RAM) » Addresses performance bottlenecks – Speed of SRAM, density of DRAM, non-volatile (no by caching at the I/O level refresh) » Enables faster write response time » Helps ensure data integrity during – “Spintronics”: combination quantum spin and electronics unexpected power loss – Same technology used in high-density disk-drives 4/21/14 Kubiatowicz CS194-24 ©UCB Fall 2014 Lec 21.23 4/21/14 Kubiatowicz CS194-24 ©UCB Fall 2014 Lec 21.24
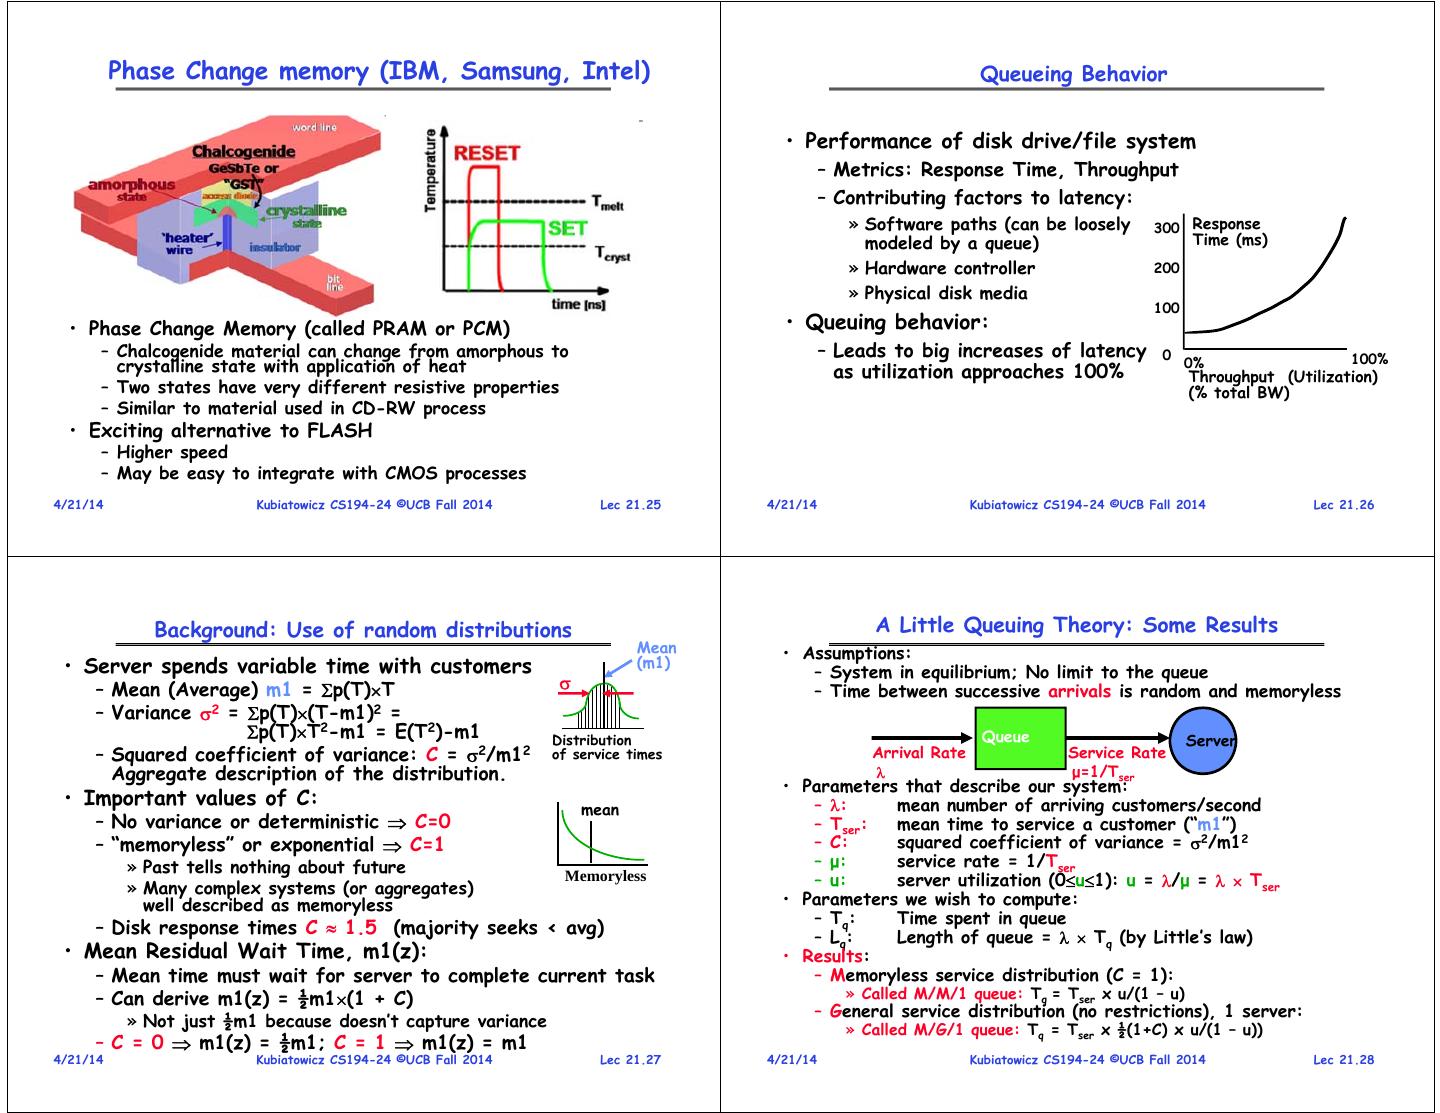
7 . Phase Change memory (IBM, Samsung, Intel) Queueing Behavior • Performance of disk drive/file system – Metrics: Response Time, Throughput – Contributing factors to latency: » Software paths (can be loosely 300 Response modeled by a queue) Time (ms) » Hardware controller 200 » Physical disk media 100 • Phase Change Memory (called PRAM or PCM) • Queuing behavior: – Chalcogenide material can change from amorphous to – Leads to big increases of latency 0 100% crystalline state with application of heat as utilization approaches 100% 0% Throughput (Utilization) – Two states have very different resistive properties (% total BW) – Similar to material used in CD-RW process • Exciting alternative to FLASH – Higher speed – May be easy to integrate with CMOS processes 4/21/14 Kubiatowicz CS194-24 ©UCB Fall 2014 Lec 21.25 4/21/14 Kubiatowicz CS194-24 ©UCB Fall 2014 Lec 21.26 Background: Use of random distributions A Little Queuing Theory: Some Results Mean • Assumptions: • Server spends variable time with customers (m1) – System in equilibrium; No limit to the queue – Mean (Average) m1 = p(T)T – Time between successive arrivals is random and memoryless – Variance 2 = p(T)(T-m1)2 = p(T)T2-m1 = E(T2)-m1 Distribution Queue Server – Squared coefficient of variance: C = 2/m12 of service times Arrival Rate Service Rate Aggregate description of the distribution. μ=1/Tser • Parameters that describe our system: • Important values of C: mean – : mean number of arriving customers/second – No variance or deterministic C=0 – Tser: mean time to service a customer (“m1”) – “memoryless” or exponential C=1 – C: squared coefficient of variance = 2/m12 » Past tells nothing about future – μ: service rate = 1/Tser » Many complex systems (or aggregates) Memoryless – u: server utilization (0u1): u = /μ = Tser well described as memoryless • Parameters we wish to compute: – Tq: Time spent in queue – Disk response times C 1.5 (majority seeks < avg) – Lq: Length of queue = Tq (by Little’s law) • Mean Residual Wait Time, m1(z): • Results: – Mean time must wait for server to complete current task – Memoryless service distribution (C = 1): – Can derive m1(z) = ½m1(1 + C) » Called M/M/1 queue: Tq = Tser x u/(1 – u) – General service distribution (no restrictions), 1 server: » Not just ½m1 because doesn’t capture variance » Called M/G/1 queue: Tq = Tser x ½(1+C) x u/(1 – u)) – C = 0 m1(z) = ½m1; C = 1 m1(z) = m1 4/21/14 Kubiatowicz CS194-24 ©UCB Fall 2014 Lec 21.27 4/21/14 Kubiatowicz CS194-24 ©UCB Fall 2014 Lec 21.28
8 . A Little Queuing Theory: An Example Summary • Example Usage Statistics: – User requests 10 8KB disk I/Os per second • Disk Storage: Cylinders, Tracks, Sectors – Requests & service exponentially distributed (C=1.0) – Access Time: 4-12ms – Avg. service = 20 ms (controller+seek+rot+Xfertime) • Questions: – Rotational Velocity: 3600—15000 – How utilized is the disk? – Transfer Speed: Up to 200MB/sec » Ans: server utilization, u = Tser – What is the average time spent in the queue? • Disk Time = » Ans: Tq queue + controller + seek + rotate + transfer – What is the number of requests in the queue? » Ans: Lq = Tq • Advertised average seek time benchmark much – What is the avg response time for disk request? greater than average seek time in practice » Ans: Tsys = Tq + Tser (Wait in queue, then get served) • Computation: • Other Non-volatile memories (avg # arriving customers/s) = 10/s – FLASH: packaged as SSDs or Raw SIMMs Tser (avg time to service customer) = 20 ms (0.02s) u (server utilization) = Tser= 10/s .02s = 0.2 – MRAM, PCM, other options Tq (avg time/customer in queue) = Tser u/(1 – u) 1 1 C x u = 20 x 0.2/(1-0.2) = 20 0.25 = 5 ms (0 .005s) • Queueing theory: W 2 for (c=1): xu W Lq (avg length of queue) = Tq=10/s .005s = 0.05 1 u 1 u Tsys (avg time/customer in system) =Tq + Tser= 25 ms 4/21/14 Kubiatowicz CS194-24 ©UCB Fall 2014 Lec 21.29 4/21/14 Kubiatowicz CS194-24 ©UCB Fall 2014 Lec 21.30


