- 快召唤伙伴们来围观吧
- 微博 QQ QQ空间 贴吧
- 文档嵌入链接
- <iframe src="https://www.slidestalk.com/u70/confluo_paper?embed" frame border="0" width="640" height="360" scrolling="no" allowfullscreen="true">复制
- 微信扫一扫分享
Confluo
展开查看详情
1 . Confluo: Distributed Monitoring and Diagnosis Stack for High-speed Networks Anurag Khandelwal Rachit Agarwal Ion Stoica UC Berkeley Cornell University UC Berkeley Abstract them for monitoring and diagnosis purposes, however, we Confluo is an end-host stack that can be integrated with need end-host stacks that can support: existing network management tools to enable monitoring • monitoring of rich telemetry data embedded in packet and diagnosis of network-wide events using telemetry data headers, e.g., packet trajectory [7–11], queue lengths [1, distributed across end-hosts, even for high-speed networks. 10], ingress and egress timestamps [10], etc. (§2.2); Confluo achieves these properties using a new data struc- ture — Atomic MultiLog— that supports highly-concurrent • low-overhead diagnosis of network events by network read-write operations by exploiting two properties specific operator, using header logs distributed across end-hosts; to telemetry data: (1) once processed by the stack, the data • highly-concurrent low-overhead read-write operations is neither updated nor deleted; and (2) each field in the data for capturing headers, and for using the header logs for has a fixed pre-defined size. Our evaluation results show that, monitoring and diagnosis purposes using minimal CPU for packet sizes 128B or larger, Confluo executes thousands resources. The challenge here is that, depending on packet of triggers and tens of filters at line rate (for 10Gbps links) sizes, monitoring headers at line rate even for 10Gbps using a single core. links requires 0.9-16 million operations per second! 1 Introduction Unfortunately, end-host monitoring and diagnosis stacks Recent years have witnessed tremendous progress on (the have not kept up with advances in programmable hardware notoriously hard problem of) network monitoring and diag- and are unable to simultaneously support these three func- nosis by exploiting programmable network hardware [1–18]. tionalities (§2.1, §6). Existing stacks that support monitoring This progress has been along two complementary dimen- of rich telemetry data (e.g., OpenSOC [19], Tigon [20], Gi- sions. First, elegant data structures and interfaces have been gascope [21], Tribeca [22] and PathDump [8]) use general- designed that enable capturing increasingly rich telemetry purpose streaming and time-series data processing systems; data at network switches [1–6,10,13–17]. On the other hand, we show in §2.1 that these systems are unable to sustain the recent work [6–12] has shown that capitalizing on the bene- target throughput even for 10Gbps links. This limitation has fits of above data structures and interfaces does not need to motivated design of stacks (e.g., Trumpet [23]) that can mon- be gated upon the availability of network switches with large itor traffic at 10Gbps using a single core, but only by limiting data plane resources — switches can store a small amount the functionality — they do not support monitoring of even of state to enable in-network visibility, and can embed rich basic telemetry data like packet trajectory and queue lengths; telemetry data in the packet headers; individual end-hosts we discuss in §2.1 that this is in fact a fundamental design monitor local packet header logs for monitoring spurious constraint in these stacks. network events. When a spurious network event is triggered, Confluo is an end-host stack, designed and optimized for network operator can diagnose the root cause of the event high-speed networks, that can be integrated with existing using switch state along with packet header logs distributed network management tools to enable monitoring and diagno- across end-hosts [7–10]. sis of network-wide events using telemetry data distributed Programmable switches have indeed been the enabling across end-hosts. Confluo simultaneously supports the above factor for this progress — on design and implementation of three functionalities by exploiting two properties specific to novel interfaces to collect increasingly rich telemetry data, telemetry data and applications. First, telemetry data has a and on flexible packet processing to embed this data into the special structure: once headers are processed in the stack, packet headers. To collect these packet headers and to use these headers are not updated and are only aggregated over
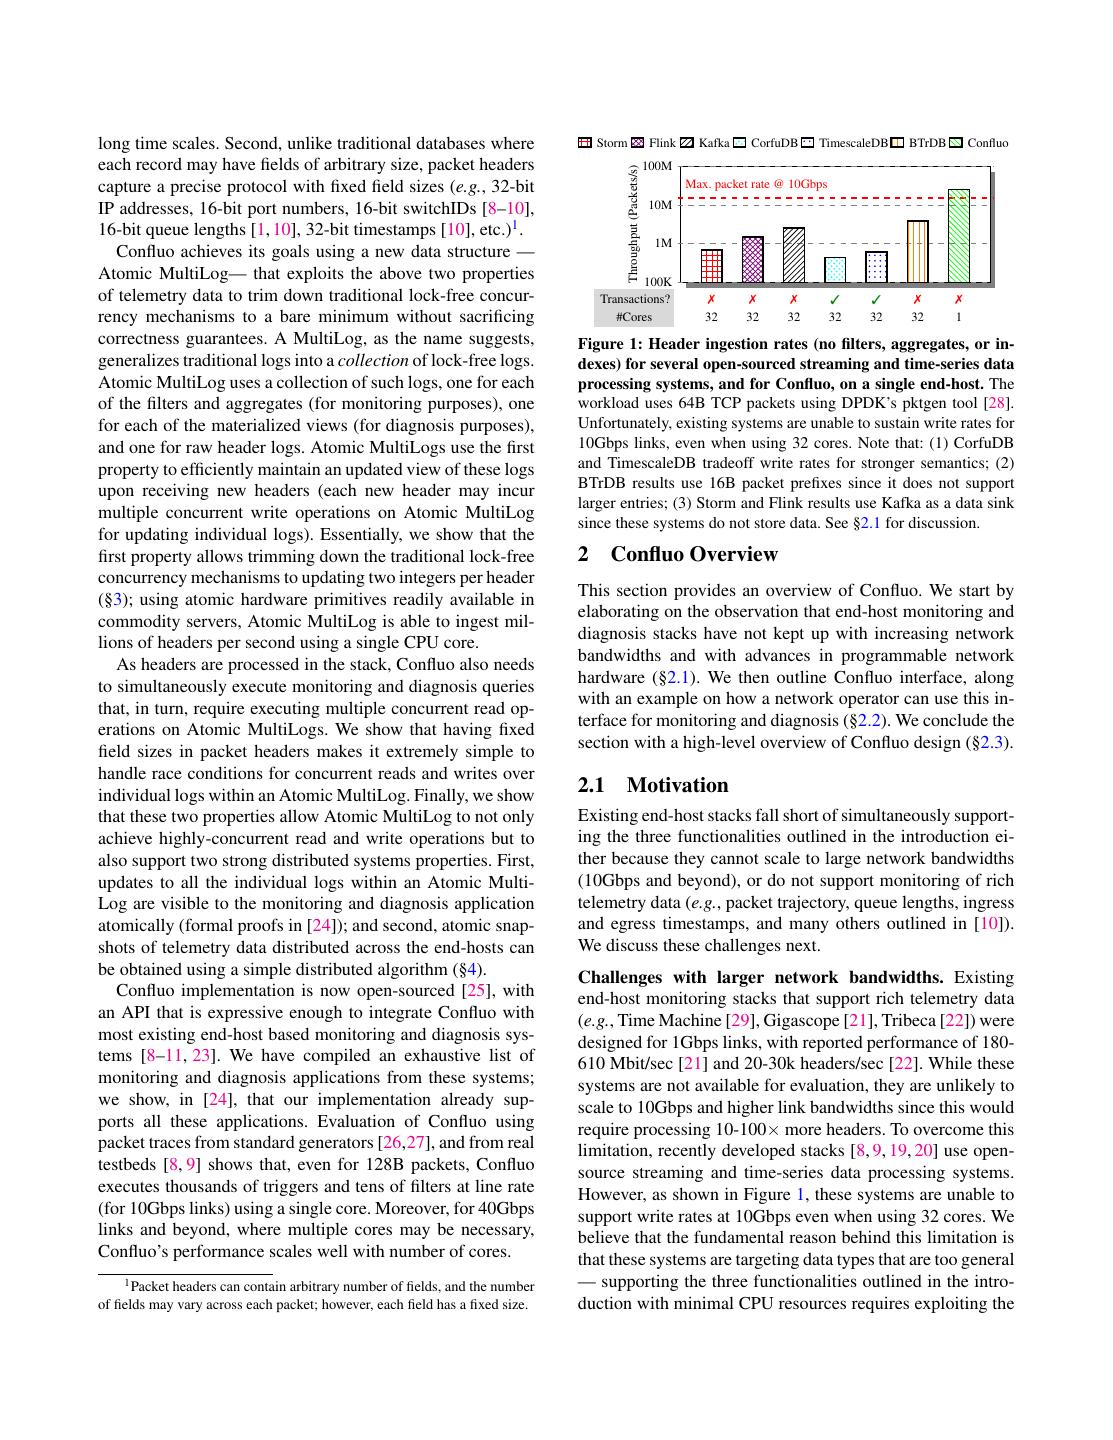
2 .long time scales. Second, unlike traditional databases where Storm Flink Kafka CorfuDB TimescaleDB BTrDB Confluo each record may have fields of arbitrary size, packet headers 100M Throughput (Packets/s) capture a precise protocol with fixed field sizes (e.g., 32-bit Max. packet rate @ 10Gbps IP addresses, 16-bit port numbers, 16-bit switchIDs [8–10], 10M 16-bit queue lengths [1, 10], 32-bit timestamps [10], etc.)1 . 1M Confluo achieves its goals using a new data structure — Atomic MultiLog— that exploits the above two properties 100K of telemetry data to trim down traditional lock-free concur- Transactions? ✗ ✗ ✗ ✓ ✓ ✗ ✗ rency mechanisms to a bare minimum without sacrificing #Cores 32 32 32 32 32 32 1 correctness guarantees. A MultiLog, as the name suggests, Figure 1: Header ingestion rates (no filters, aggregates, or in- generalizes traditional logs into a collection of lock-free logs. dexes) for several open-sourced streaming and time-series data Atomic MultiLog uses a collection of such logs, one for each processing systems, and for Confluo, on a single end-host. The of the filters and aggregates (for monitoring purposes), one workload uses 64B TCP packets using DPDK’s pktgen tool [28]. for each of the materialized views (for diagnosis purposes), Unfortunately, existing systems are unable to sustain write rates for and one for raw header logs. Atomic MultiLogs use the first 10Gbps links, even when using 32 cores. Note that: (1) CorfuDB property to efficiently maintain an updated view of these logs and TimescaleDB tradeoff write rates for stronger semantics; (2) upon receiving new headers (each new header may incur BTrDB results use 16B packet prefixes since it does not support larger entries; (3) Storm and Flink results use Kafka as a data sink multiple concurrent write operations on Atomic MultiLog since these systems do not store data. See §2.1 for discussion. for updating individual logs). Essentially, we show that the first property allows trimming down the traditional lock-free 2 Confluo Overview concurrency mechanisms to updating two integers per header This section provides an overview of Confluo. We start by (§3); using atomic hardware primitives readily available in elaborating on the observation that end-host monitoring and commodity servers, Atomic MultiLog is able to ingest mil- diagnosis stacks have not kept up with increasing network lions of headers per second using a single CPU core. bandwidths and with advances in programmable network As headers are processed in the stack, Confluo also needs hardware (§2.1). We then outline Confluo interface, along to simultaneously execute monitoring and diagnosis queries with an example on how a network operator can use this in- that, in turn, require executing multiple concurrent read op- terface for monitoring and diagnosis (§2.2). We conclude the erations on Atomic MultiLogs. We show that having fixed section with a high-level overview of Confluo design (§2.3). field sizes in packet headers makes it extremely simple to handle race conditions for concurrent reads and writes over individual logs within an Atomic MultiLog. Finally, we show 2.1 Motivation that these two properties allow Atomic MultiLog to not only Existing end-host stacks fall short of simultaneously support- achieve highly-concurrent read and write operations but to ing the three functionalities outlined in the introduction ei- also support two strong distributed systems properties. First, ther because they cannot scale to large network bandwidths updates to all the individual logs within an Atomic Multi- (10Gbps and beyond), or do not support monitoring of rich Log are visible to the monitoring and diagnosis application telemetry data (e.g., packet trajectory, queue lengths, ingress atomically (formal proofs in [24]); and second, atomic snap- and egress timestamps, and many others outlined in [10]). shots of telemetry data distributed across the end-hosts can We discuss these challenges next. be obtained using a simple distributed algorithm (§4). Challenges with larger network bandwidths. Existing Confluo implementation is now open-sourced [25], with end-host monitoring stacks that support rich telemetry data an API that is expressive enough to integrate Confluo with (e.g., Time Machine [29], Gigascope [21], Tribeca [22]) were most existing end-host based monitoring and diagnosis sys- designed for 1Gbps links, with reported performance of 180- tems [8–11, 23]. We have compiled an exhaustive list of 610 Mbit/sec [21] and 20-30k headers/sec [22]. While these monitoring and diagnosis applications from these systems; systems are not available for evaluation, they are unlikely to we show, in [24], that our implementation already sup- scale to 10Gbps and higher link bandwidths since this would ports all these applications. Evaluation of Confluo using require processing 10-100× more headers. To overcome this packet traces from standard generators [26,27], and from real limitation, recently developed stacks [8, 9, 19, 20] use open- testbeds [8, 9] shows that, even for 128B packets, Confluo source streaming and time-series data processing systems. executes thousands of triggers and tens of filters at line rate However, as shown in Figure 1, these systems are unable to (for 10Gbps links) using a single core. Moreover, for 40Gbps support write rates at 10Gbps even when using 32 cores. We links and beyond, where multiple cores may be necessary, believe that the fundamental reason behind this limitation is Confluo’s performance scales well with number of cores. that these systems are targeting data types that are too general 1 Packet headers can contain arbitrary number of fields, and the number — supporting the three functionalities outlined in the intro- of fields may vary across each packet; however, each field has a fixed size. duction with minimal CPU resources requires exploiting the
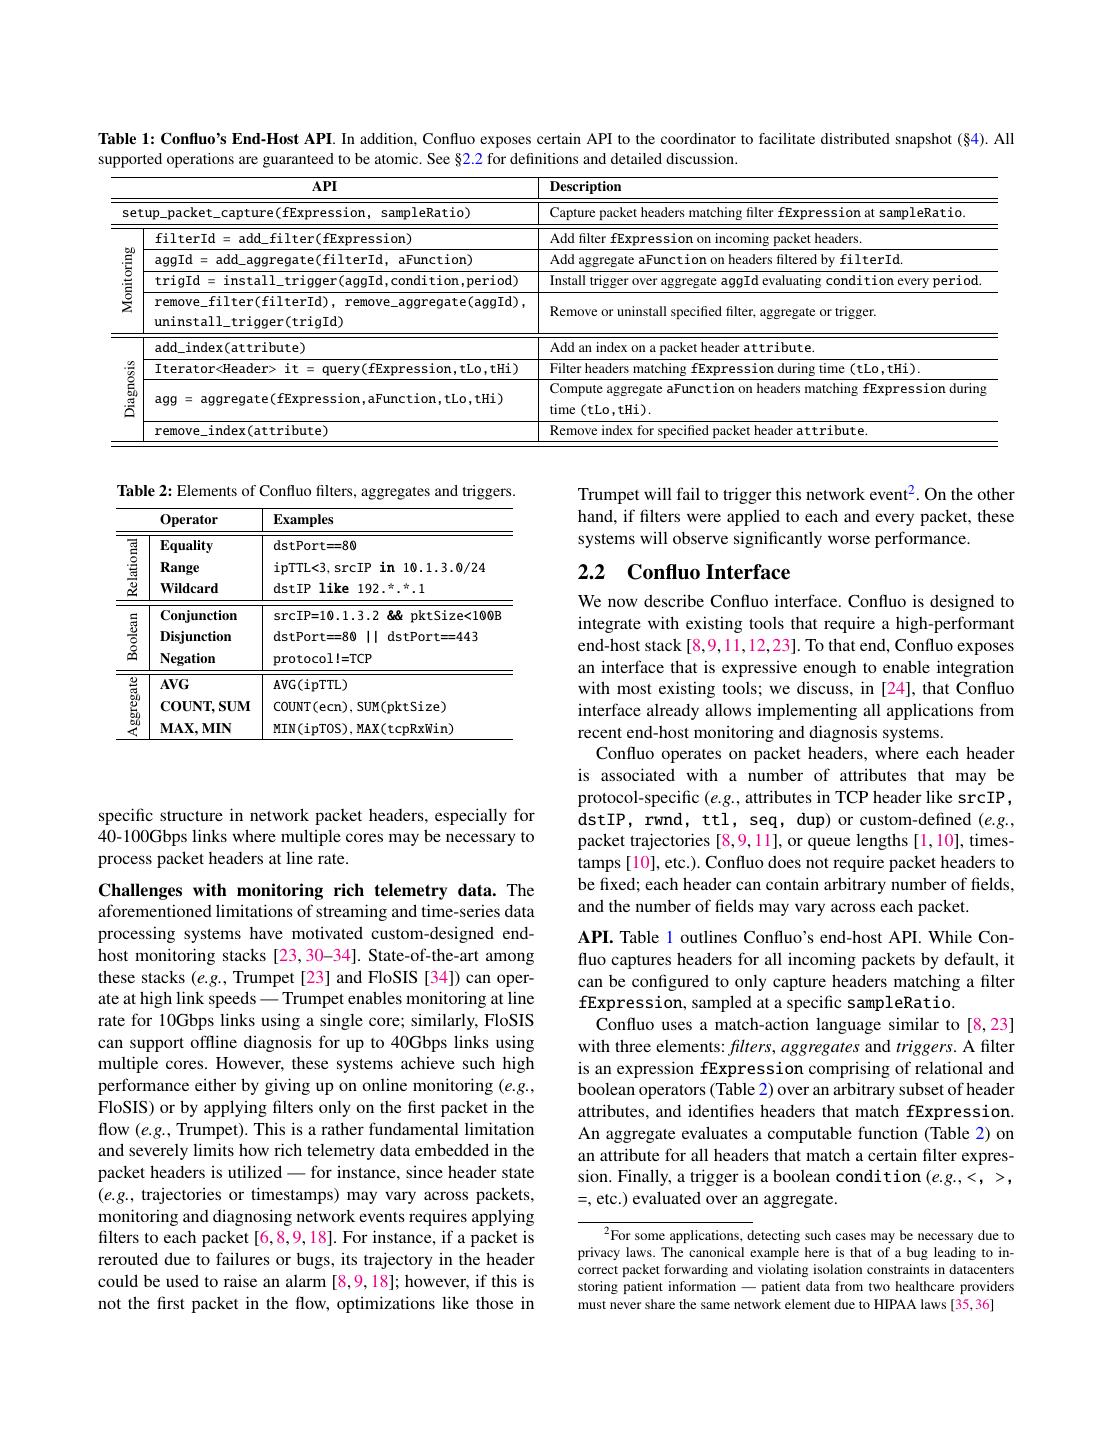
3 .Table 1: Confluo’s End-Host API. In addition, Confluo exposes certain API to the coordinator to facilitate distributed snapshot (§4). All supported operations are guaranteed to be atomic. See §2.2 for definitions and detailed discussion. API Description setup_packet_capture(fExpression, sampleRatio) Capture packet headers matching filter fExpression at sampleRatio. filterId = add_filter(fExpression) Add filter fExpression on incoming packet headers. Monitoring aggId = add_aggregate(filterId, aFunction) Add aggregate aFunction on headers filtered by filterId. trigId = install_trigger(aggId,condition,period) Install trigger over aggregate aggId evaluating condition every period. remove_filter(filterId), remove_aggregate(aggId), Remove or uninstall specified filter, aggregate or trigger. uninstall_trigger(trigId) add_index(attribute) Add an index on a packet header attribute. Diagnosis Iterator<Header> it = query(fExpression,tLo,tHi) Filter headers matching fExpression during time (tLo,tHi). Compute aggregate aFunction on headers matching fExpression during agg = aggregate(fExpression,aFunction,tLo,tHi) time (tLo,tHi). remove_index(attribute) Remove index for specified packet header attribute. Table 2: Elements of Confluo filters, aggregates and triggers. Trumpet will fail to trigger this network event2 . On the other Operator Examples hand, if filters were applied to each and every packet, these systems will observe significantly worse performance. Relational Equality dstPort==80 Range ipTTL<3, srcIP in 10.1.3.0/24 2.2 Confluo Interface Wildcard dstIP like 192.*.*.1 We now describe Confluo interface. Confluo is designed to Conjunction srcIP=10.1.3.2 && pktSize<100B Boolean integrate with existing tools that require a high-performant Disjunction dstPort==80 || dstPort==443 end-host stack [8, 9, 11, 12, 23]. To that end, Confluo exposes Negation protocol!=TCP an interface that is expressive enough to enable integration Aggregate AVG AVG(ipTTL) with most existing tools; we discuss, in [24], that Confluo COUNT, SUM COUNT(ecn), SUM(pktSize) interface already allows implementing all applications from MAX, MIN MIN(ipTOS), MAX(tcpRxWin) recent end-host monitoring and diagnosis systems. Confluo operates on packet headers, where each header is associated with a number of attributes that may be protocol-specific (e.g., attributes in TCP header like srcIP, specific structure in network packet headers, especially for dstIP, rwnd, ttl, seq, dup) or custom-defined (e.g., 40-100Gbps links where multiple cores may be necessary to packet trajectories [8, 9, 11], or queue lengths [1, 10], times- process packet headers at line rate. tamps [10], etc.). Confluo does not require packet headers to Challenges with monitoring rich telemetry data. The be fixed; each header can contain arbitrary number of fields, aforementioned limitations of streaming and time-series data and the number of fields may vary across each packet. processing systems have motivated custom-designed end- API. Table 1 outlines Confluo’s end-host API. While Con- host monitoring stacks [23, 30–34]. State-of-the-art among fluo captures headers for all incoming packets by default, it these stacks (e.g., Trumpet [23] and FloSIS [34]) can oper- can be configured to only capture headers matching a filter ate at high link speeds — Trumpet enables monitoring at line fExpression, sampled at a specific sampleRatio. rate for 10Gbps links using a single core; similarly, FloSIS Confluo uses a match-action language similar to [8, 23] can support offline diagnosis for up to 40Gbps links using with three elements: filters, aggregates and triggers. A filter multiple cores. However, these systems achieve such high is an expression fExpression comprising of relational and performance either by giving up on online monitoring (e.g., boolean operators (Table 2) over an arbitrary subset of header FloSIS) or by applying filters only on the first packet in the attributes, and identifies headers that match fExpression. flow (e.g., Trumpet). This is a rather fundamental limitation An aggregate evaluates a computable function (Table 2) on and severely limits how rich telemetry data embedded in the an attribute for all headers that match a certain filter expres- packet headers is utilized — for instance, since header state sion. Finally, a trigger is a boolean condition (e.g., <, >, (e.g., trajectories or timestamps) may vary across packets, =, etc.) evaluated over an aggregate. monitoring and diagnosing network events requires applying 2 For some applications, detecting such cases may be necessary due to filters to each packet [6, 8, 9, 18]. For instance, if a packet is privacy laws. The canonical example here is that of a bug leading to in- rerouted due to failures or bugs, its trajectory in the header correct packet forwarding and violating isolation constraints in datacenters could be used to raise an alarm [8, 9, 18]; however, if this is storing patient information — patient data from two healthcare providers not the first packet in the flow, optimizations like those in must never share the same network element due to HIPAA laws [35, 36]
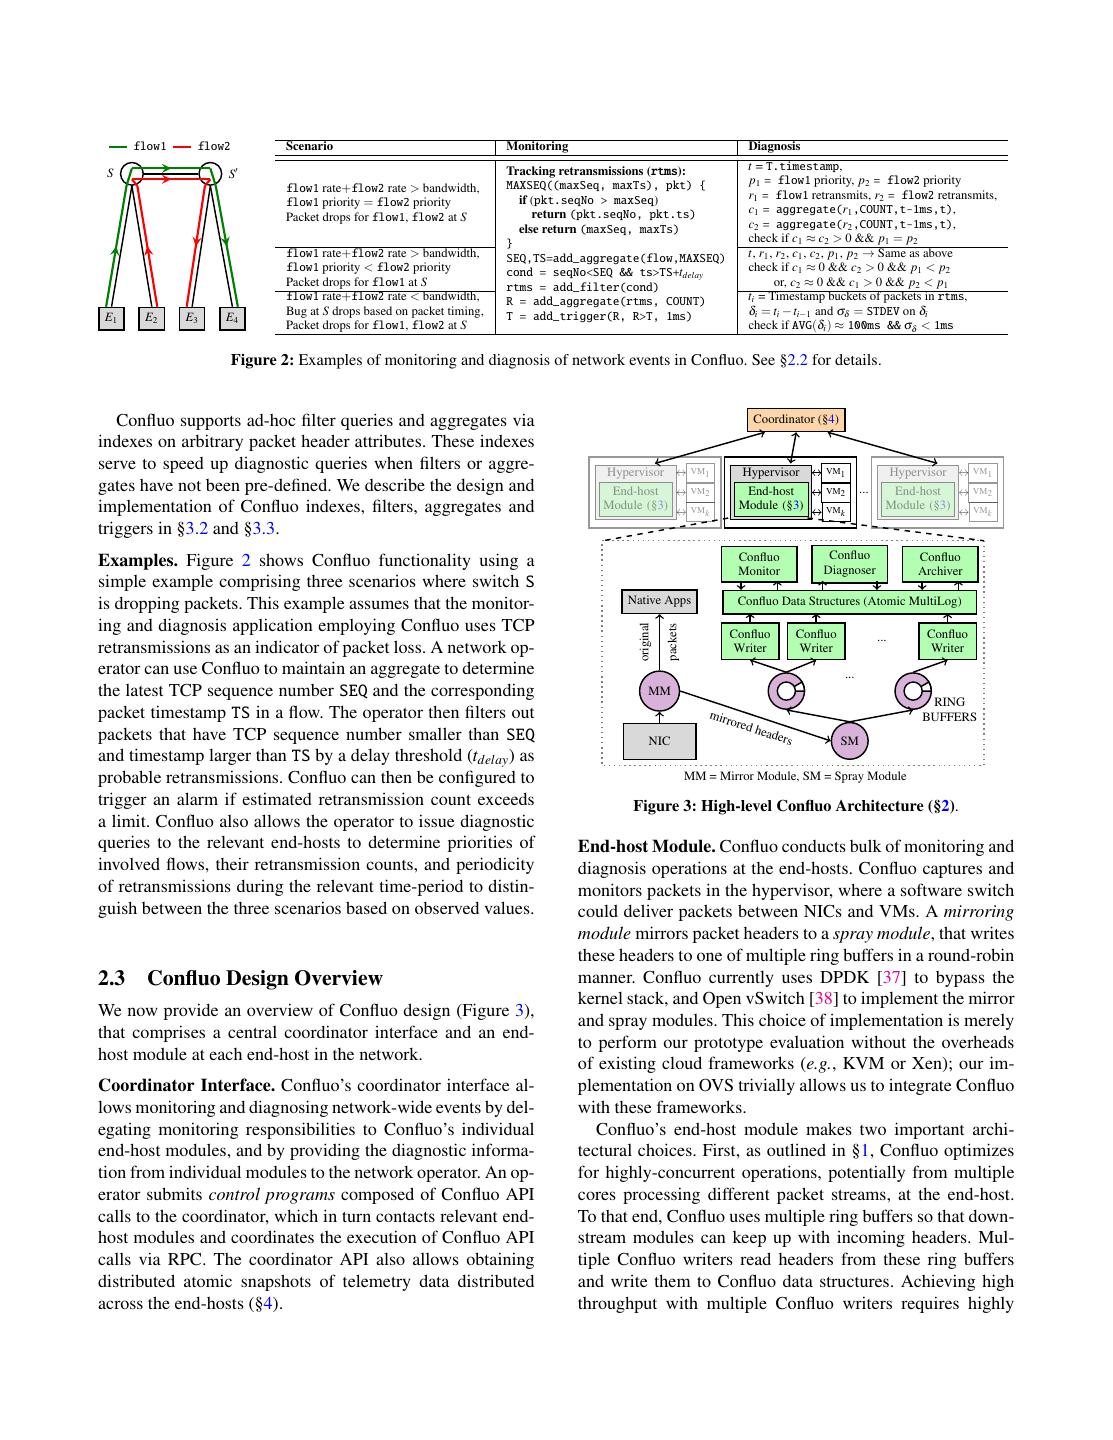
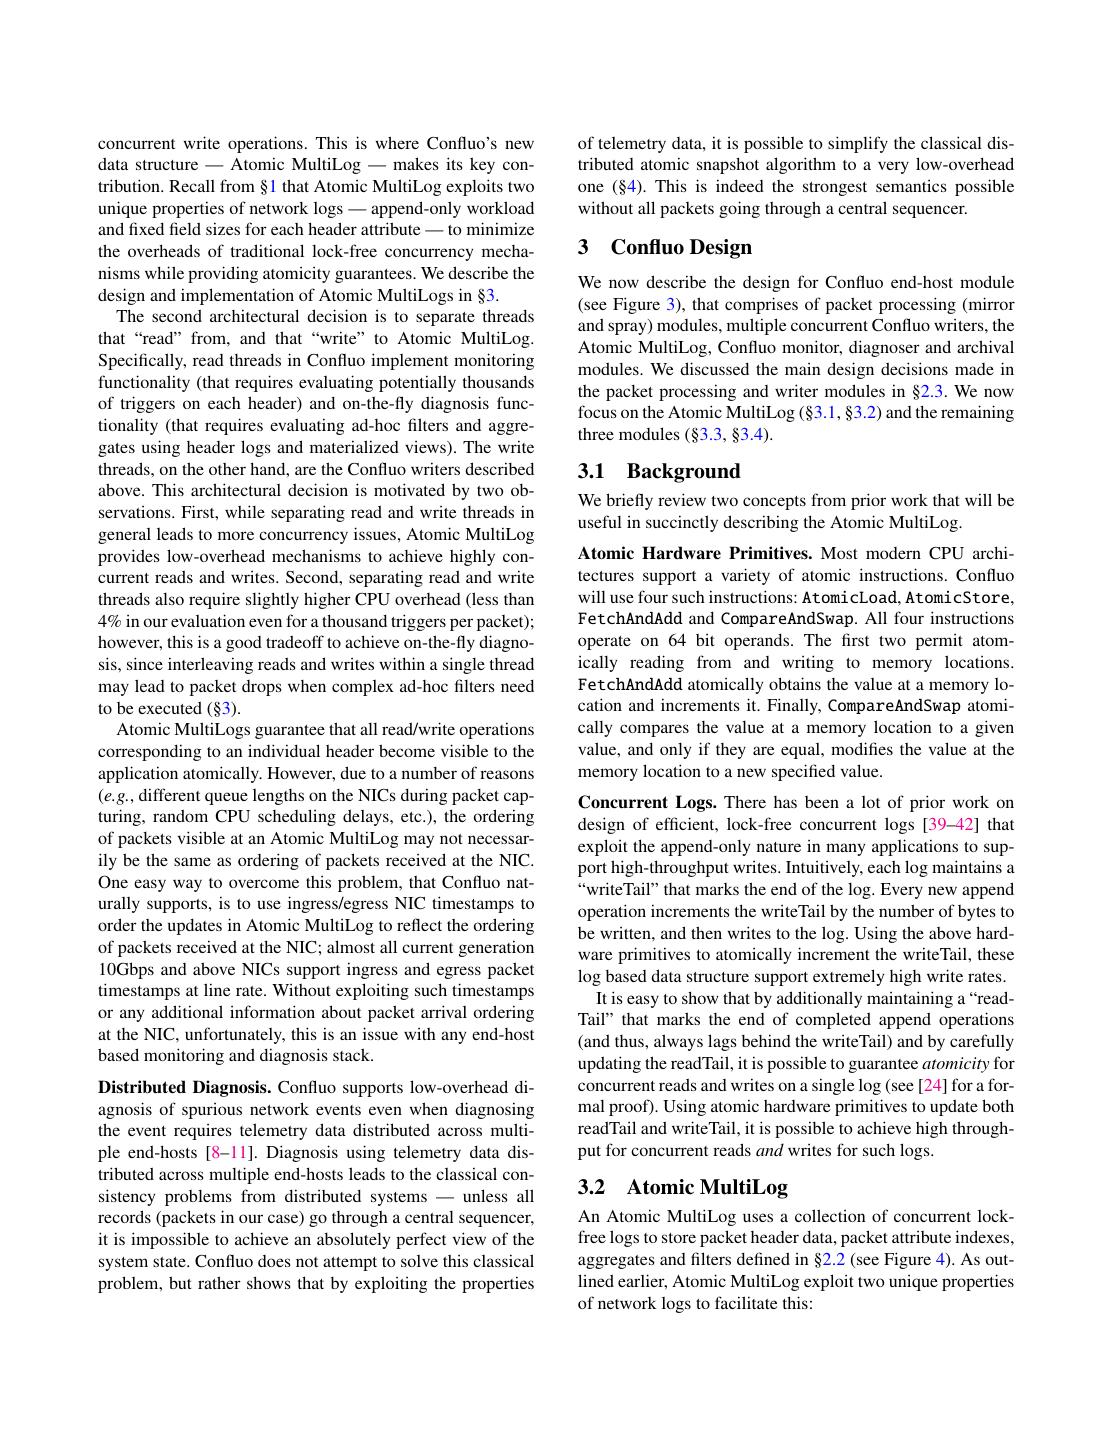
4 . flow1 flow2 Scenario Monitoring Diagnosis Tracking retransmissions (rtms): t = T.timestamp, S S MAXSEQ((maxSeq, maxTs), pkt) { p1 = flow1 priority, p2 = flow2 priority flow1 rate+flow2 rate > bandwidth, if (pkt.seqNo > maxSeq) r1 = flow1 retransmits, r2 = flow2 retransmits, flow1 priority = flow2 priority return (pkt.seqNo, pkt.ts) c1 = aggregate(r1 ,COUNT,t-1ms,t), Packet drops for flow1, flow2 at S else return (maxSeq, maxTs) c2 = aggregate(r2 ,COUNT,t-1ms,t), } check if c1 ≈ c2 > 0 && p1 = p2 flow1 rate+flow2 rate > bandwidth, SEQ,TS=add_aggregate(flow,MAXSEQ) t, r1 , r2 , c1 , c2 , p1 , p2 → Same as above flow1 priority < flow2 priority cond = seqNo<SEQ && ts>TS+tdelay check if c1 ≈ 0 && c2 > 0 && p1 < p2 Packet drops for flow1 at S rtms = add_filter(cond) or, c2 ≈ 0 && c1 > 0 && p2 < p1 flow1 rate+flow2 rate < bandwidth, R = add_aggregate(rtms, COUNT) ti = Timestamp buckets of packets in rtms, Bug at S drops based on packet timing, T = add_trigger(R, R>T, 1ms) δi = ti − ti−1 and σδ = STDEV on δi E1 E2 E3 E4 Packet drops for flow1, flow2 at S check if AVG(δi ) ≈ 100ms && σδ < 1ms Figure 2: Examples of monitoring and diagnosis of network events in Confluo. See §2.2 for details. Confluo supports ad-hoc filter queries and aggregates via Coordinator (§4) indexes on arbitrary packet header attributes. These indexes serve to speed up diagnostic queries when filters or aggre- Hypervisor VM1 Hypervisor VM1 Hypervisor VM1 gates have not been pre-defined. We describe the design and End-host VM2 End-host VM2 ... End-host VM2 implementation of Confluo indexes, filters, aggregates and Module (§3) VMk Module (§3) VMk Module (§3) VMk triggers in §3.2 and §3.3. Examples. Figure 2 shows Confluo functionality using a Confluo Confluo Confluo Monitor Diagnoser Archiver simple example comprising three scenarios where switch S is dropping packets. This example assumes that the monitor- Native Apps Confluo Data Structures (Atomic MultiLog) ing and diagnosis application employing Confluo uses TCP original packets Confluo Confluo ... Confluo retransmissions as an indicator of packet loss. A network op- Writer Writer Writer erator can use Confluo to maintain an aggregate to determine ... the latest TCP sequence number SEQ and the corresponding MM RING packet timestamp TS in a flow. The operator then filters out mirr ored BUFFERS head packets that have TCP sequence number smaller than SEQ NIC ers SM and timestamp larger than TS by a delay threshold (tdelay ) as probable retransmissions. Confluo can then be configured to MM = Mirror Module, SM = Spray Module trigger an alarm if estimated retransmission count exceeds Figure 3: High-level Confluo Architecture (§2). a limit. Confluo also allows the operator to issue diagnostic queries to the relevant end-hosts to determine priorities of End-host Module. Confluo conducts bulk of monitoring and involved flows, their retransmission counts, and periodicity diagnosis operations at the end-hosts. Confluo captures and of retransmissions during the relevant time-period to distin- monitors packets in the hypervisor, where a software switch guish between the three scenarios based on observed values. could deliver packets between NICs and VMs. A mirroring module mirrors packet headers to a spray module, that writes these headers to one of multiple ring buffers in a round-robin 2.3 Confluo Design Overview manner. Confluo currently uses DPDK [37] to bypass the kernel stack, and Open vSwitch [38] to implement the mirror We now provide an overview of Confluo design (Figure 3), and spray modules. This choice of implementation is merely that comprises a central coordinator interface and an end- to perform our prototype evaluation without the overheads host module at each end-host in the network. of existing cloud frameworks (e.g., KVM or Xen); our im- Coordinator Interface. Confluo’s coordinator interface al- plementation on OVS trivially allows us to integrate Confluo lows monitoring and diagnosing network-wide events by del- with these frameworks. egating monitoring responsibilities to Confluo’s individual Confluo’s end-host module makes two important archi- end-host modules, and by providing the diagnostic informa- tectural choices. First, as outlined in §1, Confluo optimizes tion from individual modules to the network operator. An op- for highly-concurrent operations, potentially from multiple erator submits control programs composed of Confluo API cores processing different packet streams, at the end-host. calls to the coordinator, which in turn contacts relevant end- To that end, Confluo uses multiple ring buffers so that down- host modules and coordinates the execution of Confluo API stream modules can keep up with incoming headers. Mul- calls via RPC. The coordinator API also allows obtaining tiple Confluo writers read headers from these ring buffers distributed atomic snapshots of telemetry data distributed and write them to Confluo data structures. Achieving high across the end-hosts (§4). throughput with multiple Confluo writers requires highly
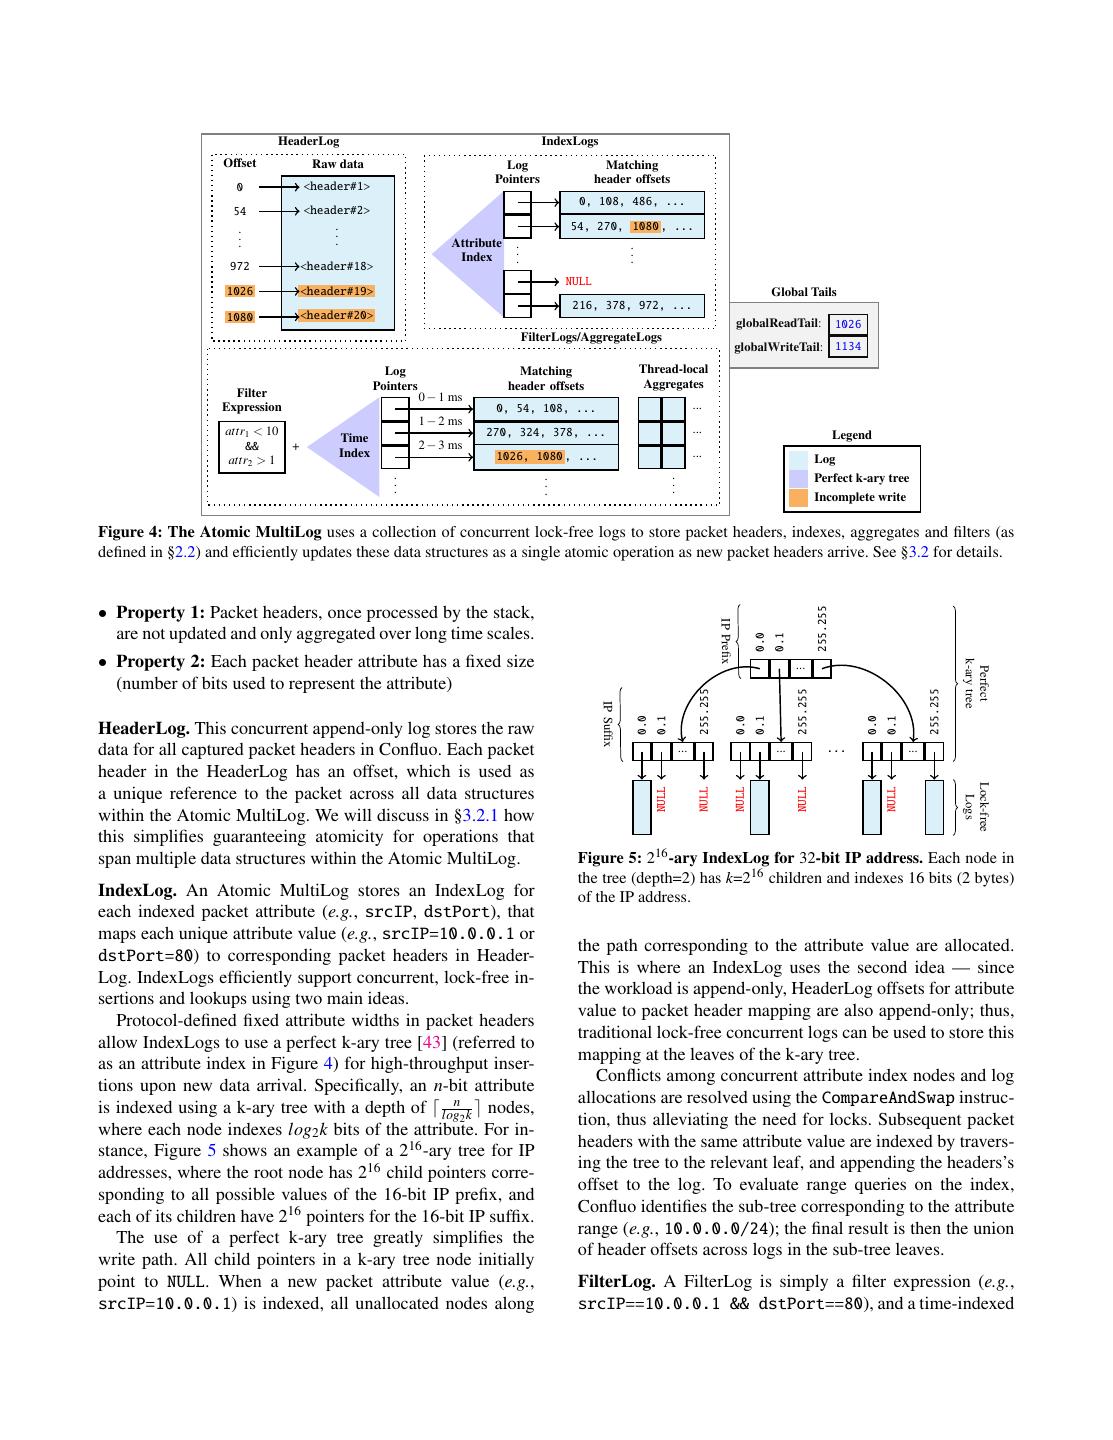
5 .concurrent write operations. This is where Confluo’s new of telemetry data, it is possible to simplify the classical dis- data structure — Atomic MultiLog — makes its key con- tributed atomic snapshot algorithm to a very low-overhead tribution. Recall from §1 that Atomic MultiLog exploits two one (§4). This is indeed the strongest semantics possible unique properties of network logs — append-only workload without all packets going through a central sequencer. and fixed field sizes for each header attribute — to minimize the overheads of traditional lock-free concurrency mecha- 3 Confluo Design nisms while providing atomicity guarantees. We describe the We now describe the design for Confluo end-host module design and implementation of Atomic MultiLogs in §3. (see Figure 3), that comprises of packet processing (mirror The second architectural decision is to separate threads and spray) modules, multiple concurrent Confluo writers, the that “read” from, and that “write” to Atomic MultiLog. Atomic MultiLog, Confluo monitor, diagnoser and archival Specifically, read threads in Confluo implement monitoring modules. We discussed the main design decisions made in functionality (that requires evaluating potentially thousands the packet processing and writer modules in §2.3. We now of triggers on each header) and on-the-fly diagnosis func- focus on the Atomic MultiLog (§3.1, §3.2) and the remaining tionality (that requires evaluating ad-hoc filters and aggre- three modules (§3.3, §3.4). gates using header logs and materialized views). The write threads, on the other hand, are the Confluo writers described 3.1 Background above. This architectural decision is motivated by two ob- We briefly review two concepts from prior work that will be servations. First, while separating read and write threads in useful in succinctly describing the Atomic MultiLog. general leads to more concurrency issues, Atomic MultiLog provides low-overhead mechanisms to achieve highly con- Atomic Hardware Primitives. Most modern CPU archi- current reads and writes. Second, separating read and write tectures support a variety of atomic instructions. Confluo threads also require slightly higher CPU overhead (less than will use four such instructions: AtomicLoad, AtomicStore, 4% in our evaluation even for a thousand triggers per packet); FetchAndAdd and CompareAndSwap. All four instructions however, this is a good tradeoff to achieve on-the-fly diagno- operate on 64 bit operands. The first two permit atom- sis, since interleaving reads and writes within a single thread ically reading from and writing to memory locations. may lead to packet drops when complex ad-hoc filters need FetchAndAdd atomically obtains the value at a memory lo- to be executed (§3). cation and increments it. Finally, CompareAndSwap atomi- Atomic MultiLogs guarantee that all read/write operations cally compares the value at a memory location to a given corresponding to an individual header become visible to the value, and only if they are equal, modifies the value at the application atomically. However, due to a number of reasons memory location to a new specified value. (e.g., different queue lengths on the NICs during packet cap- Concurrent Logs. There has been a lot of prior work on turing, random CPU scheduling delays, etc.), the ordering design of efficient, lock-free concurrent logs [39–42] that of packets visible at an Atomic MultiLog may not necessar- exploit the append-only nature in many applications to sup- ily be the same as ordering of packets received at the NIC. port high-throughput writes. Intuitively, each log maintains a One easy way to overcome this problem, that Confluo nat- “writeTail” that marks the end of the log. Every new append urally supports, is to use ingress/egress NIC timestamps to operation increments the writeTail by the number of bytes to order the updates in Atomic MultiLog to reflect the ordering be written, and then writes to the log. Using the above hard- of packets received at the NIC; almost all current generation ware primitives to atomically increment the writeTail, these 10Gbps and above NICs support ingress and egress packet log based data structure support extremely high write rates. timestamps at line rate. Without exploiting such timestamps It is easy to show that by additionally maintaining a “read- or any additional information about packet arrival ordering Tail” that marks the end of completed append operations at the NIC, unfortunately, this is an issue with any end-host (and thus, always lags behind the writeTail) and by carefully based monitoring and diagnosis stack. updating the readTail, it is possible to guarantee atomicity for Distributed Diagnosis. Confluo supports low-overhead di- concurrent reads and writes on a single log (see [24] for a for- agnosis of spurious network events even when diagnosing mal proof). Using atomic hardware primitives to update both the event requires telemetry data distributed across multi- readTail and writeTail, it is possible to achieve high through- ple end-hosts [8–11]. Diagnosis using telemetry data dis- put for concurrent reads and writes for such logs. tributed across multiple end-hosts leads to the classical con- sistency problems from distributed systems — unless all 3.2 Atomic MultiLog records (packets in our case) go through a central sequencer, An Atomic MultiLog uses a collection of concurrent lock- it is impossible to achieve an absolutely perfect view of the free logs to store packet header data, packet attribute indexes, system state. Confluo does not attempt to solve this classical aggregates and filters defined in §2.2 (see Figure 4). As out- problem, but rather shows that by exploiting the properties lined earlier, Atomic MultiLog exploit two unique properties of network logs to facilitate this:
6 . HeaderLog IndexLogs Offset Raw data Log Matching Pointers header offsets 0 <header#1> 0, 108, 486, ... 54 <header#2> . . 54, 270, 1080 , ... . . . . Attribute . . Index . . . . 972 <header#18> NULL 1026 <header#19> Global Tails 216, 378, 972, ... 1080 <header#20> globalReadTail: 1026 FilterLogs/AggregateLogs globalWriteTail: 1134 Log Matching Thread-local Pointers header offsets Aggregates Filter 0 − 1 ms Expression 0, 54, 108, ... ... 1 − 2 ms attr1 < 10 270, 324, 378, ... ... Legend Time && + 2 − 3 ms Index 1026, 1080 , ... ... attr2 > 1 Log . . . Perfect k-ary tree . . . . . . Incomplete write Figure 4: The Atomic MultiLog uses a collection of concurrent lock-free logs to store packet headers, indexes, aggregates and filters (as defined in §2.2) and efficiently updates these data structures as a single atomic operation as new packet headers arrive. See §3.2 for details. • Property 1: Packet headers, once processed by the stack, 255.255 IP Prefix are not updated and only aggregated over long time scales. 0.0 0.1 • Property 2: Each packet header attribute has a fixed size k-ary tree ... Perfect (number of bits used to represent the attribute) 255.255 255.255 255.255 IP Suffix 0.0 0.1 0.0 0.1 0.0 0.1 HeaderLog. This concurrent append-only log stores the raw data for all captured packet headers in Confluo. Each packet ... ... ... ... header in the HeaderLog has an offset, which is used as Lock-free NULL NULL NULL NULL NULL a unique reference to the packet across all data structures Logs within the Atomic MultiLog. We will discuss in §3.2.1 how this simplifies guaranteeing atomicity for operations that span multiple data structures within the Atomic MultiLog. Figure 5: 216 -ary IndexLog for 32-bit IP address. Each node in the tree (depth=2) has k=216 children and indexes 16 bits (2 bytes) IndexLog. An Atomic MultiLog stores an IndexLog for of the IP address. each indexed packet attribute (e.g., srcIP, dstPort), that maps each unique attribute value (e.g., srcIP=10.0.0.1 or the path corresponding to the attribute value are allocated. dstPort=80) to corresponding packet headers in Header- This is where an IndexLog uses the second idea — since Log. IndexLogs efficiently support concurrent, lock-free in- the workload is append-only, HeaderLog offsets for attribute sertions and lookups using two main ideas. value to packet header mapping are also append-only; thus, Protocol-defined fixed attribute widths in packet headers traditional lock-free concurrent logs can be used to store this allow IndexLogs to use a perfect k-ary tree [43] (referred to mapping at the leaves of the k-ary tree. as an attribute index in Figure 4) for high-throughput inser- Conflicts among concurrent attribute index nodes and log tions upon new data arrival. Specifically, an n-bit attribute allocations are resolved using the CompareAndSwap instruc- is indexed using a k-ary tree with a depth of logn2 k nodes, tion, thus alleviating the need for locks. Subsequent packet where each node indexes log2 k bits of the attribute. For in- headers with the same attribute value are indexed by travers- stance, Figure 5 shows an example of a 216 -ary tree for IP ing the tree to the relevant leaf, and appending the headers’s addresses, where the root node has 216 child pointers corre- offset to the log. To evaluate range queries on the index, sponding to all possible values of the 16-bit IP prefix, and Confluo identifies the sub-tree corresponding to the attribute each of its children have 216 pointers for the 16-bit IP suffix. range (e.g., 10.0.0.0/24); the final result is then the union The use of a perfect k-ary tree greatly simplifies the of header offsets across logs in the sub-tree leaves. write path. All child pointers in a k-ary tree node initially point to NULL. When a new packet attribute value (e.g., FilterLog. A FilterLog is simply a filter expression (e.g., srcIP=10.0.0.1) is indexed, all unallocated nodes along srcIP==10.0.0.1 && dstPort==80), and a time-indexed
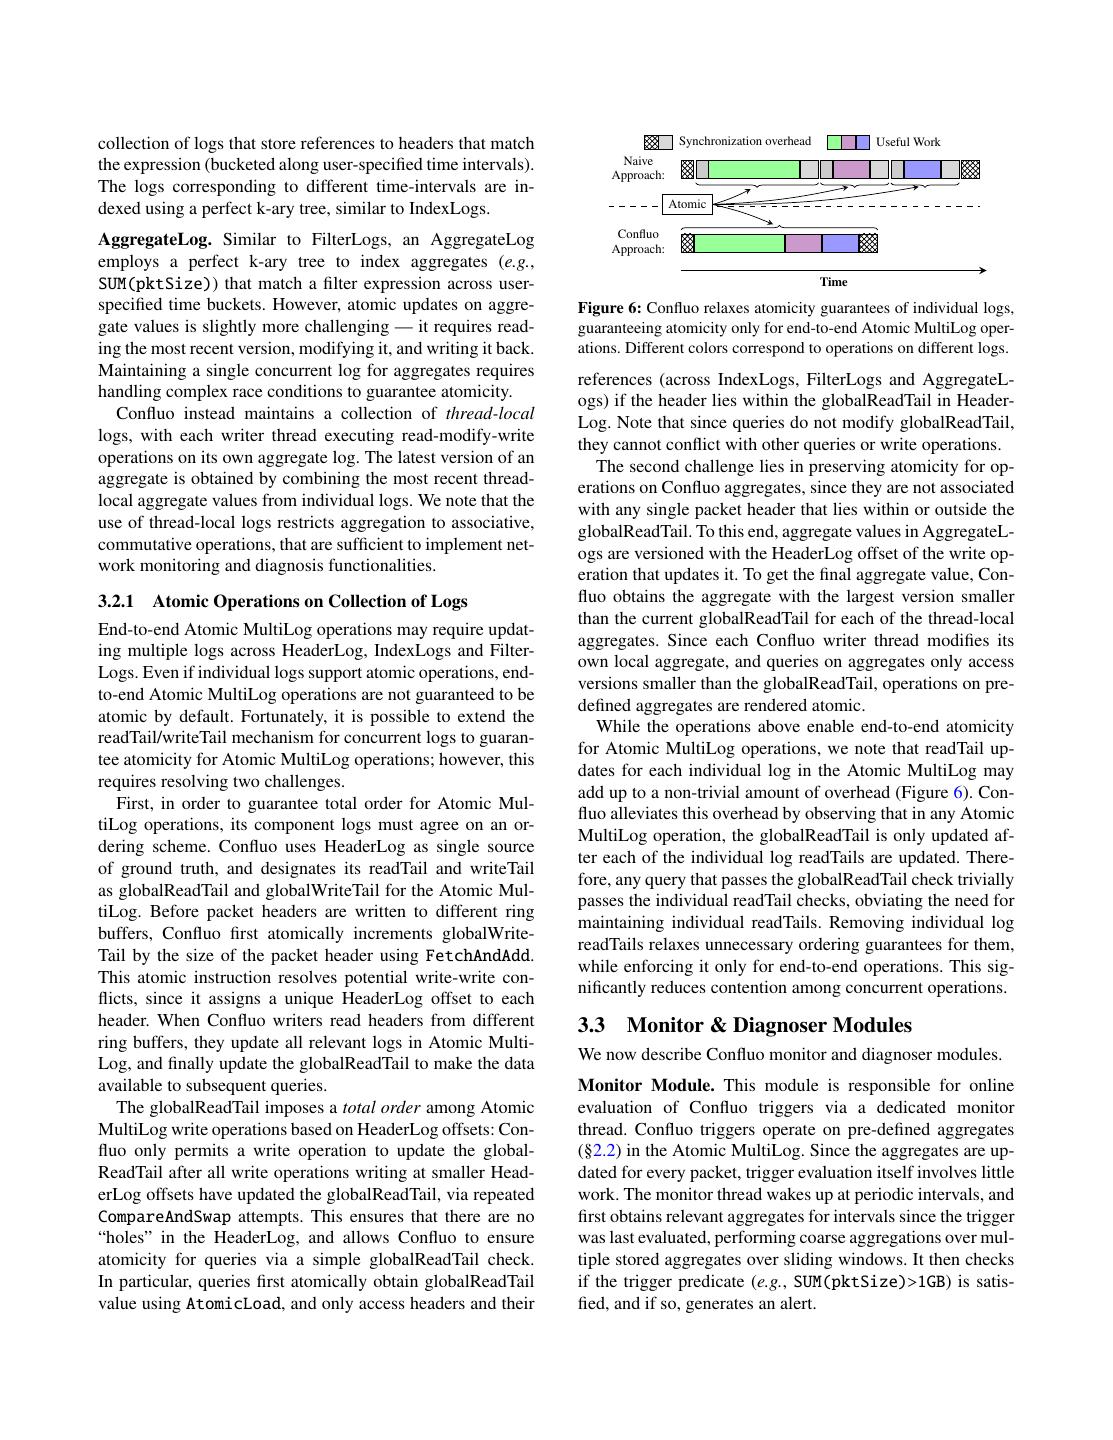
7 .collection of logs that store references to headers that match Synchronization overhead Useful Work the expression (bucketed along user-specified time intervals). Naive Approach: The logs corresponding to different time-intervals are in- dexed using a perfect k-ary tree, similar to IndexLogs. Atomic Confluo AggregateLog. Similar to FilterLogs, an AggregateLog Approach: employs a perfect k-ary tree to index aggregates (e.g., SUM(pktSize)) that match a filter expression across user- Time specified time buckets. However, atomic updates on aggre- Figure 6: Confluo relaxes atomicity guarantees of individual logs, gate values is slightly more challenging — it requires read- guaranteeing atomicity only for end-to-end Atomic MultiLog oper- ing the most recent version, modifying it, and writing it back. ations. Different colors correspond to operations on different logs. Maintaining a single concurrent log for aggregates requires references (across IndexLogs, FilterLogs and AggregateL- handling complex race conditions to guarantee atomicity. ogs) if the header lies within the globalReadTail in Header- Confluo instead maintains a collection of thread-local Log. Note that since queries do not modify globalReadTail, logs, with each writer thread executing read-modify-write they cannot conflict with other queries or write operations. operations on its own aggregate log. The latest version of an The second challenge lies in preserving atomicity for op- aggregate is obtained by combining the most recent thread- erations on Confluo aggregates, since they are not associated local aggregate values from individual logs. We note that the with any single packet header that lies within or outside the use of thread-local logs restricts aggregation to associative, globalReadTail. To this end, aggregate values in AggregateL- commutative operations, that are sufficient to implement net- ogs are versioned with the HeaderLog offset of the write op- work monitoring and diagnosis functionalities. eration that updates it. To get the final aggregate value, Con- 3.2.1 Atomic Operations on Collection of Logs fluo obtains the aggregate with the largest version smaller than the current globalReadTail for each of the thread-local End-to-end Atomic MultiLog operations may require updat- aggregates. Since each Confluo writer thread modifies its ing multiple logs across HeaderLog, IndexLogs and Filter- own local aggregate, and queries on aggregates only access Logs. Even if individual logs support atomic operations, end- versions smaller than the globalReadTail, operations on pre- to-end Atomic MultiLog operations are not guaranteed to be defined aggregates are rendered atomic. atomic by default. Fortunately, it is possible to extend the While the operations above enable end-to-end atomicity readTail/writeTail mechanism for concurrent logs to guaran- for Atomic MultiLog operations, we note that readTail up- tee atomicity for Atomic MultiLog operations; however, this dates for each individual log in the Atomic MultiLog may requires resolving two challenges. add up to a non-trivial amount of overhead (Figure 6). Con- First, in order to guarantee total order for Atomic Mul- fluo alleviates this overhead by observing that in any Atomic tiLog operations, its component logs must agree on an or- MultiLog operation, the globalReadTail is only updated af- dering scheme. Confluo uses HeaderLog as single source ter each of the individual log readTails are updated. There- of ground truth, and designates its readTail and writeTail fore, any query that passes the globalReadTail check trivially as globalReadTail and globalWriteTail for the Atomic Mul- passes the individual readTail checks, obviating the need for tiLog. Before packet headers are written to different ring maintaining individual readTails. Removing individual log buffers, Confluo first atomically increments globalWrite- readTails relaxes unnecessary ordering guarantees for them, Tail by the size of the packet header using FetchAndAdd. while enforcing it only for end-to-end operations. This sig- This atomic instruction resolves potential write-write con- nificantly reduces contention among concurrent operations. flicts, since it assigns a unique HeaderLog offset to each header. When Confluo writers read headers from different 3.3 Monitor & Diagnoser Modules ring buffers, they update all relevant logs in Atomic Multi- We now describe Confluo monitor and diagnoser modules. Log, and finally update the globalReadTail to make the data available to subsequent queries. Monitor Module. This module is responsible for online The globalReadTail imposes a total order among Atomic evaluation of Confluo triggers via a dedicated monitor MultiLog write operations based on HeaderLog offsets: Con- thread. Confluo triggers operate on pre-defined aggregates fluo only permits a write operation to update the global- (§2.2) in the Atomic MultiLog. Since the aggregates are up- ReadTail after all write operations writing at smaller Head- dated for every packet, trigger evaluation itself involves little erLog offsets have updated the globalReadTail, via repeated work. The monitor thread wakes up at periodic intervals, and CompareAndSwap attempts. This ensures that there are no first obtains relevant aggregates for intervals since the trigger “holes” in the HeaderLog, and allows Confluo to ensure was last evaluated, performing coarse aggregations over mul- atomicity for queries via a simple globalReadTail check. tiple stored aggregates over sliding windows. It then checks In particular, queries first atomically obtain globalReadTail if the trigger predicate (e.g., SUM(pktSize)>1GB) is satis- value using AtomicLoad, and only access headers and their fied, and if so, generates an alert.
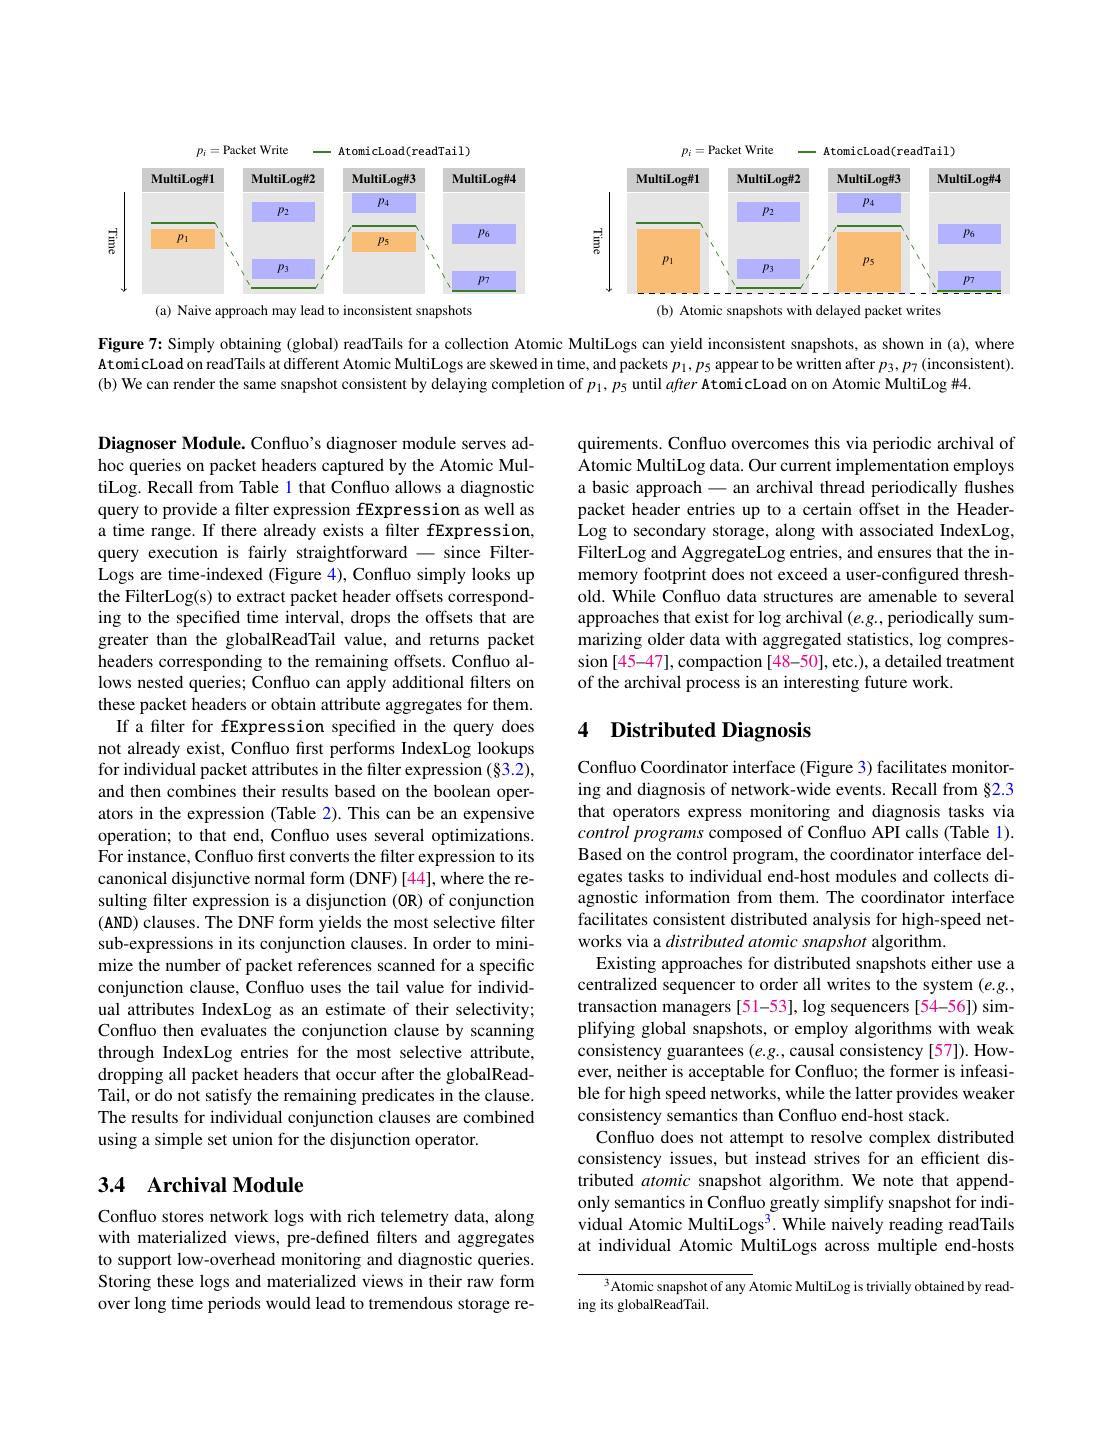
8 . pi = Packet Write AtomicLoad(readTail) pi = Packet Write AtomicLoad(readTail) MultiLog#1 MultiLog#2 MultiLog#3 MultiLog#4 MultiLog#1 MultiLog#2 MultiLog#3 MultiLog#4 p4 p4 p2 p2 p6 p6 Time Time p1 p5 p1 p5 p3 p3 p7 p7 (a) Naive approach may lead to inconsistent snapshots (b) Atomic snapshots with delayed packet writes Figure 7: Simply obtaining (global) readTails for a collection Atomic MultiLogs can yield inconsistent snapshots, as shown in (a), where AtomicLoad on readTails at different Atomic MultiLogs are skewed in time, and packets p1 , p5 appear to be written after p3 , p7 (inconsistent). (b) We can render the same snapshot consistent by delaying completion of p1 , p5 until after AtomicLoad on on Atomic MultiLog #4. Diagnoser Module. Confluo’s diagnoser module serves ad- quirements. Confluo overcomes this via periodic archival of hoc queries on packet headers captured by the Atomic Mul- Atomic MultiLog data. Our current implementation employs tiLog. Recall from Table 1 that Confluo allows a diagnostic a basic approach — an archival thread periodically flushes query to provide a filter expression fExpression as well as packet header entries up to a certain offset in the Header- a time range. If there already exists a filter fExpression, Log to secondary storage, along with associated IndexLog, query execution is fairly straightforward — since Filter- FilterLog and AggregateLog entries, and ensures that the in- Logs are time-indexed (Figure 4), Confluo simply looks up memory footprint does not exceed a user-configured thresh- the FilterLog(s) to extract packet header offsets correspond- old. While Confluo data structures are amenable to several ing to the specified time interval, drops the offsets that are approaches that exist for log archival (e.g., periodically sum- greater than the globalReadTail value, and returns packet marizing older data with aggregated statistics, log compres- headers corresponding to the remaining offsets. Confluo al- sion [45–47], compaction [48–50], etc.), a detailed treatment lows nested queries; Confluo can apply additional filters on of the archival process is an interesting future work. these packet headers or obtain attribute aggregates for them. If a filter for fExpression specified in the query does 4 Distributed Diagnosis not already exist, Confluo first performs IndexLog lookups for individual packet attributes in the filter expression (§3.2), Confluo Coordinator interface (Figure 3) facilitates monitor- and then combines their results based on the boolean oper- ing and diagnosis of network-wide events. Recall from §2.3 ators in the expression (Table 2). This can be an expensive that operators express monitoring and diagnosis tasks via operation; to that end, Confluo uses several optimizations. control programs composed of Confluo API calls (Table 1). For instance, Confluo first converts the filter expression to its Based on the control program, the coordinator interface del- canonical disjunctive normal form (DNF) [44], where the re- egates tasks to individual end-host modules and collects di- sulting filter expression is a disjunction (OR) of conjunction agnostic information from them. The coordinator interface (AND) clauses. The DNF form yields the most selective filter facilitates consistent distributed analysis for high-speed net- sub-expressions in its conjunction clauses. In order to mini- works via a distributed atomic snapshot algorithm. mize the number of packet references scanned for a specific Existing approaches for distributed snapshots either use a conjunction clause, Confluo uses the tail value for individ- centralized sequencer to order all writes to the system (e.g., ual attributes IndexLog as an estimate of their selectivity; transaction managers [51–53], log sequencers [54–56]) sim- Confluo then evaluates the conjunction clause by scanning plifying global snapshots, or employ algorithms with weak through IndexLog entries for the most selective attribute, consistency guarantees (e.g., causal consistency [57]). How- dropping all packet headers that occur after the globalRead- ever, neither is acceptable for Confluo; the former is infeasi- Tail, or do not satisfy the remaining predicates in the clause. ble for high speed networks, while the latter provides weaker The results for individual conjunction clauses are combined consistency semantics than Confluo end-host stack. using a simple set union for the disjunction operator. Confluo does not attempt to resolve complex distributed consistency issues, but instead strives for an efficient dis- 3.4 Archival Module tributed atomic snapshot algorithm. We note that append- only semantics in Confluo greatly simplify snapshot for indi- Confluo stores network logs with rich telemetry data, along vidual Atomic MultiLogs3 . While naively reading readTails with materialized views, pre-defined filters and aggregates at individual Atomic MultiLogs across multiple end-hosts to support low-overhead monitoring and diagnostic queries. Storing these logs and materialized views in their raw form 3 Atomic snapshot of any Atomic MultiLog is trivially obtained by read- over long time periods would lead to tremendous storage re- ing its globalReadTail.
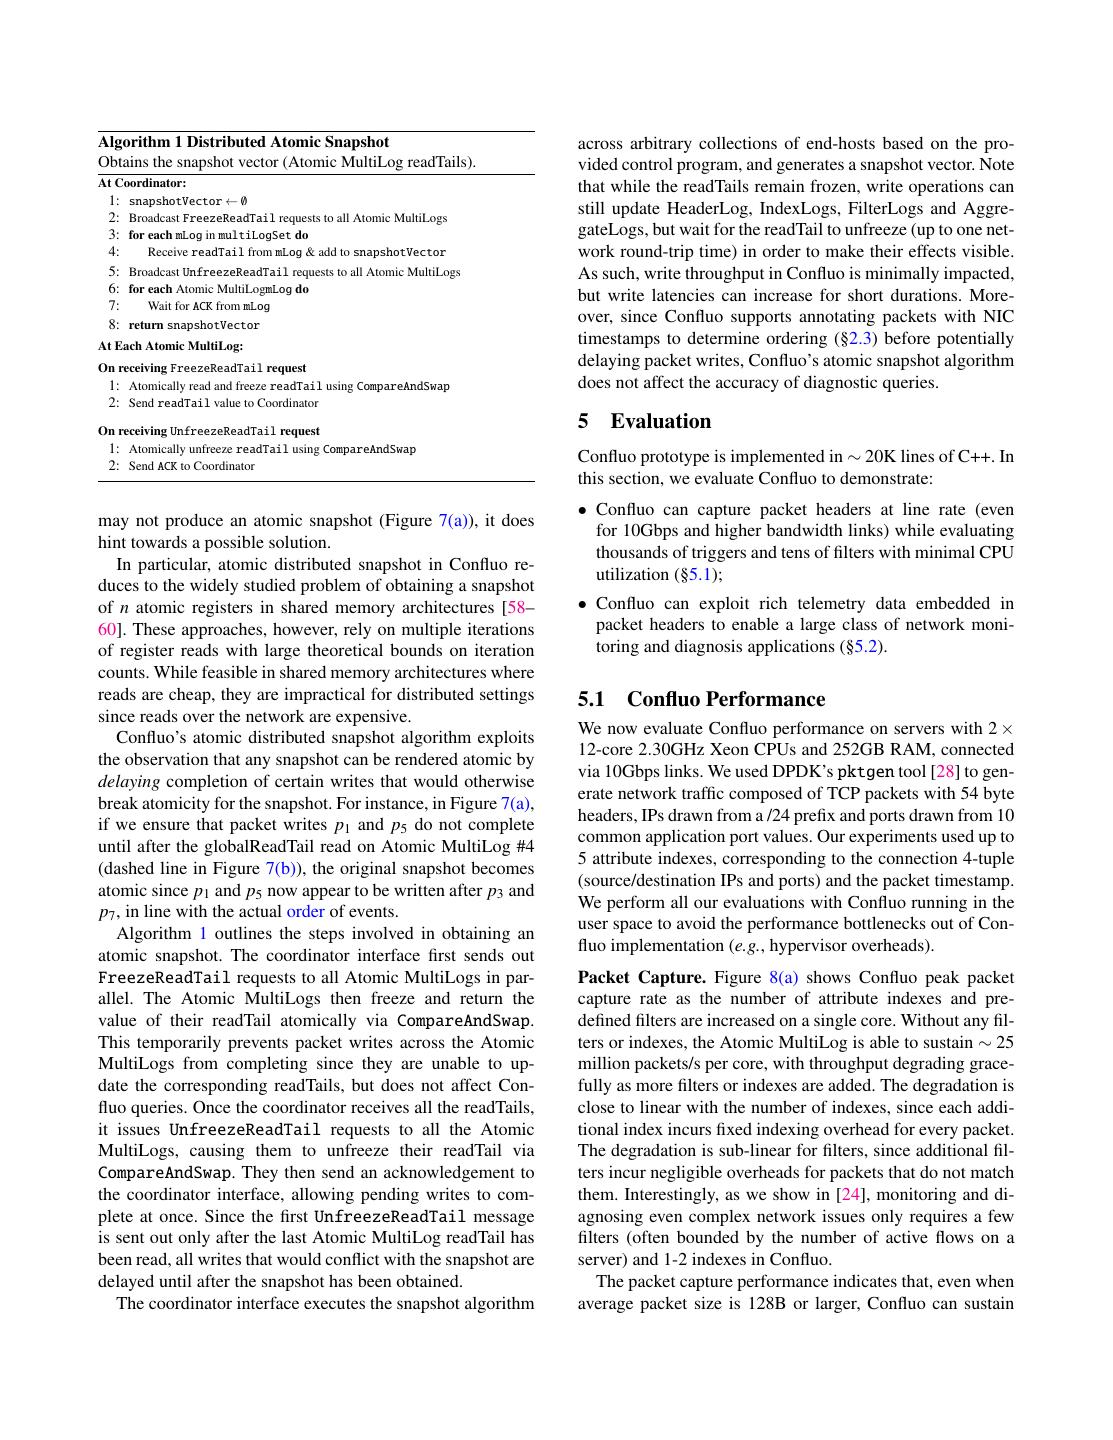
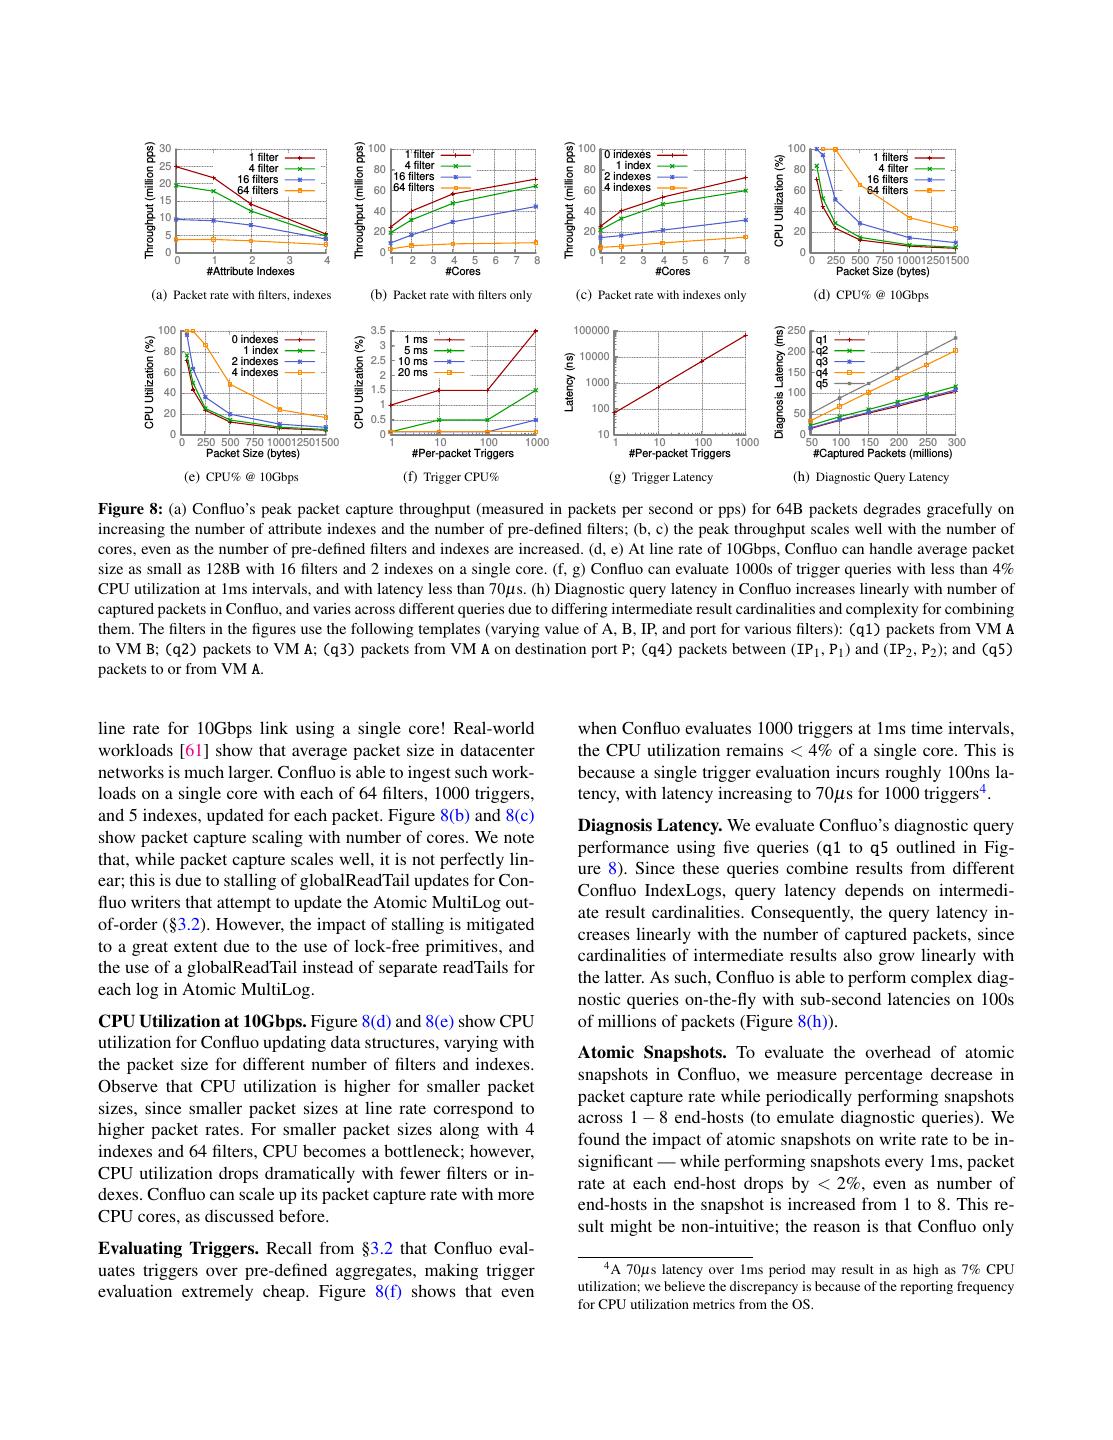
9 .Algorithm 1 Distributed Atomic Snapshot across arbitrary collections of end-hosts based on the pro- Obtains the snapshot vector (Atomic MultiLog readTails). vided control program, and generates a snapshot vector. Note At Coordinator: that while the readTails remain frozen, write operations can 1: snapshotVector ← 0/ 2: Broadcast FreezeReadTail requests to all Atomic MultiLogs still update HeaderLog, IndexLogs, FilterLogs and Aggre- 3: for each mLog in multiLogSet do gateLogs, but wait for the readTail to unfreeze (up to one net- 4: Receive readTail from mLog & add to snapshotVector work round-trip time) in order to make their effects visible. 5: Broadcast UnfreezeReadTail requests to all Atomic MultiLogs As such, write throughput in Confluo is minimally impacted, 6: for each Atomic MultiLogmLog do 7: Wait for ACK from mLog but write latencies can increase for short durations. More- 8: return snapshotVector over, since Confluo supports annotating packets with NIC At Each Atomic MultiLog: timestamps to determine ordering (§2.3) before potentially On receiving FreezeReadTail request delaying packet writes, Confluo’s atomic snapshot algorithm 1: Atomically read and freeze readTail using CompareAndSwap does not affect the accuracy of diagnostic queries. 2: Send readTail value to Coordinator On receiving UnfreezeReadTail request 5 Evaluation 1: Atomically unfreeze readTail using CompareAndSwap 2: Send ACK to Coordinator Confluo prototype is implemented in ∼ 20K lines of C++. In this section, we evaluate Confluo to demonstrate: • Confluo can capture packet headers at line rate (even may not produce an atomic snapshot (Figure 7(a)), it does for 10Gbps and higher bandwidth links) while evaluating hint towards a possible solution. thousands of triggers and tens of filters with minimal CPU In particular, atomic distributed snapshot in Confluo re- utilization (§5.1); duces to the widely studied problem of obtaining a snapshot of n atomic registers in shared memory architectures [58– • Confluo can exploit rich telemetry data embedded in 60]. These approaches, however, rely on multiple iterations packet headers to enable a large class of network moni- of register reads with large theoretical bounds on iteration toring and diagnosis applications (§5.2). counts. While feasible in shared memory architectures where reads are cheap, they are impractical for distributed settings 5.1 Confluo Performance since reads over the network are expensive. We now evaluate Confluo performance on servers with 2 × Confluo’s atomic distributed snapshot algorithm exploits 12-core 2.30GHz Xeon CPUs and 252GB RAM, connected the observation that any snapshot can be rendered atomic by via 10Gbps links. We used DPDK’s pktgen tool [28] to gen- delaying completion of certain writes that would otherwise erate network traffic composed of TCP packets with 54 byte break atomicity for the snapshot. For instance, in Figure 7(a), headers, IPs drawn from a /24 prefix and ports drawn from 10 if we ensure that packet writes p1 and p5 do not complete common application port values. Our experiments used up to until after the globalReadTail read on Atomic MultiLog #4 5 attribute indexes, corresponding to the connection 4-tuple (dashed line in Figure 7(b)), the original snapshot becomes (source/destination IPs and ports) and the packet timestamp. atomic since p1 and p5 now appear to be written after p3 and We perform all our evaluations with Confluo running in the p7 , in line with the actual order of events. user space to avoid the performance bottlenecks out of Con- Algorithm 1 outlines the steps involved in obtaining an fluo implementation (e.g., hypervisor overheads). atomic snapshot. The coordinator interface first sends out FreezeReadTail requests to all Atomic MultiLogs in par- Packet Capture. Figure 8(a) shows Confluo peak packet allel. The Atomic MultiLogs then freeze and return the capture rate as the number of attribute indexes and pre- value of their readTail atomically via CompareAndSwap. defined filters are increased on a single core. Without any fil- This temporarily prevents packet writes across the Atomic ters or indexes, the Atomic MultiLog is able to sustain ∼ 25 MultiLogs from completing since they are unable to up- million packets/s per core, with throughput degrading grace- date the corresponding readTails, but does not affect Con- fully as more filters or indexes are added. The degradation is fluo queries. Once the coordinator receives all the readTails, close to linear with the number of indexes, since each addi- it issues UnfreezeReadTail requests to all the Atomic tional index incurs fixed indexing overhead for every packet. MultiLogs, causing them to unfreeze their readTail via The degradation is sub-linear for filters, since additional fil- CompareAndSwap. They then send an acknowledgement to ters incur negligible overheads for packets that do not match the coordinator interface, allowing pending writes to com- them. Interestingly, as we show in [24], monitoring and di- plete at once. Since the first UnfreezeReadTail message agnosing even complex network issues only requires a few is sent out only after the last Atomic MultiLog readTail has filters (often bounded by the number of active flows on a been read, all writes that would conflict with the snapshot are server) and 1-2 indexes in Confluo. delayed until after the snapshot has been obtained. The packet capture performance indicates that, even when The coordinator interface executes the snapshot algorithm average packet size is 128B or larger, Confluo can sustain
10 . Throughput (million pps) Throughput (million pps) Throughput (million pps) 30 100 100 100 1 filter 1 filter 0 indexes 1 filters CPU Utilization (%) 25 4 filter 80 4 filter 80 1 index 80 4 filter 16 filters 16 filters 2 indexes 16 filters 20 64 filters 60 64 filters 60 4 indexes 60 64 filters 15 40 40 40 10 5 20 20 20 0 0 0 0 0 1 2 3 4 1 2 3 4 5 6 7 8 1 2 3 4 5 6 7 8 0 250 500 750 100012501500 #Attribute Indexes #Cores #Cores Packet Size (bytes) (a) Packet rate with filters, indexes (b) Packet rate with filters only (c) Packet rate with indexes only (d) CPU% @ 10Gbps Diagnosis Latency (ms) 100 3.5 100000 250 0 indexes 1 ms q1 CPU Utilization (%) CPU Utilization (%) 1 index 3 5 ms 80 10000 200 q2 Latency (ns) 2 indexes 2.5 10 ms q3 60 4 indexes 2 20 ms 150 q4 1000 q5 40 1.5 100 1 100 20 50 0.5 0 0 10 0 0 250 500 750 100012501500 1 10 100 1000 1 10 100 1000 50 100 150 200 250 300 Packet Size (bytes) #Per-packet Triggers #Per-packet Triggers #Captured Packets (millions) (e) CPU% @ 10Gbps (f) Trigger CPU% (g) Trigger Latency (h) Diagnostic Query Latency Figure 8: (a) Confluo’s peak packet capture throughput (measured in packets per second or pps) for 64B packets degrades gracefully on increasing the number of attribute indexes and the number of pre-defined filters; (b, c) the peak throughput scales well with the number of cores, even as the number of pre-defined filters and indexes are increased. (d, e) At line rate of 10Gbps, Confluo can handle average packet size as small as 128B with 16 filters and 2 indexes on a single core. (f, g) Confluo can evaluate 1000s of trigger queries with less than 4% CPU utilization at 1ms intervals, and with latency less than 70µs. (h) Diagnostic query latency in Confluo increases linearly with number of captured packets in Confluo, and varies across different queries due to differing intermediate result cardinalities and complexity for combining them. The filters in the figures use the following templates (varying value of A, B, IP, and port for various filters): (q1) packets from VM A to VM B; (q2) packets to VM A; (q3) packets from VM A on destination port P; (q4) packets between (IP1 , P1 ) and (IP2 , P2 ); and (q5) packets to or from VM A. line rate for 10Gbps link using a single core! Real-world when Confluo evaluates 1000 triggers at 1ms time intervals, workloads [61] show that average packet size in datacenter the CPU utilization remains < 4% of a single core. This is networks is much larger. Confluo is able to ingest such work- because a single trigger evaluation incurs roughly 100ns la- loads on a single core with each of 64 filters, 1000 triggers, tency, with latency increasing to 70µs for 1000 triggers4 . and 5 indexes, updated for each packet. Figure 8(b) and 8(c) Diagnosis Latency. We evaluate Confluo’s diagnostic query show packet capture scaling with number of cores. We note performance using five queries (q1 to q5 outlined in Fig- that, while packet capture scales well, it is not perfectly lin- ure 8). Since these queries combine results from different ear; this is due to stalling of globalReadTail updates for Con- Confluo IndexLogs, query latency depends on intermedi- fluo writers that attempt to update the Atomic MultiLog out- ate result cardinalities. Consequently, the query latency in- of-order (§3.2). However, the impact of stalling is mitigated creases linearly with the number of captured packets, since to a great extent due to the use of lock-free primitives, and cardinalities of intermediate results also grow linearly with the use of a globalReadTail instead of separate readTails for the latter. As such, Confluo is able to perform complex diag- each log in Atomic MultiLog. nostic queries on-the-fly with sub-second latencies on 100s CPU Utilization at 10Gbps. Figure 8(d) and 8(e) show CPU of millions of packets (Figure 8(h)). utilization for Confluo updating data structures, varying with Atomic Snapshots. To evaluate the overhead of atomic the packet size for different number of filters and indexes. snapshots in Confluo, we measure percentage decrease in Observe that CPU utilization is higher for smaller packet packet capture rate while periodically performing snapshots sizes, since smaller packet sizes at line rate correspond to across 1 − 8 end-hosts (to emulate diagnostic queries). We higher packet rates. For smaller packet sizes along with 4 found the impact of atomic snapshots on write rate to be in- indexes and 64 filters, CPU becomes a bottleneck; however, significant — while performing snapshots every 1ms, packet CPU utilization drops dramatically with fewer filters or in- rate at each end-host drops by < 2%, even as number of dexes. Confluo can scale up its packet capture rate with more end-hosts in the snapshot is increased from 1 to 8. This re- CPU cores, as discussed before. sult might be non-intuitive; the reason is that Confluo only Evaluating Triggers. Recall from §3.2 that Confluo eval- 4 A 70µs latency over 1ms period may result in as high as 7% CPU uates triggers over pre-defined aggregates, making trigger evaluation extremely cheap. Figure 8(f) shows that even utilization; we believe the discrepancy is because of the reporting frequency for CPU utilization metrics from the OS.
11 .blocks updates to the globalReadTail during the snapshot op- 20 100 eration — bulk of the writes including those to HeaderLog, 90 1 filter Query Execution Latency (ms) 80 10 filters 15 IndexLogs and FilterLogs can still proceed, with entire set of 70 60 100 filters 10 Atomic Snapshot CDF Connection Setup pending globalReadTail updates going through at once when 50 40 5 the snapshot operation completes. 30 20 10 0 We note that a diagnostic query that spans multiple servers 0 1 2 4 8 16 32 64 128 0 2 4 6 8 10 12 Number of competing flows (k) would incur the end-host query execution latency shown in Batch latency (microseconds) Figure 8(h), as well as the atomic snapshot latency. Since (a) Path Conformance (b) Packet Losses at a Single Switch the snapshot algorithm queries different Atomic MultiLogs across different end-hosts in parallel, the snapshot is ob- flow1 flow2 flow3 tained in roughly 1 network round-trip (about ∼ 180µs in S S our setup), with slightly higher latencies across larger num- Priority(flow1) < Priority(flow2) ber of end-hosts due to skew in queuing and scheduling de- Priority(flow2) = Priority(flow3) Packet drops for flow1 at S, S lays (about 1.2ms for 128 end-hosts). Since network-wide E1 E2 E3 E4 diagnosis tasks often only involve a very small fraction of a data center’s end-hosts, Confluo can employ switch metadata (c) Packet Losses at Multiple Switches to isolate the end-hosts it needs to query, similar to [9]. Figure 9: (a) Confluo can perform 100 path conformance checks and ingest packet headers in batches of size 32 in about 11µs per- 5.2 Confluo Applications batch (∼ 350ns per-packet); (b) Diagnosis latency for packet losses We now use Confluo to detect and debug a variety of network due to traffic congestion; most of the time is spent in connection setup. Confluo takes < 18ms for querying 128 hosts. (c) Setup used issues in modern data center networks. Our setup (compris- for monitoring and diagnosing packet losses at multiple switches. ing 96 virtual machines and Pica8 P-3297 switches), deploy- ment and workloads are exactly the same as those in [8, 9], data in packet headers (switch IDs and timestamps) to iden- but with the end-host stack replaced with Confluo. Conse- tify contending TCP flows and their destination end-points. quently, our setup inherits (1) in-network mechanisms that Confluo is able to detect the presence of packet loss due to embed switch ID and timestamp at each switch traversed by TCP retransmissions in under 1ms (trigger periodicity), and a packet in its header, and (2) switch pointers to end hosts the coordinator interface receives the alert within ∼ 250µs. where the telemetry data for packets processed by the switch Figure 9(b) shows the diagnosis latency at the coordinator are stored. While we present only a subset of Confluo appli- as the number of competing flows (k) at switch S increases. cations here for brevity, we discuss more applications in [24]. With more flows, Confluo has to contact more end-hosts to collect diagnostic information. Even while collecting diag- Path Conformance. We demonstrate Confluo’s ability to nostic information across 128 end-hosts, the time taken to quickly monitor and debug path conformance violations by obtain the atomic snapshot and performing the diagnostic randomly routing a subset of the packets within a flow via a query at the coordinator are only 1.2 ms and 3 ms respec- particular switch S. Each end-host is configured with a sin- tively. Most of the diagnosis time is spent in establishing gle filter that matches packets that passes through switch S. connections to the relevant end-hosts, although this can be A companion trigger to the filter raises an alert if the count mitigated via connection pooling. Even so, Confluo is able of packets satisfying the filter is non-zero. Confluo monitor to diagnose the issue across 128 hosts in under 18 ms. evaluates the trigger at 1 ms intervals, and alerts the pres- ence of path non-conformant packets within milliseconds of Packet Losses at Multiple Switches. We now consider a its incidence at the end-host. scenario where a flow experiences packet losses at multiple Figure 9(a) shows the latency in Confluo with varying switches, as outlined Figure 9(c). Again, we detect packet number of path conformance checks (filters). We note that losses using TCP retransmissions, and employ telemetry data while a single conformance check incurs average batch la- embedded in packet headers (switch IDs) to aid diagnosis. tency of 1µs, 100 checks incur 11µs latency; this indicates Using ideas discussed in [8, 9], we issue diagnostic queries sub-linear increase in latency with the number of checks. to determine the flow information (IDs, traffic volume and As such, Confluo is able to perform per-packet path confor- priorities) that contended with flow1 at switches S and S . mance checks with minimal overheads. By comparing the traffic volume and priorities of contending flows, Confluo concludes that the losses for flow1 are due to Packet Losses at a Single Switch. In this application, we contention with higher priority flow2 and flow3 at switches consider monitoring and diagnosis for generalized versions S and S . Confluo takes roughly 1.8ms for the end-to-end di- of the scenarios from Figure 2 (left), where k flows compete agnosis: 1.15ms for connection setup, 180µs for the snap- at a common output port at switch S and one or more of these shot algorithm and 350µs for performing the actual query. flows experience packet losses. Confluo’s approach is out- lined in Figure 2 (right). Confluo exploits network telemetry TCP Outcast. In TCP outcast problem [62], two sets of
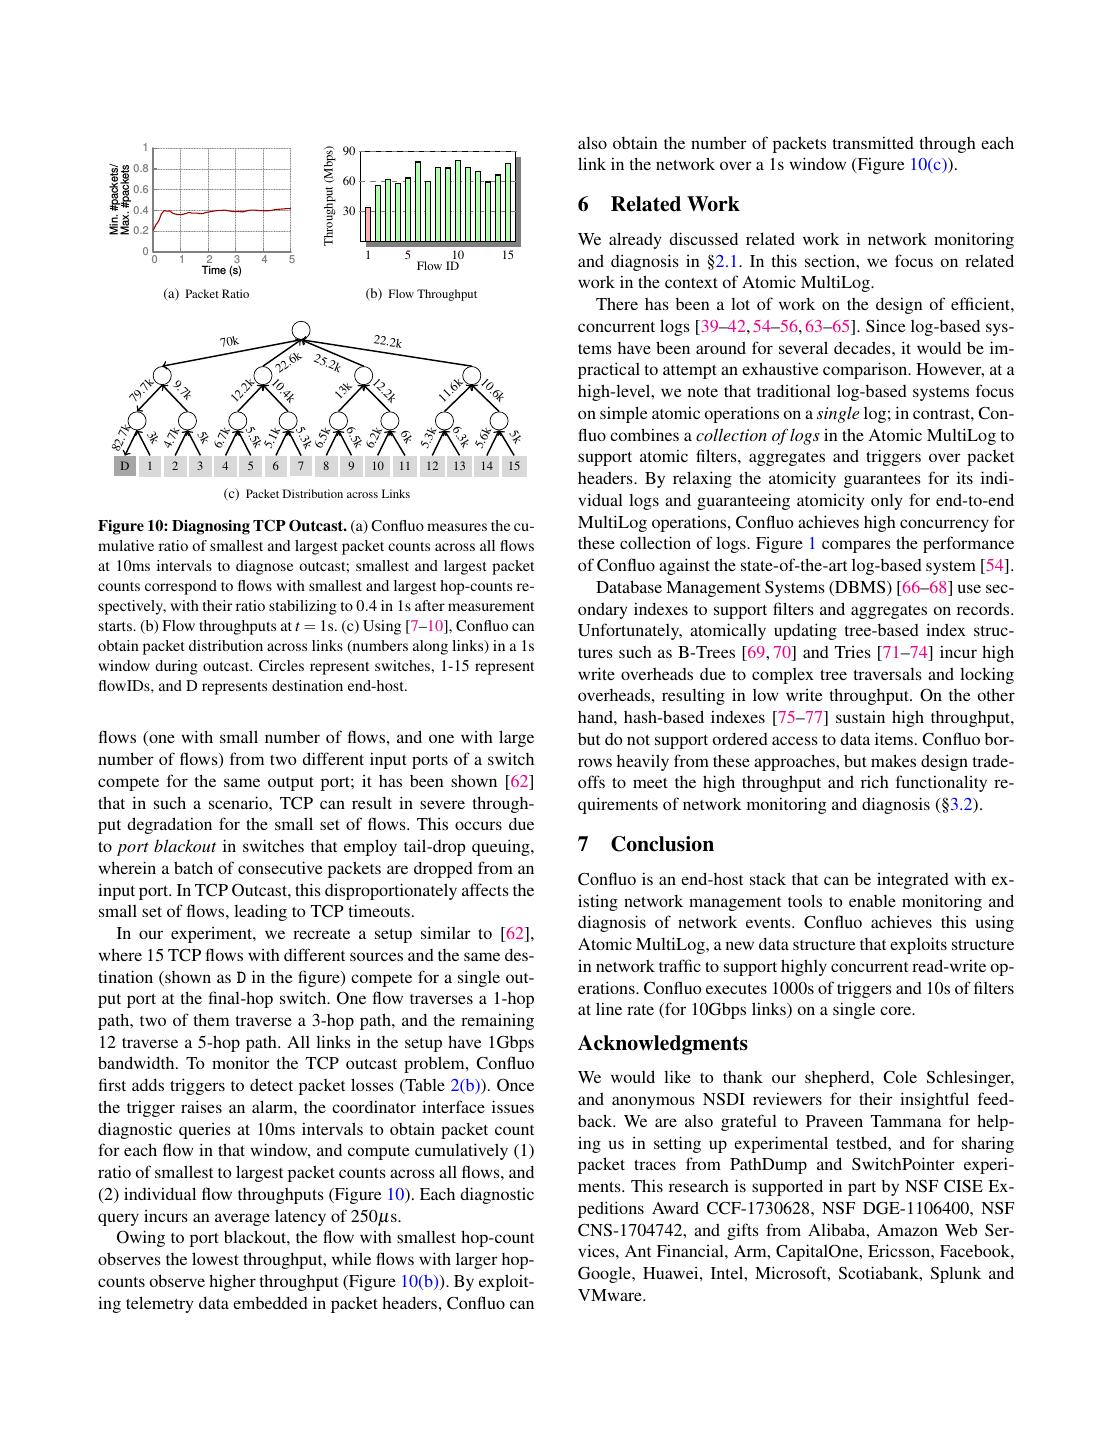
12 . 1 also obtain the number of packets transmitted through each Throughput (Mbps) 90 0.8 link in the network over a 1s window (Figure 10(c)). Min. #packets/ Max. #packets 60 0.6 0.4 30 6 Related Work 0.2 We already discussed related work in network monitoring 0 1 5 10 15 0 1 2 3 Time (s) 4 5 Flow ID and diagnosis in §2.1. In this section, we focus on related work in the context of Atomic MultiLog. (a) Packet Ratio (b) Flow Throughput There has been a lot of work on the design of efficient, concurrent logs [39–42, 54–56, 63–65]. Since log-based sys- 70k 22.2k tems have been around for several decades, it would be im- .6k 25.2k 22 practical to attempt an exhaustive comparison. However, at a k 10 k 2k 10 12 .6 .6 9. high-level, we note that traditional log-based systems focus k .7 11 k 13 7k .2 . .4 79 12 k k on simple atomic operations on a single log; in contrast, Con- 7k fluo combines a collection of logs in the Atomic MultiLog to 6.5 5.5 6.3 k k k k k k k 5.3 6k 5k 5k 3k 5.1 6.5 6.2 4.7 6.7 5.3 5.6 82. k k k k D 1 2 3 4 5 6 7 8 9 10 11 12 13 14 15 support atomic filters, aggregates and triggers over packet headers. By relaxing the atomicity guarantees for its indi- (c) Packet Distribution across Links vidual logs and guaranteeing atomicity only for end-to-end Figure 10: Diagnosing TCP Outcast. (a) Confluo measures the cu- MultiLog operations, Confluo achieves high concurrency for mulative ratio of smallest and largest packet counts across all flows these collection of logs. Figure 1 compares the performance at 10ms intervals to diagnose outcast; smallest and largest packet of Confluo against the state-of-the-art log-based system [54]. counts correspond to flows with smallest and largest hop-counts re- Database Management Systems (DBMS) [66–68] use sec- spectively, with their ratio stabilizing to 0.4 in 1s after measurement ondary indexes to support filters and aggregates on records. starts. (b) Flow throughputs at t = 1s. (c) Using [7–10], Confluo can Unfortunately, atomically updating tree-based index struc- obtain packet distribution across links (numbers along links) in a 1s tures such as B-Trees [69, 70] and Tries [71–74] incur high window during outcast. Circles represent switches, 1-15 represent write overheads due to complex tree traversals and locking flowIDs, and D represents destination end-host. overheads, resulting in low write throughput. On the other hand, hash-based indexes [75–77] sustain high throughput, flows (one with small number of flows, and one with large but do not support ordered access to data items. Confluo bor- number of flows) from two different input ports of a switch rows heavily from these approaches, but makes design trade- compete for the same output port; it has been shown [62] offs to meet the high throughput and rich functionality re- that in such a scenario, TCP can result in severe through- quirements of network monitoring and diagnosis (§3.2). put degradation for the small set of flows. This occurs due to port blackout in switches that employ tail-drop queuing, 7 Conclusion wherein a batch of consecutive packets are dropped from an Confluo is an end-host stack that can be integrated with ex- input port. In TCP Outcast, this disproportionately affects the isting network management tools to enable monitoring and small set of flows, leading to TCP timeouts. diagnosis of network events. Confluo achieves this using In our experiment, we recreate a setup similar to [62], Atomic MultiLog, a new data structure that exploits structure where 15 TCP flows with different sources and the same des- in network traffic to support highly concurrent read-write op- tination (shown as D in the figure) compete for a single out- erations. Confluo executes 1000s of triggers and 10s of filters put port at the final-hop switch. One flow traverses a 1-hop at line rate (for 10Gbps links) on a single core. path, two of them traverse a 3-hop path, and the remaining 12 traverse a 5-hop path. All links in the setup have 1Gbps Acknowledgments bandwidth. To monitor the TCP outcast problem, Confluo first adds triggers to detect packet losses (Table 2(b)). Once We would like to thank our shepherd, Cole Schlesinger, the trigger raises an alarm, the coordinator interface issues and anonymous NSDI reviewers for their insightful feed- diagnostic queries at 10ms intervals to obtain packet count back. We are also grateful to Praveen Tammana for help- for each flow in that window, and compute cumulatively (1) ing us in setting up experimental testbed, and for sharing ratio of smallest to largest packet counts across all flows, and packet traces from PathDump and SwitchPointer experi- (2) individual flow throughputs (Figure 10). Each diagnostic ments. This research is supported in part by NSF CISE Ex- query incurs an average latency of 250µs. peditions Award CCF-1730628, NSF DGE-1106400, NSF Owing to port blackout, the flow with smallest hop-count CNS-1704742, and gifts from Alibaba, Amazon Web Ser- observes the lowest throughput, while flows with larger hop- vices, Ant Financial, Arm, CapitalOne, Ericsson, Facebook, counts observe higher throughput (Figure 10(b)). By exploit- Google, Huawei, Intel, Microsoft, Scotiabank, Splunk and ing telemetry data embedded in packet headers, Confluo can VMware.
13 .References [15] N. Handigol, B. Heller, V. Jeyakumar, D. Mazières, and N. McKeown, “I Know What Your Packet Did [1] S. Narayana, A. Sivaraman, V. Nathan, P. Goyal, Last Hop: Using Packet Histories to Troubleshoot Net- V. Arun, M. Alizadeh, V. Jeyakumar, and C. Kim, works,” in USENIX NSDI, 2014. “Language-Directed Hardware Design for Network Performance Monitoring,” in ACM SIGCOMM, 2017. [16] J. Rasley, B. Stephens, C. Dixon, E. Rozner, W. Fel- ter, K. Agarwal, J. Carter, and R. Fonseca, “Planck: [2] Q. Huang, X. Jin, P. P. C. Lee, R. Li, L. Tang, Y.-C. Millisecond-scale monitoring and control for commod- Chen, and G. Zhang, “SketchVisor: Robust Network ity networks,” in ACM SIGCOMM, 2014. Measurement for Software Packet Processing,” in ACM SIGCOMM, 2017. [17] Y. Zhu, N. Kang, J. Cao, A. Greenberg, G. Lu, R. Ma- hajan, D. Maltz, L. Yuan, M. Zhang, B. Y. Zhao, and [3] Y. Li, R. Miao, C. Kim, and M. Yu, “Flowradar: a better H. Zheng, “Packet-Level Telemetry in Large Datacen- netflow for data centers,” in USENIX NSDI, 2016. ter Networks,” in ACM SIGCOMM, 2015. [4] Z. Liu, A. Manousis, G. Vorsanger, V. Sekar, and [18] B. Arzani, S. Ciraci, L. Chamon, Y. Zhu, H. H. Liu, V. Braverman, “One sketch to rule them all: Rethink- J. Padhye, B. T. Loo, and G. Outhred, “007: Democrat- ing network flow monitoring with UnivMon,” in ACM ically Finding the Cause of Packet Drops,” in USENIX SIGCOMM, 2016. NSDI, 2018. [5] M. Yu, L. Jose, and R. Miao, “Software defined traf- [19] “OpenSOC.” http://opensoc.github.io/. fic measurement with opensketch,” in USENIX NSDI, 2013. [20] “Tigon.” http://tigon.io. [6] V. Jeyakumar, M. Alizadeh, Y. Geng, C. Kim, and [21] C. Cranor, T. Johnson, O. Spataschek, and D. Mazières, “Millions of Little Minions: Using Pack- V. Shkapenyuk, “Gigascope: A Stream Database ets for Low Latency Network Programming and Visi- for Network Applications,” in ACM SIGMOD, 2003. bility,” in ACM SIGCOMM, 2014. [22] M. Sullivan, “Tribeca: A Stream Database Manager for [7] P. Tammana, R. Agarwal, and M. Lee, “CherryPick: Network Traffic Analysis,” in VLDB, 1996. Tracing Packet Trajectory in Software-Defined Data- center Networks,” in USENIX SOSR, 2015. [23] M. Moshref, M. Yu, R. Govindan, and A. Vahdat, “Trumpet: Timely and Precise Triggers in Data Cen- [8] P. Tammana, R. Agarwal, and M. Lee, “Simplifying ters,” in ACM SIGCOMM, 2016. Datacenter Network Debugging with PathDump,” in USENIX OSDI, 2016. [24] A. Khandelwal, R. Agarwal, and I. Stoica, “Confluo: [9] P. Tammana, R. Agarwal, and M. Lee, “Distributed Distributed Monitoring and Diagnosis Stack for High Network Monitoring and Debugging with Switch- Speed Networks.” Technical Report, 2018. Pointer,” in USENIX NSDI, 2018. [25] “Confluo GitHub Repository.” https://github.com/ [10] “In-band Network Telemetry (INT).” https://p4.org/ ucbrise/confluo. assets/INT-current-spec.pdf. [26] A. Panda, S. Han, K. Jang, M. Walls, S. Ratnasamy, and [11] A. Roy, H. Zeng, J. Bagga, and A. C. Snoeren, “Passive S. Shenker, “NetBricks: Taking the V out of NFV,” in Realtime Datacenter Fault Detection and Localization,” USENIX OSDI, 2016. in USENIX NSDI, 2017. [27] S. Han, K. Jang, A. Panda, S. Palkar, D. Han, and [12] H. Chen, N. Foster, J. Silverman, M. Whittaker, S. Ratnasamy, “SoftNIC: A Software NIC to Augment B. Zhang, and R. Zhang, “Felix: Implementing Traffic Hardware,” Tech. Rep. UCB/EECS-2015-155, EECS Measurement on End Hosts Using Program Analysis,” Department, University of California, Berkeley, 2015. in USENIX SOSR, 2016. [28] “The Pktgen Application.” https : / / pktgen . [13] S. Narayana, M. Tahmasbi, J. Rexford, and D. Walker, readthedocs.io/en/latest/. “Compiling Path Queries,” in USENIX NSDI, 2016. [29] G. Maier, R. Sommer, H. Dreger, A. Feldmann, V. Pax- [14] A. Gupta, R. Harrison, A. Pawar, M. Canini, N. Feam- son, and F. Schneider, “Enriching Network Security ster, J. Rexford, and W. Willinger, “Sonata: Query- Analysis with Time Travel,” in ACM SIGCOMM, 2008. Driven Streaming Network Telemetry,” in ACM SIG- COMM, 2018.
14 .[30] “Deepfield Defender.” http : / / deepfield . com / [47] “RocksDB Tuning Guide.” https : / / github . com / products/deepfield-defender/. facebook/rocksdb/wiki/RocksDB-Tuning-Guide. [31] “Kentik Detect.” https://www.kentik.com. [48] “Memtables in Cassandra.” https://wiki.apache. org/cassandra/MemtableSSTable. [32] F. Fusco, M. P. Stoecklin, and M. Vlachos, “NET-FLi: On-the-fly Compression, Archiving and Indexing of [49] “Configuring compaction in Cassandra.” https : / / Streaming Network Traffic,” VLDB, 2010. docs.datastax.com/en/cassandra/2.1/cassandra/ operations/ops_configure_compaction_t.html. [33] P. Giura and N. Memon, “NetStore: An Efficient Stor- age Infrastructure for Network Forensics and Monitor- [50] “SSTable and Log Structured Storage: Lev- ing,” in Springer-Verlag RAID, 2010. elDB.” https : / / www . igvita . com / 2012 / 02 / 06 / sstable-and-log-structured-storage-leveldb. [34] J. Lee, S. Lee, J. Lee, Y. Yi, and K. Park, “Flo- SIS: A Highly Scalable Network Flow Capture System [51] “SQLServer: Distributed Transactions (Database En- for Fast Retrieval and Storage Efficiency,” in USENIX gine).” https : / / technet . microsoft . com / en-us / ATC, 2015. library/ms191440(v=sql.105).aspx. [35] “The health insurance portability and accountability [52] “Oracle: Distributed Transactions Concepts.” https: act.” http://www.hhs.gov/ocr/privacy/. / / docs . oracle . com / cd / B10501 _ 01 / server . 920 / a96521/ds_txns.htm. [36] “Cisco Compliance Solution for HIPAA Security Rule Design and Implementation Guide.” https:// [53] “Postgres: eXtensible Transaction Manager.” https:// tinyurl.com/y94u8sqq. wiki.postgresql.org/wiki/DTM. [37] “Intel Data Plane Development Kit (DPDK).” http:// [54] M. Balakrishnan, D. Malkhi, V. Prabhakaran, T. Wob- dpdk.org. bler, M. Wei, and J. D. Davis, “CORFU: A Shared Log Design for Flash Clusters,” in USENIX NSDI, 2012. [38] “Open vSwitch (OVS).” http://openvswitch.org. [55] M. Balakrishnan, D. Malkhi, T. Wobber, M. Wu, [39] G. Golan-Gueta, E. Bortnikov, E. Hillel, and I. Kei- V. Prabhakaran, M. Wei, J. D. Davis, S. Rao, T. Zou, dar, “Scaling Concurrent Log-structured Data Stores,” and A. Zuck, “Tango: Distributed Data Structures over in ACM EuroSys, 2015. a Shared Log,” in ACM SOSP, 2013. [40] M. P. Herlihy and J. M. Wing, “Linearizability: A [56] M. Wei, A. Tai, C. J. Rossbach, I. Abraham, M. Mun- Correctness Condition for Concurrent Objects,” ACM shed, M. Dhawan, J. Stabile, U. Wieder, S. Fritchie, TOPLAS, 1990. S. Swanson, M. J. Freedman, and D. Malkhi, “vCorfu: [41] “A Fast Lock-Free Queue for C++.” A Cloud-Scale Object Store on a Shared Log,” in http : / / moodycamel . com / blog / 2013 / USENIX NSDI, 2017. a-fast-lock-free-queue-for-c++. [57] K. M. Chandy and L. Lamport, “Distributed Snap- [42] P. Tsigas and Y. Zhang, “A simple, fast and scalable shots: Determining Global States of Distributed Sys- non-blocking concurrent fifo queue for shared memory tems,” ACM TOCS, 1985. multiprocessor systems,” in ACM SPAA, 2001. [58] Y. Afek, H. Attiya, D. Dolev, E. Gafni, M. Merritt, [43] P. E. Black, “perfect k-ary tree.” https://www.nist. and N. Shavit, “Atomic Snapshots of Shared Memory,” gov/dads/HTML/perfectKaryTree.html. JACM, 1993. [44] “Disjunctive normal form.” https://en.wikipedia. [59] H. Attiya and O. Rachman, “Atomic Snapshots in O org/wiki/Disjunctive_normal_form. (N Log N) Operations,” SIAM Journal on Computing, 1998. [45] R. Agarwal, A. Khandelwal, and I. Stoica, “Succinct: Enabling Queries on Compressed Data,” in USENIX [60] H. Attiya, M. Herlihy, and O. Rachman, “Atomic Snap- NSDI, 2015. shots Using Lattice Agreement,” Springer-Verlag Dis- tributed Computing, 1995. [46] “Configuring compression in Cassandra.” https:// docs.datastax.com/en/cassandra/2.0/cassandra/ [61] T. A. Benson, A. Anand, A. Akella, and M. Zhang, operations/ops_config_compress_t.html. “Understanding Data Center Traffic Characteristics,” in ACM SIGCOMM CCR, 2009.
15 .[62] P. Prakash, A. Dixit, Y. C. Hu, and R. Kompella, “The [71] A. Prokopec, N. G. Bronson, P. Bagwell, and M. Oder- TCP Outcast Problem: Exposing Unfairness in Data sky, “Concurrent Tries with Efficient Non-blocking Center Networks,” in USENIX NSDI, 2012. Snapshots,” in ACM SIGPLAN PPoPP, 2012. [63] B. Chandramouli, G. Prasaad, D. Kossmann, J. Levan- [72] S. Heinz, J. Zobel, and H. E. Williams, “Burst tries: a doski, J. Hunter, and M. Barnett, “FASTER: A Concur- fast, efficient data structure for string keys,” ACM TOIS, rent Key-Value Store with In-Place Updates,” in ACM 2002. SIGMOD, 2018. [73] N. Askitis and R. Sinha, “HAT-trie: A Cache-conscious [64] “Lock-Free Programming.” https : / / www . cs . cmu . Trie-based Data Structure for Strings,” in ACSC, 2007. edu/~410-s05/lectures/L31_LockFree.pdf. [74] D. R. Morrison, “PATRICIA - Practical Algorithm To [65] I. Calciu, S. Sen, M. Balakrishnan, and M. K. Aguilera, Retrieve Information Coded in Alphanumeric,” JACM, “Black-box Concurrent Data Structures for NUMA Ar- 1968. chitectures,” in ACM ASPLOS, 2017. [75] “MySQL: Comparison of B-Tree and Hash Indexes.” [66] “Oracle Database.” https://www.oracle.com/index. https : / / dev . mysql . com / doc / refman / 5 . 5 / en / html. index-btree-hash.html. [67] “MySQL.” https://www.mysql.com. [76] “Oracle: About Hash Clusters.” https : / / docs . [68] “Microsoft SQL Server.” https://www.microsoft. oracle . com / cd / B28359 _ 01 / server . 111 / b28310 / com/en-us/sql-server/sql-server-2016. hash001.htm. [69] R. Bayer and E. McCreight, “Organization and Main- [77] “SQL Server: Hash Indexes.” https : / / docs . tenance of Large Ordered Indices,” in ACM SIGMOD, microsoft . com / en-us / sql / database-engine / 1970. hash-indexes. [70] A. Braginsky and E. Petrank, “A Lock-free B+Tree,” in ACM SPAA, 2012.
