- 快召唤伙伴们来围观吧
- 微博 QQ QQ空间 贴吧
- 文档嵌入链接
- <iframe src="https://www.slidestalk.com/u9099/Monitoring_PostgreSQL_with_Percona_Monitoring_and_Management_PMM?embed" frame border="0" width="640" height="360" scrolling="no" allowfullscreen="true">复制
- 微信扫一扫分享
使用Percona监控和管理(PMM)监控PostgreSQL
了解如何使用Percona监视和管理(PMM)监视PostgreSQL,以便您能够:
提高性能和瓶颈的可视性PostgreSQL
将PostgreSQL服务器整合到您已经用于MySQL和MongoDB的相同监控平台中
*在严重性1问题中更快、更高效地作出响应
我们将展示如何使用PMM对PostgreSQL的本机支持,您只需几分钟就可以集成PostgreSQL!
展开查看详情
1 .Monitoring PostgreSQL with PMM Avinash Vallarapu Percona
2 .What is PMM? ● Free, Open Source database troubleshooting and performance optimization platform for MySQL, MongoDB, and PostgreSQL ○ We also support: ■ ProxySQL ■ Amazon RDS MySQL & Aurora MySQL ■ Remote MySQL & PostgreSQL instances ● Runs in your secure environment (this is not a SaaS product!) and on your equipment ● Secured with SSL between client and server 2
3 .Amazon RDS and Aurora PostgreSQL
4 .Add Instances 4
5 .List Instances 5
6 . Remote PostgreSQL For when you don't have shell, or run an unsupported platform (eg. PostgreSQL on Windows)
7 .Add Remote Instances 7
8 .Command Line
9 .Command Line ● yum -y install pmm-client ● pmm-admin config --server 1.2.3.4 ● pmm-admin add postgresql ○ linux:metrics ○ postgresql:metrics 9
10 .Dashboards Multiple PostgreSQL Dashboards
11 .PostgreSQL Overview 11
12 .Using Grafana Alerting Alerting through Grafana
13 .Grafana Alerting ● Rules are added to graphs that react based on defined thresholds ● Alerts are sent to pre-defined Notification Channels ○ You can have multiple channels defined 13
14 .Grafana Alerting 14
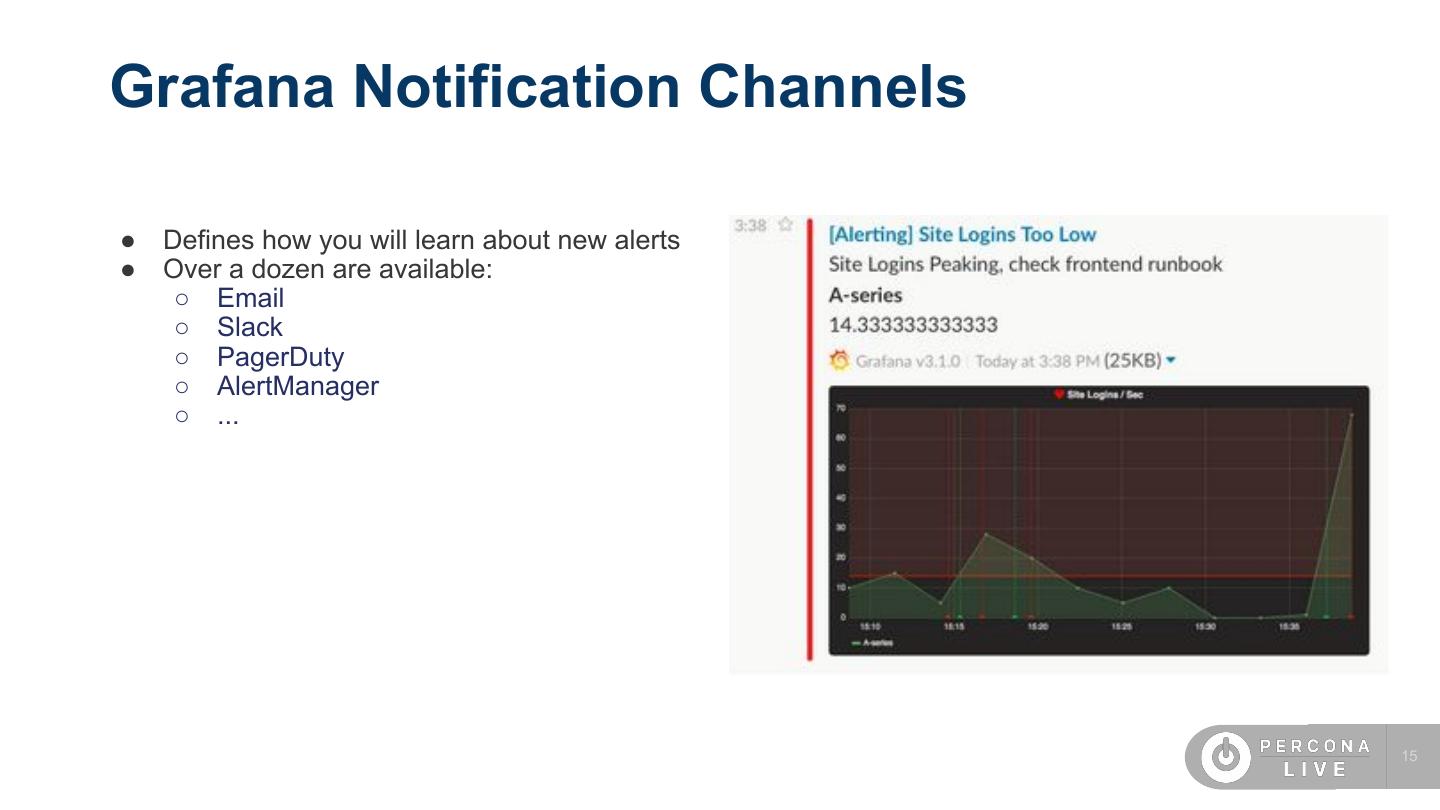
15 .Grafana Notification Channels ● Defines how you will learn about new alerts ● Over a dozen are available: ○ Email ○ Slack ○ PagerDuty ○ AlertManager ○ ... 15
16 .What's on the Roadmap? ● PostgreSQL Query Analytics ● Vacuum statistics ● Replication metrics 16
17 .Thank You to Our Sponsors
18 .Rate My Session 18
19 .Any Questions?


