- 快召唤伙伴们来围观吧
- 微博 QQ QQ空间 贴吧
- 文档嵌入链接
- <iframe src="https://www.slidestalk.com/u9348/Capacity_Planning_for_your_data_stores_1567062868868?embed" frame border="0" width="640" height="360" scrolling="no" allowfullscreen="true">复制
- 微信扫一扫分享
Capacity Planning for your data stores
数据存储的容量规划
展开查看详情
1 .Capacity planning for your data stores Colin Charles, Chief Evangelist, Percona Inc. colin.charles@percona.com / byte@bytebot.net http://bytebot.net/blog/ | @bytebot on Twitter rootconf.in, Bengaluru, Karnataka, India 12 May 2017
2 . License • Creative Commons BY-NC-SA 4.0 • https://creativecommons.org/licenses/by-nc-sa/4.0/legalcode
3 . Database, data store, etc. • Database: 1. a structured set of data held in a computer, especially one that is accessible in various ways. [Google] • Data store: A data store is a repository for persistently storing and managing collections of data which include not just repositories like databases, but also simpler store types such as simple files, emails etc. [Wikipedia]
4 . Presto, the Distributed SQL Query Engine for Big Data • Presto allows querying data where it lives, including Hive, Cassandra, relational databases or even proprietary data stores. A single Presto query can combine data from multiple sources, allowing for analytics across your entire organization. • Facebook uses Presto for interactive queries against several internal data stores, including their 300PB data warehouse. Over 1,000 Facebook employees use Presto daily to run more than 30,000 queries that in total scan over a petabyte each per day.
5 .Why capacity plan?
6 .
7 .
8 .By Colin Charles from Melbourne, Australia - Melanie C, CC BY-SA 2.0, https:// commons.wikimedia.org/w/index.php?curid=2000838
9 . Revenue Management • Cannot sell more than you actually have • Seat map: theatre, planes • Rooms: types, quantity
10 .
11 . Uptime Percentile target Max downtime per year 90% 36 days 99% 3.65 days 99.5% 1.83 days 99.9% 8.76 hours 99.99% 52.56 minutes 99.999% 5.25 minutes 99.9999% 31.5 seconds
12 . You can start now! • Start collecting metrics, NOW! • metric: standard of measurement • You need your baseline, your traffic patterns
13 . Baseline • How well is your current infrastructure working? • what is your QPS? QPS before performance degradation? QPS before performance degradation affects user experience? • What more will you need, in the (near) future, to maintain acceptable performance? • load that causes failure - alerting? Add/remove capacity, what do you expect? When do you spin up new resources/size new orders? • How do you manage the resources? • Iterate!
14 . MySQL world • Operating System • vmstat, netstat, df, ps, iostat, uptime • MySQL • SHOW [TABLE] STATUS, SHOW PROCESSLIST, INFORMATION_SCHEMA, PERFORMANCE_SCHEMA, slow query log, mytop/innotop
15 . Database specific watch points • QPS (SELECTs, INSERTs, UPDATEs, DELETEs) • Open connections • Lag time between masters/slaves • Cache hit rates
16 . Sharding • Sharding • Split your data across multiple nodes • Sharding alone isn’t enough, you need ability to split reads/writes • Tools: ProxySQL, Vitess, Tumblr JetPants, Tungsten Replicator
17 . Bottlenecks? • Bottleneck: reads or writes? • High CPU? • I/O? • Lag on replicas and the queries seem fine • Locking?
18 . Context-based metrics • pt-query-digest: https://www.percona.com/doc/percona-toolkit/3.0/ pt-query-digest.html • Analyse queries from logs, processlist, tcpdump • Box Anemometer: https://github.com/box/Anemometer • Analyse slow query logs to identify problematic queries • Commercial tools exist for this as well
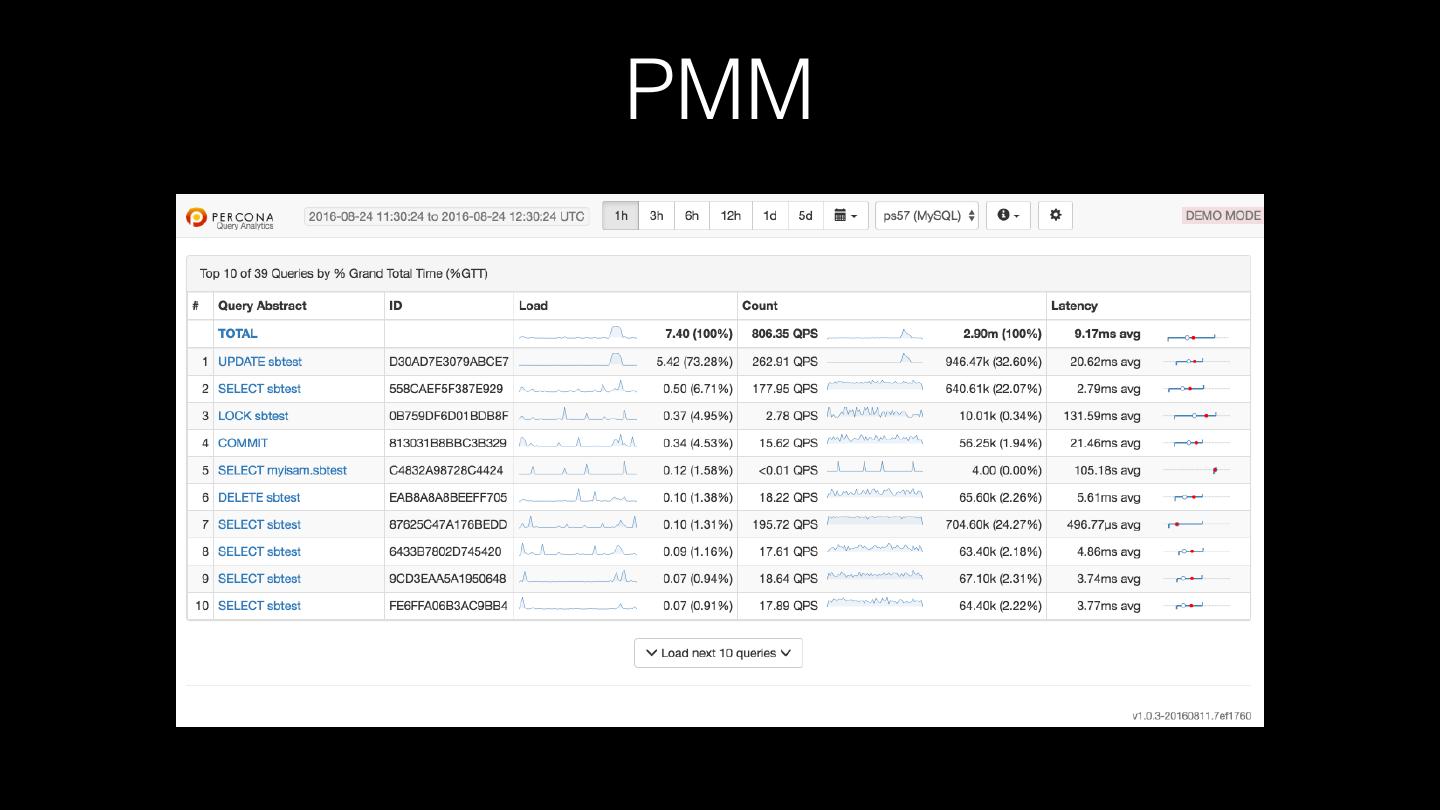
19 .Percona Monitoring & Management (PMM) • Query analytics + visualise it (w/sparklines, etc.) • Metrics monitor: OS & MySQL • Built on-top of open source: Prometheus, Consul, Grafana, Orchestrator • Get Docker container for “server”, get agent for “client” • http://pmmdemo.percona.com/
20 .PMM
21 .Understanding your workload better • Percona Lab Query Playback • https://github.com/Percona-Lab/query-playback • Query Playback is a tool for replaying the load of one database server to another • --slow-query-log --log-slow-admin-statements --log- slow-verbosity=microtime --long-query-time=0
22 . Load balancing • Do you just pick a random database server? • Load balancing strategies matter • Strategy: • Pick 2 random servers • Machine has less load? • Send request
23 . ProxySQL • Connection Pooling & • Query blocking (database Multiplexing aware firewall) • Read/Write Split and Sharding • Query mirroring (cache warming) • Seamless failover (including query rerouting), load balancing • Query throttling and timeouts • Query caching • Runtime reconfigurable • Query rewriting • Monitoring built-in
24 . ProxySQL comparison • http://www.proxysql.com/compare
25 . Storage capacity planning • Small single server deployment: 3-4x working capacity is not a bad option • size of database and data files (/var/lib/mysql) • size of largest table * 2 (for tmp/sort files) • size of each local logical backup • 5% free for OS • The above doesn’t make sense for large scale deployments naturally
26 . Prophet • Works by fitting time-series data to get a prediction of how that metric will look in future • Generalised Additive Model • Linear or logistic regression + additive model applied to regression • Paper: https://facebookincubator.github.io/prophet/static/ prophet_paper_20170113.pdf • Tip: have at least a year of data to fit the model (you may miss seasonal effects otherwise) • Tip: holidays (https://facebookincubator.github.io/prophet/docs/holiday_effects.html)
27 . Auto-scaling frameworks • Scalr • Amazon • Vertical: grow the instance • Horizontal: replicas • EC2: auto scaling + groups • Amazon RDS Aurora, Google Cloud Spanner, Azure Cosmos DB
28 .If done properly…
29 . In conclusion… • Capture the signal: high noise alerting systems fail due to human psychology • Revenue management, operations research, management science are good to read • Always be capturing metrics • Know your baseline and business requirements • Shard, load balance appropriately • Monitor! Be proactive not reactive


