- 快召唤伙伴们来围观吧
- 微博 QQ QQ空间 贴吧
- 文档嵌入链接
- 复制
- 微信扫一扫分享
- 已成功复制到剪贴板
PMM ARCHITECTURE
Percona Monitoring and Management Architecture
展开查看详情
1 .PMM ARCHITECTURE Mykola Marzhan
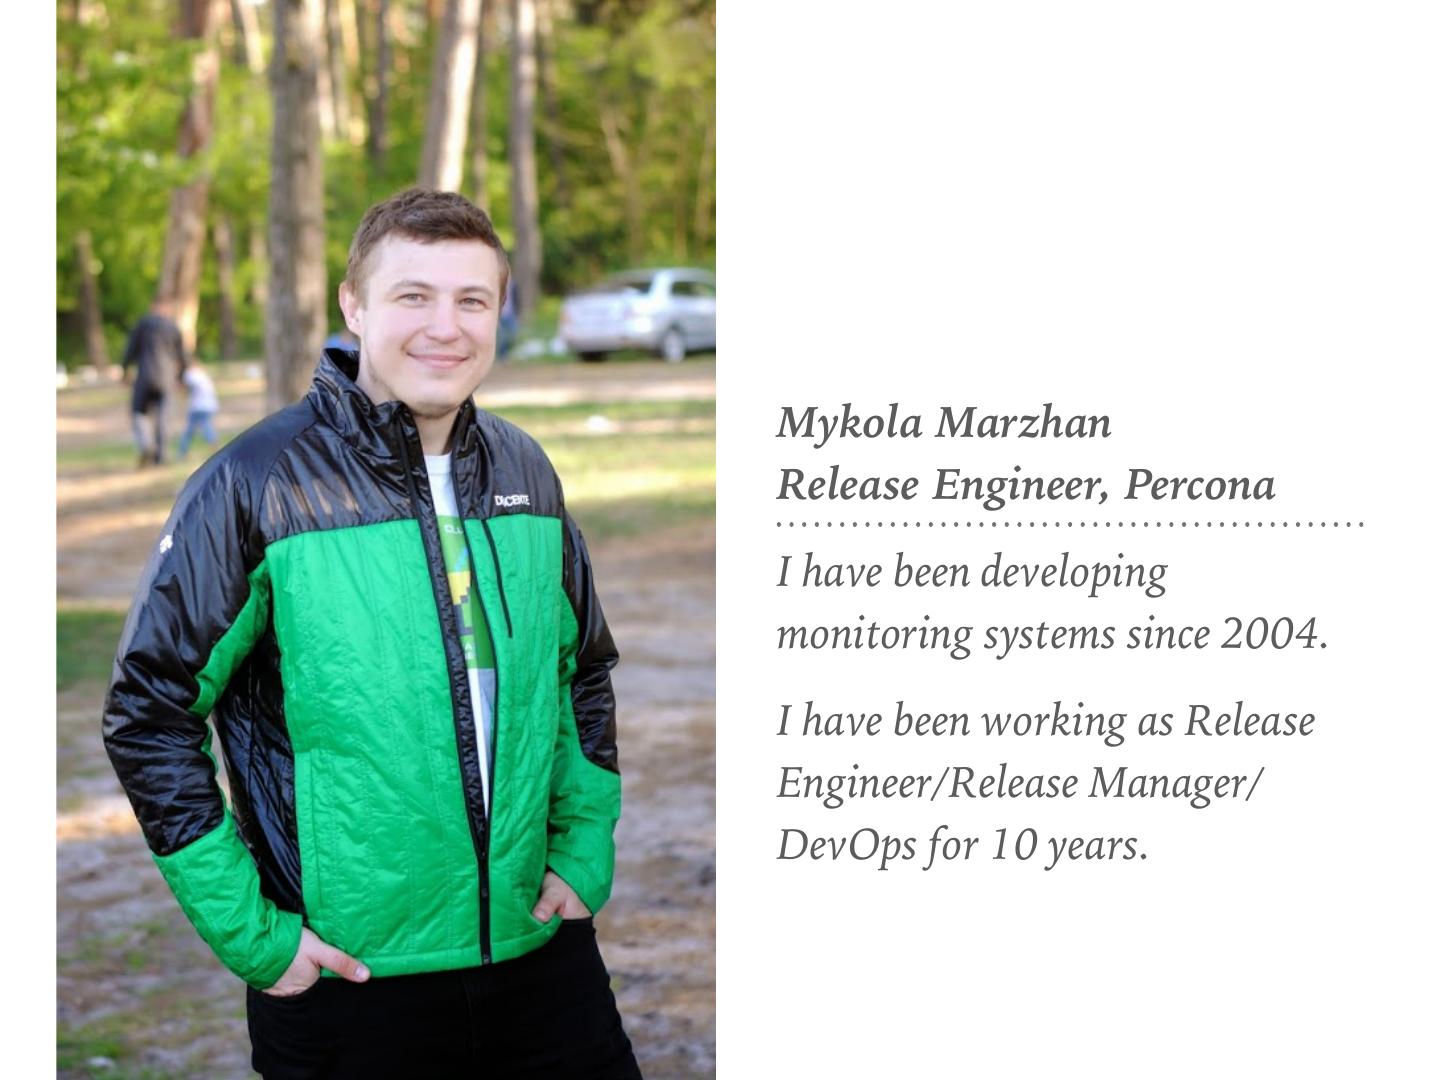
2 .Mykola Marzhan Release Engineer, Percona I have been developing monitoring systems since 2004. I have been working as Release Engineer/Release Manager/ DevOps for 10 years.
3 .is a free and open-source database troubleshooting and performance optimization platform for MySQL and MongoDB
4 .WHY YOU NEED PMM? ➤ You’re looking to Have your MySQL Queries Run Faster ➤ You want to troubleshoot sudden MySQL Performance Problem ➤ You want to find way to run more efficiently (use less Resources)
5 .WHY PMM THE BEST SOLUTION FOR YOU? ➤ simple to install (15 minutes or less) ➤ free, open source ➤ self-hosted ➤ communication via TLS/SSL
6 .PMM SERVER AWS AMI
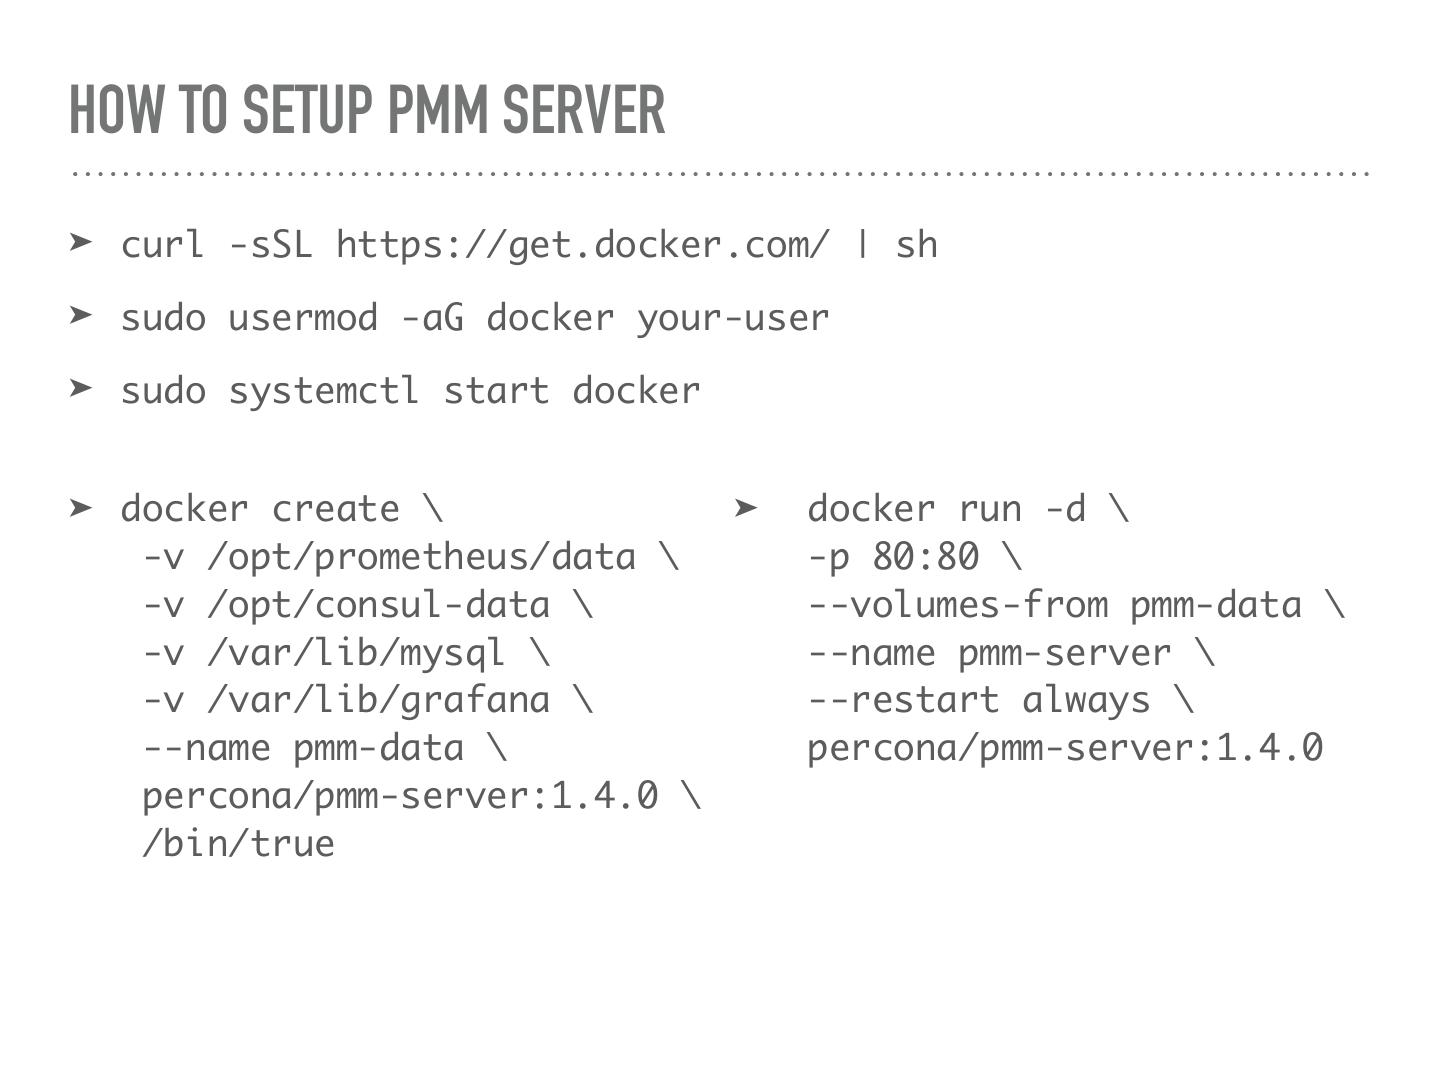
7 .HOW TO SETUP PMM SERVER ➤ curl -sSL https://get.docker.com/ | sh ➤ sudo usermod -aG docker your-user ➤ sudo systemctl start docker ➤ docker create \ ➤ docker run -d \ -v /opt/prometheus/data \ -p 80:80 \ -v /opt/consul-data \ --volumes-from pmm-data \ -v /var/lib/mysql \ --name pmm-server \ -v /var/lib/grafana \ --restart always \ --name pmm-data \ percona/pmm-server:1.4.0 percona/pmm-server:1.4.0 \ /bin/true
8 .PMM CLIENT ➤ TAR ➤ RPM ➤ RedHat/CentOS 6 ➤ RedHat/CentOS 7 ➤ DEB ➤ Debian 7 (Wheezy) ➤ Debian 8 (Jessie) ➤ Debian 9 (Stretch) (coming soon) ➤ Ubuntu 12.04 LTS (Precise Pangolin) ➤ Ubuntu 14.04 LTS (Trusty Tahr) ➤ Ubuntu 16.04 LTS (Xenial Xerus) ➤ Ubuntu 16.10 (Yakkety Yak)
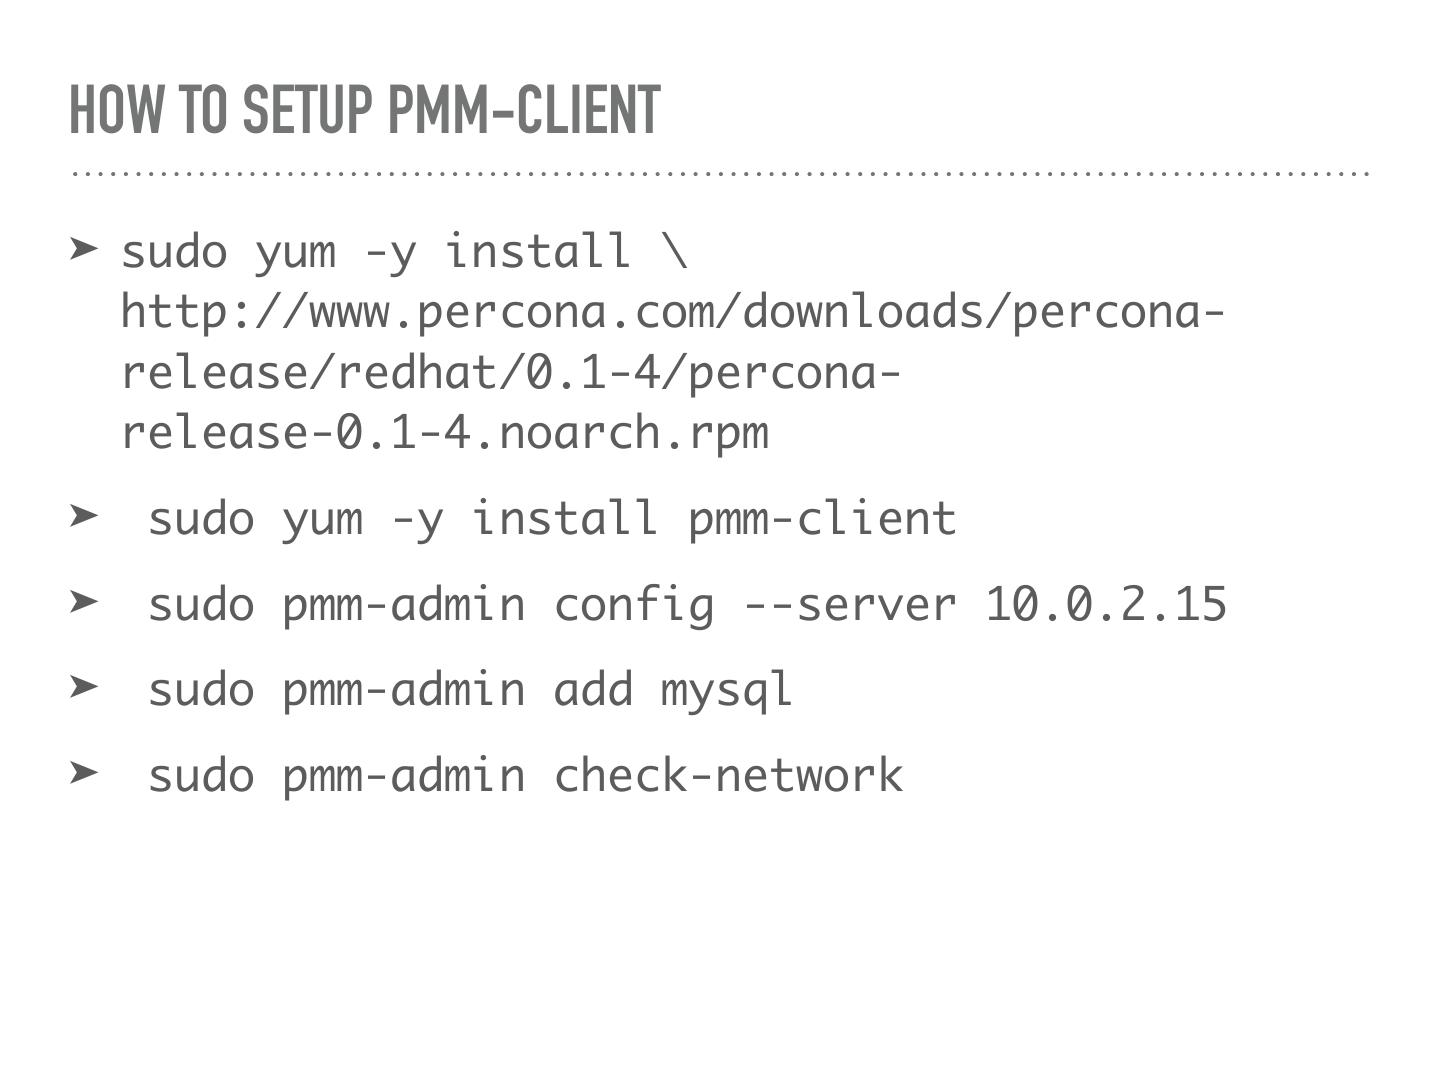
9 .HOW TO SETUP PMM-CLIENT ➤ sudo yum -y install \ http://www.percona.com/downloads/percona- release/redhat/0.1-4/percona- release-0.1-4.noarch.rpm ➤ sudo yum -y install pmm-client ➤ sudo pmm-admin config --server 10.0.2.15 ➤ sudo pmm-admin add mysql ➤ sudo pmm-admin check-network
10 .QUERY ANALYTICS METRICS MONITOR
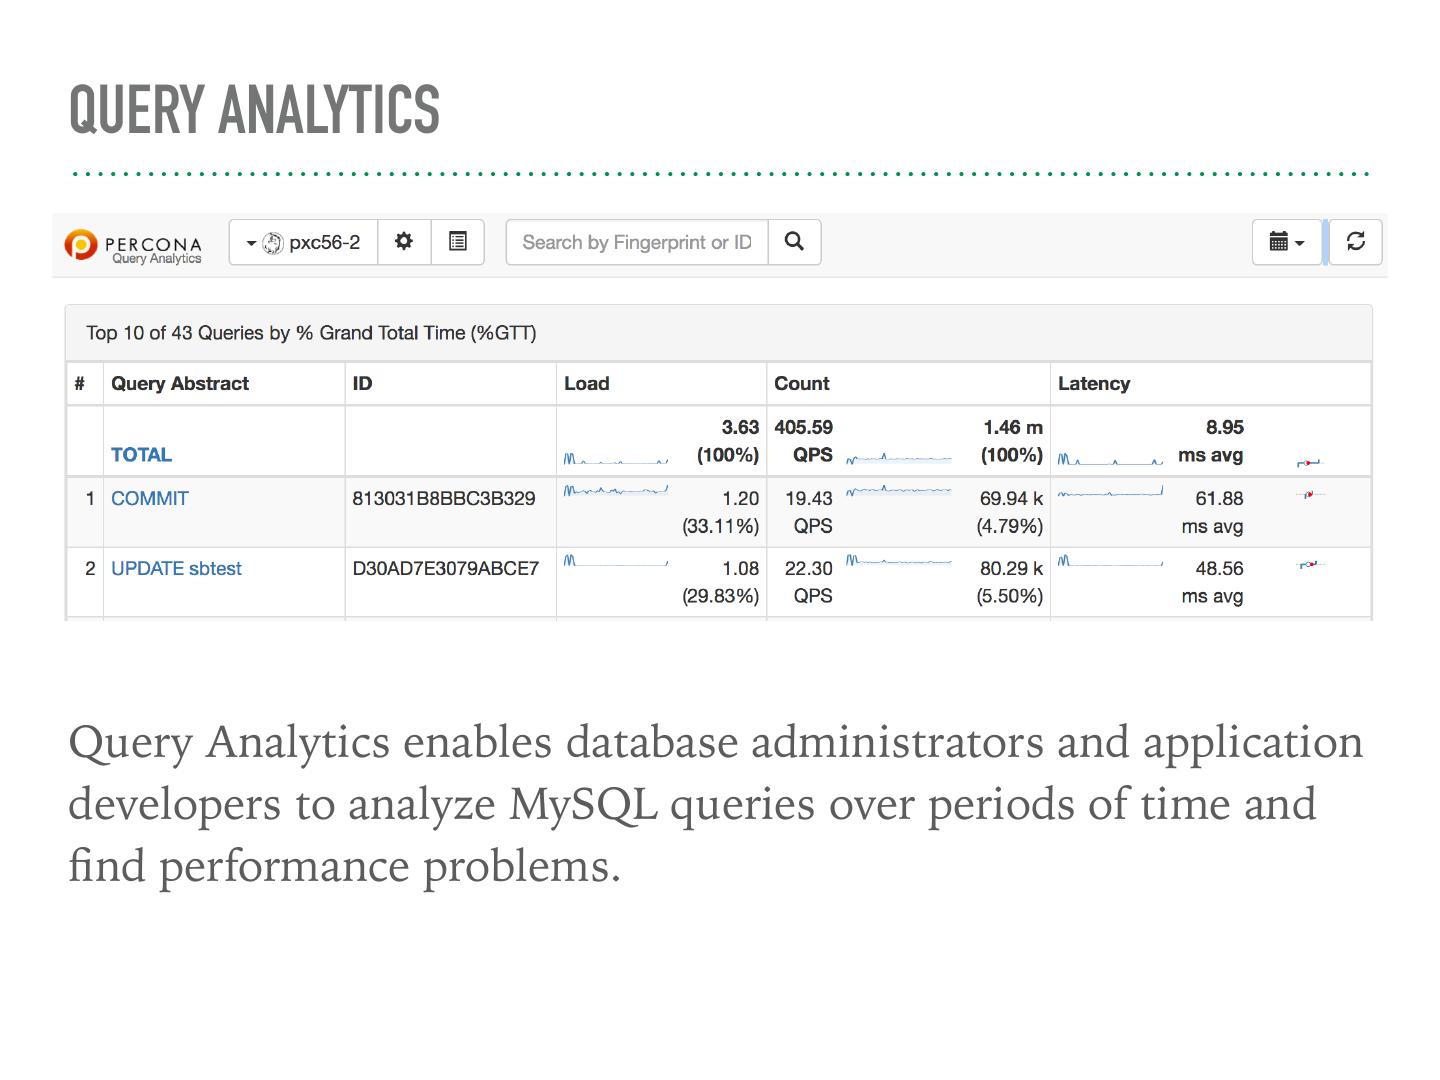
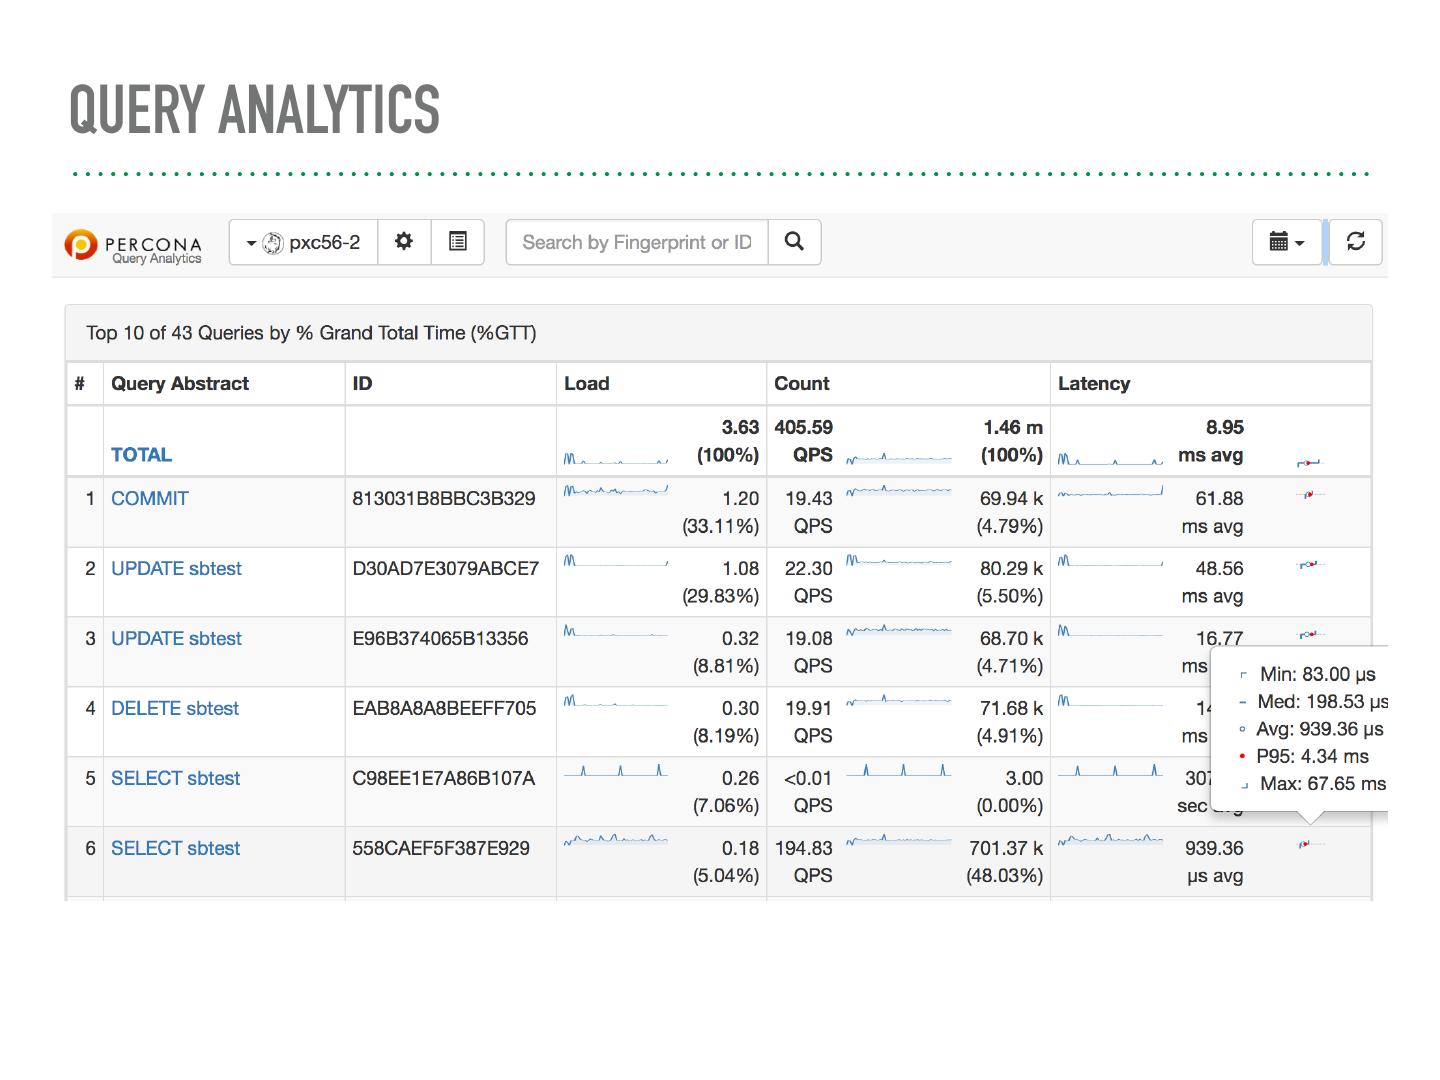
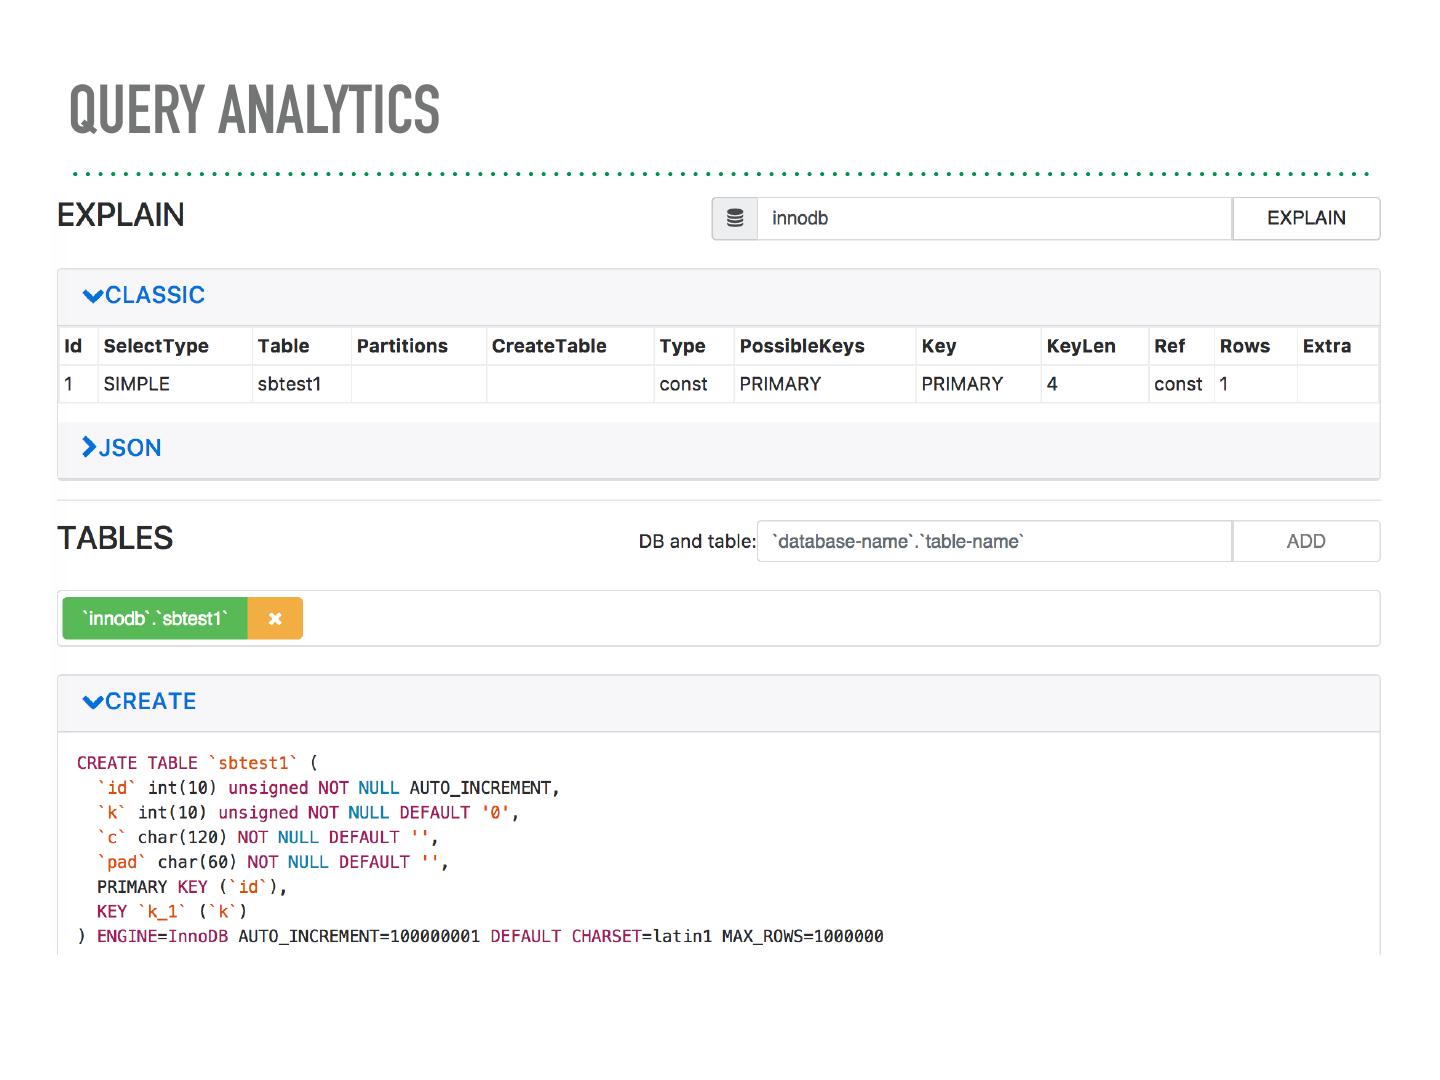
11 .QUERY ANALYTICS Query Analytics enables database administrators and application developers to analyze MySQL queries over periods of time and find performance problems.
12 .QUERY ANALYTICS
13 .
14 .QUERY ANALYTICS
15 .
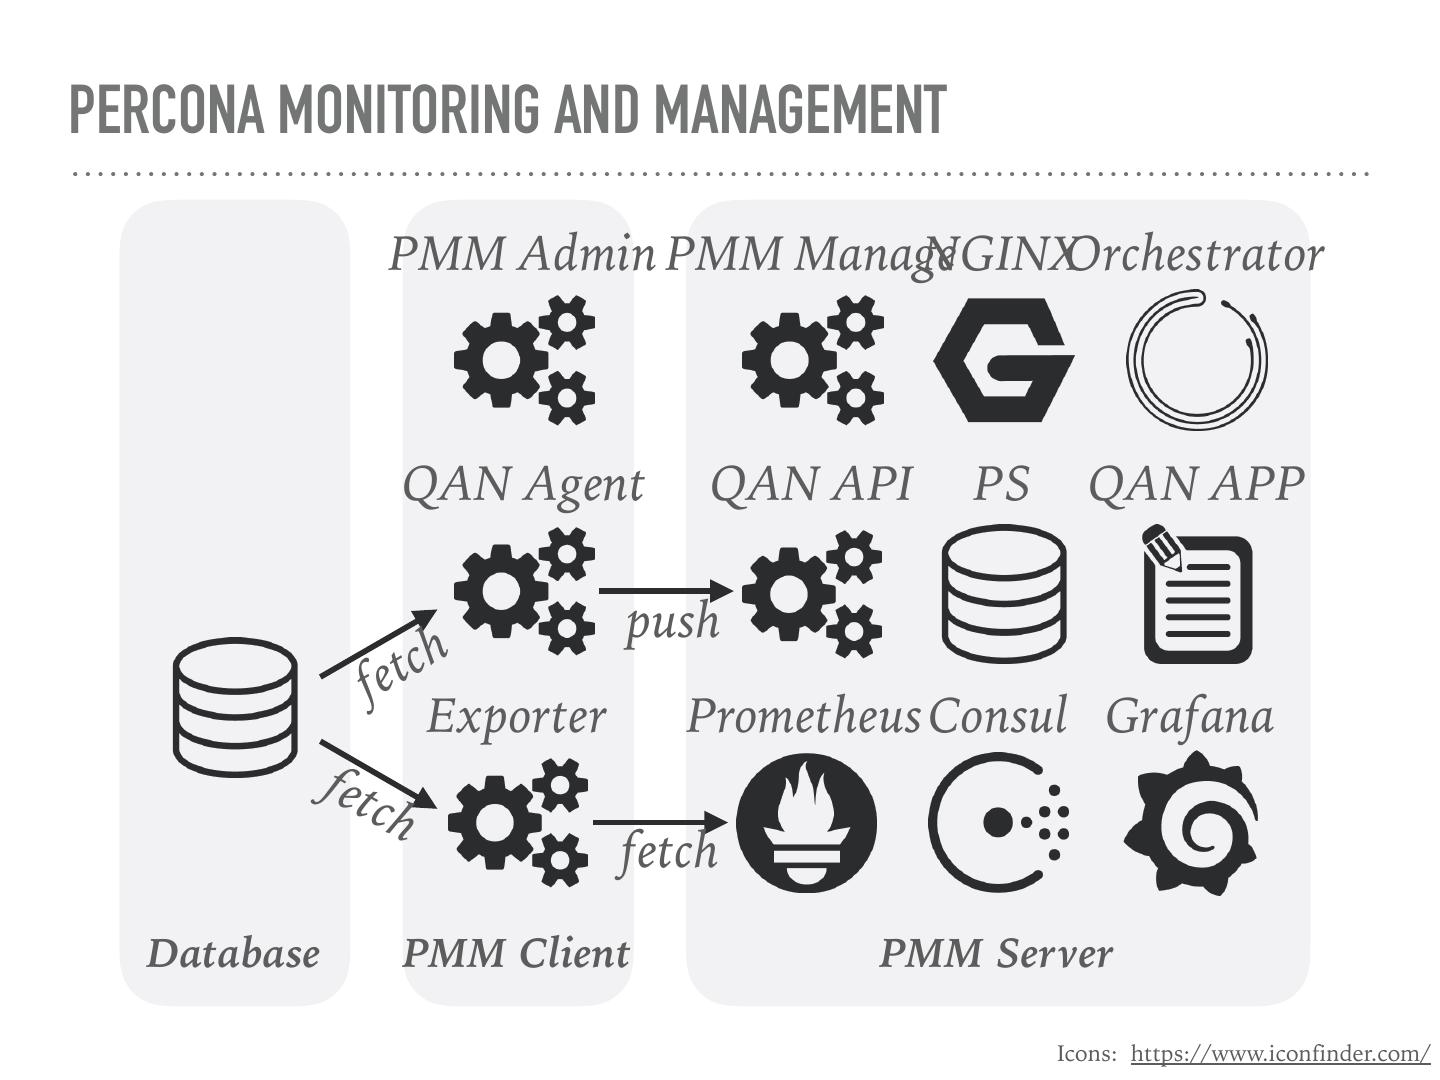
16 .QUERY ANALYTICS MySQL/ Percona MongoDB/ QAN-Agent QAN-API Server QAN-APP RDS for MySQL fetch push Database PMM Client PMM Server Icons: https://www.iconfinder.com/
17 .QAN AGENT Daemon (golang): ➤ connects to MySQL or MongoDB database ➤ reads queries from performance schema or slow log ➤ collects query performance data ➤ push data to QAN API ➤ developed by Percona
18 .QAN API Daemon, REST API service (golang): ➤ receive data from QAN Agent ➤ save data to Percona Server for MySQL database ➤ return data to QAN APP ➤ developed by Percona
19 .QAN APP Web Interface (AngularJS): ➤ show data from QAN API ➤ developed by Percona
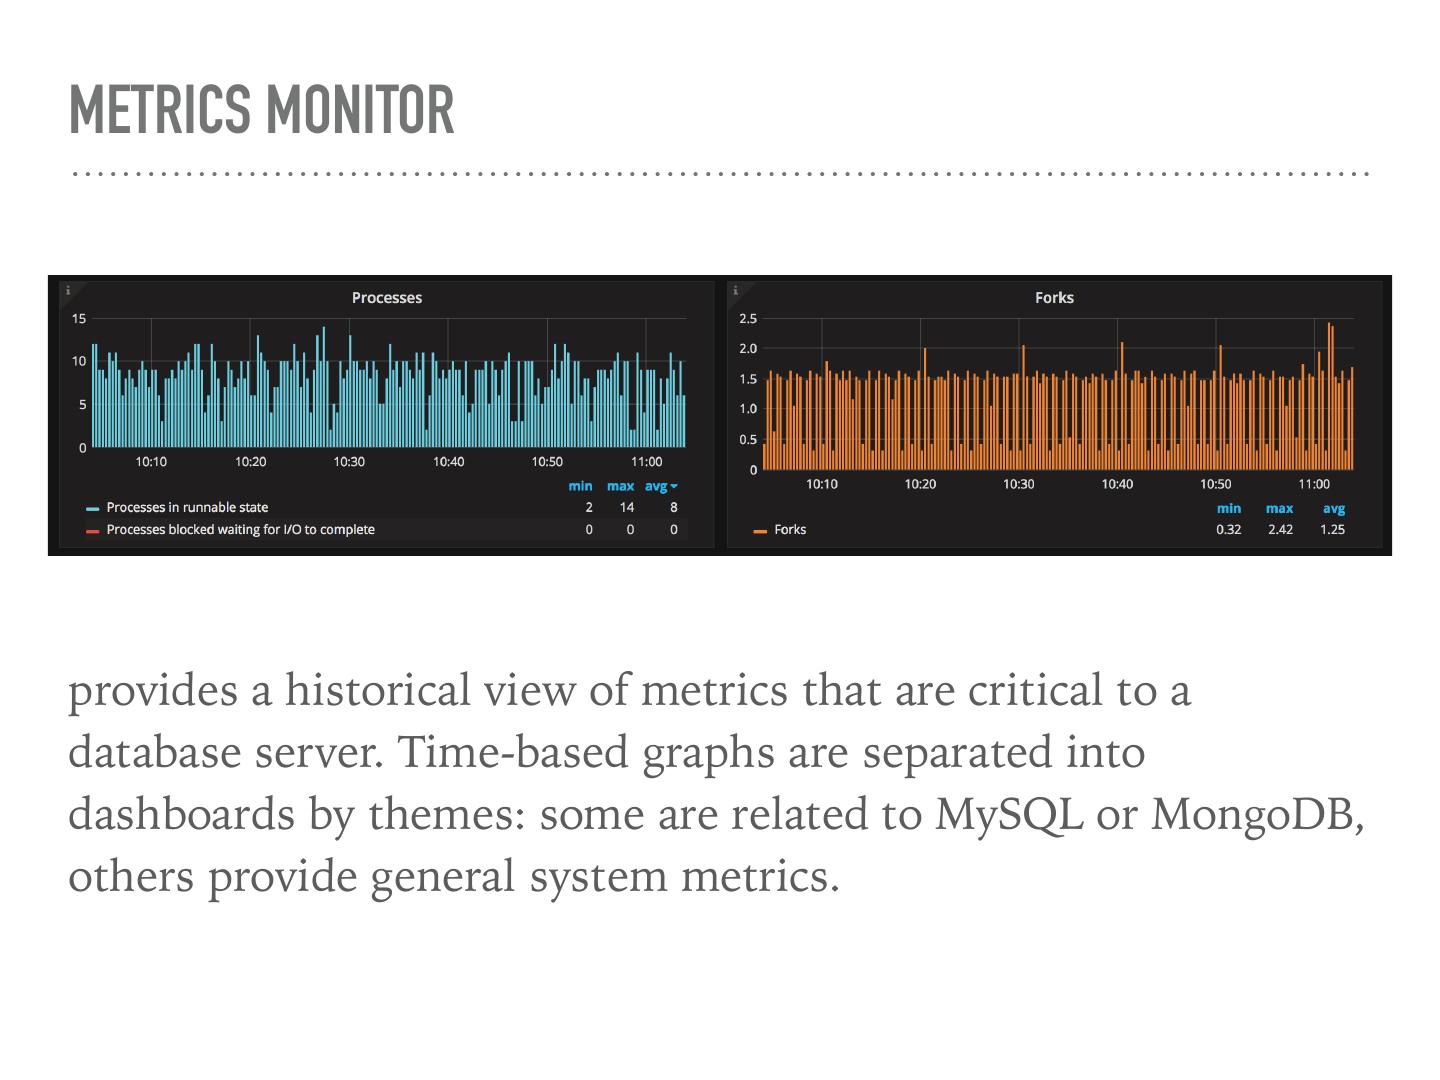
20 .METRICS MONITOR provides a historical view of metrics that are critical to a database server. Time-based graphs are separated into dashboards by themes: some are related to MySQL or MongoDB, others provide general system metrics.
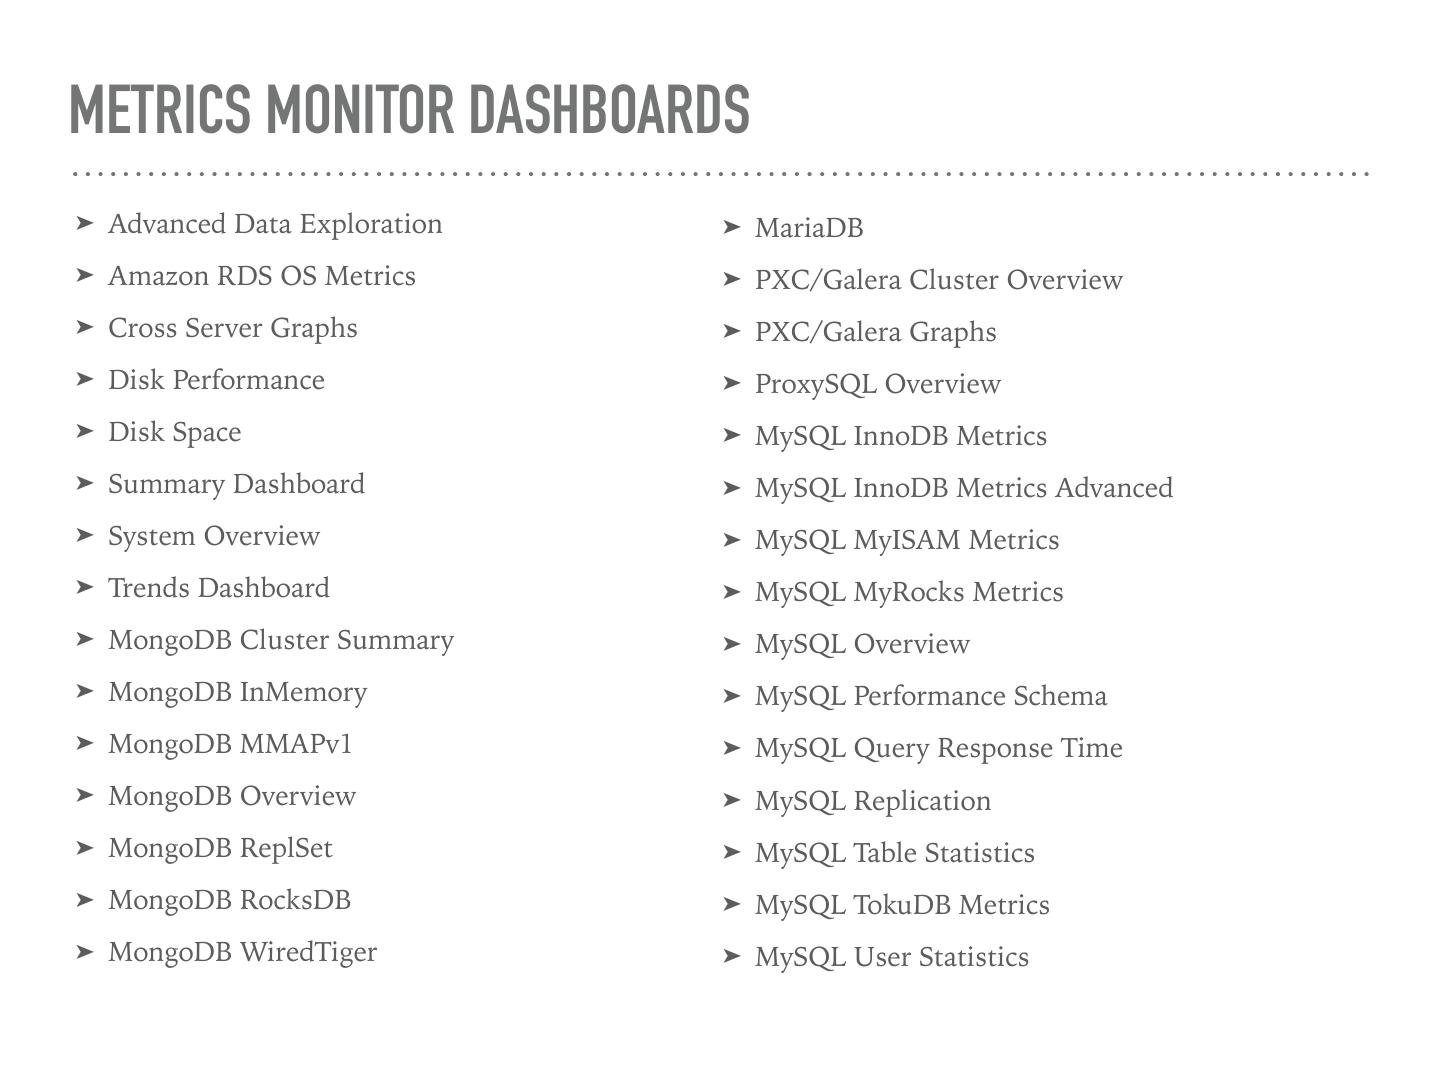
21 .METRICS MONITOR DASHBOARDS ➤ Advanced Data Exploration ➤ MariaDB ➤ Amazon RDS OS Metrics ➤ PXC/Galera Cluster Overview ➤ Cross Server Graphs ➤ PXC/Galera Graphs ➤ Disk Performance ➤ ProxySQL Overview ➤ Disk Space ➤ MySQL InnoDB Metrics ➤ Summary Dashboard ➤ MySQL InnoDB Metrics Advanced ➤ System Overview ➤ MySQL MyISAM Metrics ➤ Trends Dashboard ➤ MySQL MyRocks Metrics ➤ MongoDB Cluster Summary ➤ MySQL Overview ➤ MongoDB InMemory ➤ MySQL Performance Schema ➤ MongoDB MMAPv1 ➤ MySQL Query Response Time ➤ MongoDB Overview ➤ MySQL Replication ➤ MongoDB ReplSet ➤ MySQL Table Statistics ➤ MongoDB RocksDB ➤ MySQL TokuDB Metrics ➤ MongoDB WiredTiger ➤ MySQL User Statistics
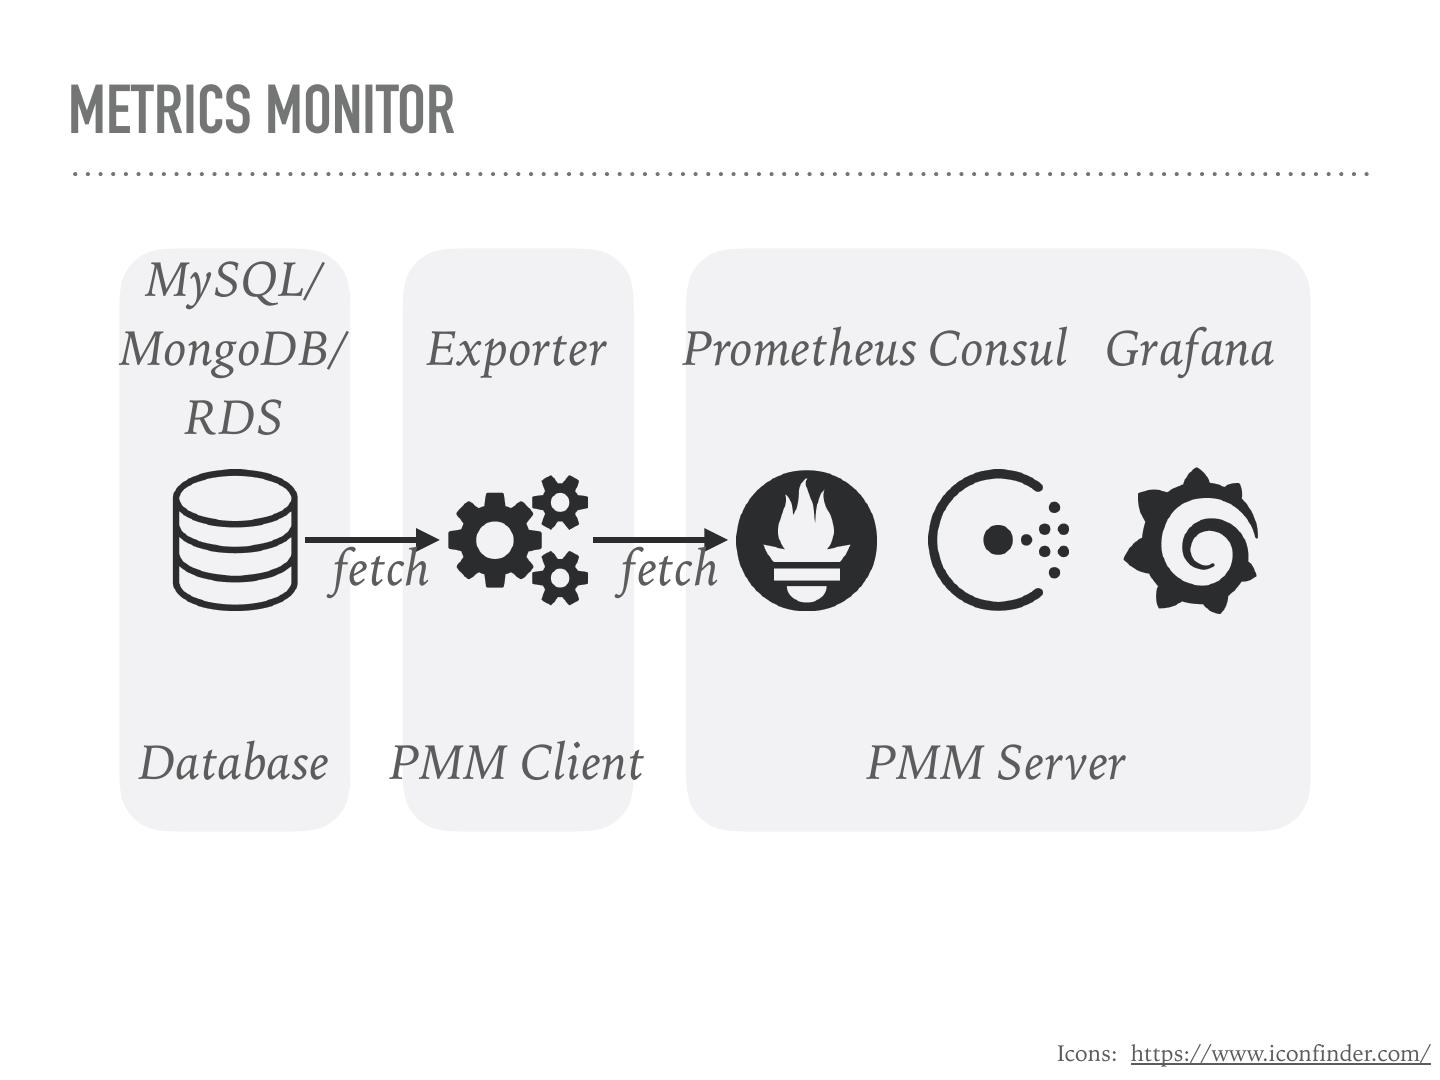
22 .METRICS MONITOR MySQL/ MongoDB/ Exporter Prometheus Consul Grafana RDS fetch fetch Database PMM Client PMM Server Icons: https://www.iconfinder.com/
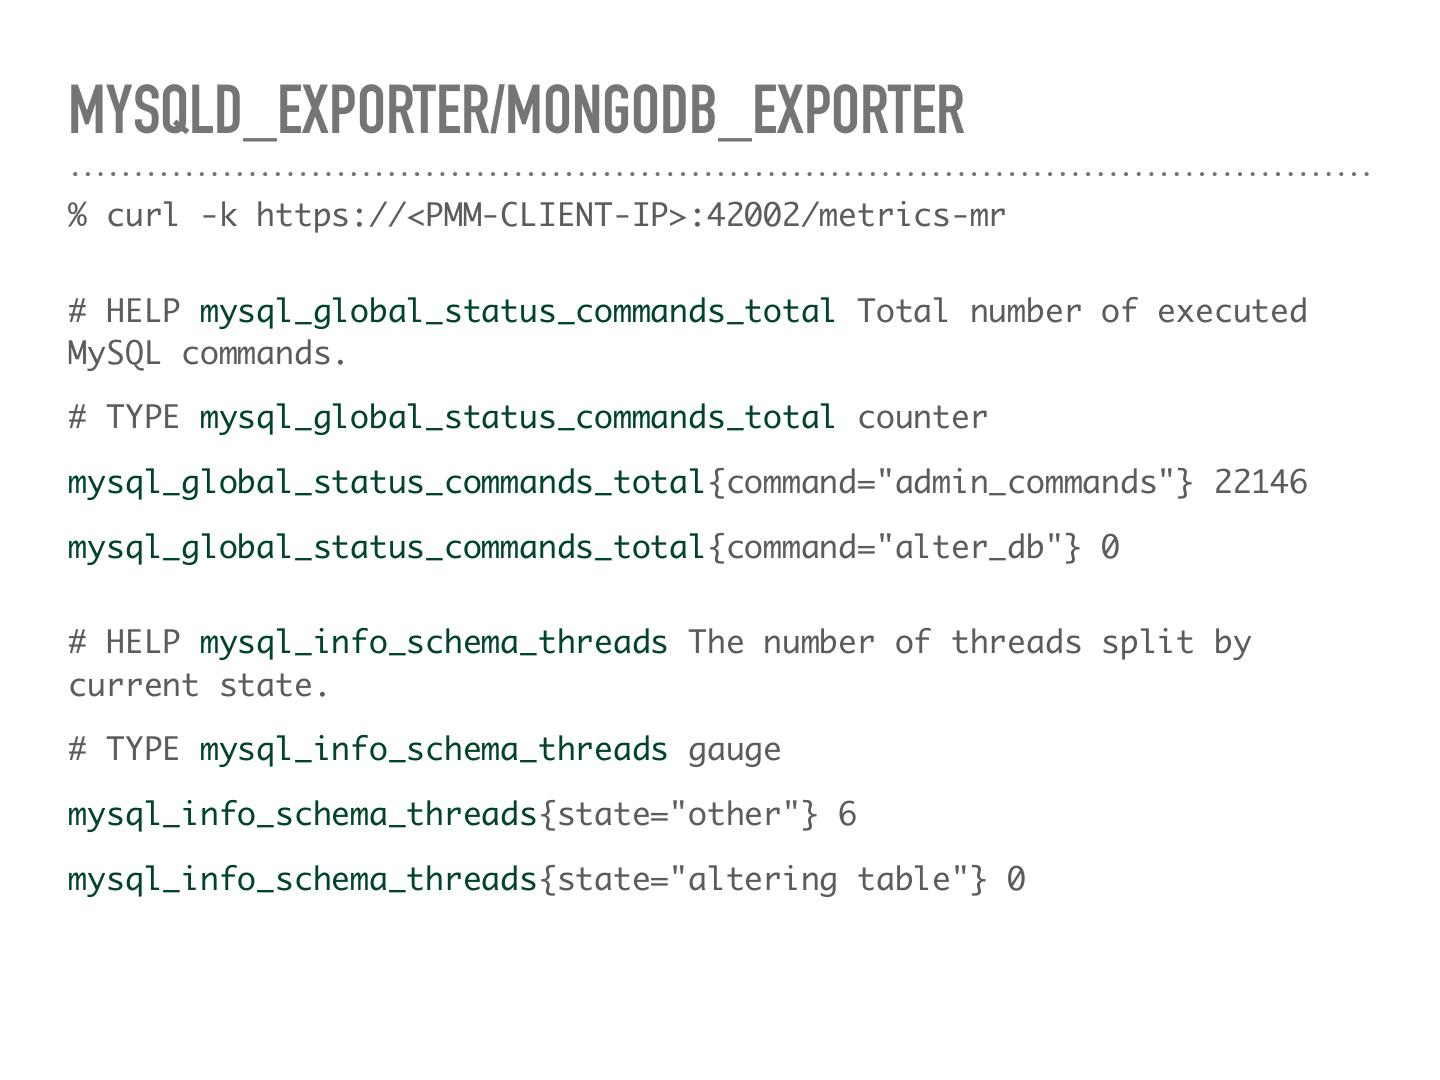
23 .MYSQLD_EXPORTER/MONGODB_EXPORTER Daemon, REST API service (golang): ➤ connects to database ➤ reads database metadata ➤ return data to Prometheus on API call ➤ forked by Percona
24 .MYSQLD_EXPORTER/MONGODB_EXPORTER % curl -k https://<PMM-CLIENT-IP>:42002/metrics-mr # HELP mysql_global_status_commands_total Total number of executed MySQL commands. # TYPE mysql_global_status_commands_total counter mysql_global_status_commands_total{command="admin_commands"} 22146 mysql_global_status_commands_total{command="alter_db"} 0 # HELP mysql_info_schema_threads The number of threads split by current state. # TYPE mysql_info_schema_threads gauge mysql_info_schema_threads{state="other"} 6 mysql_info_schema_threads{state="altering table"} 0
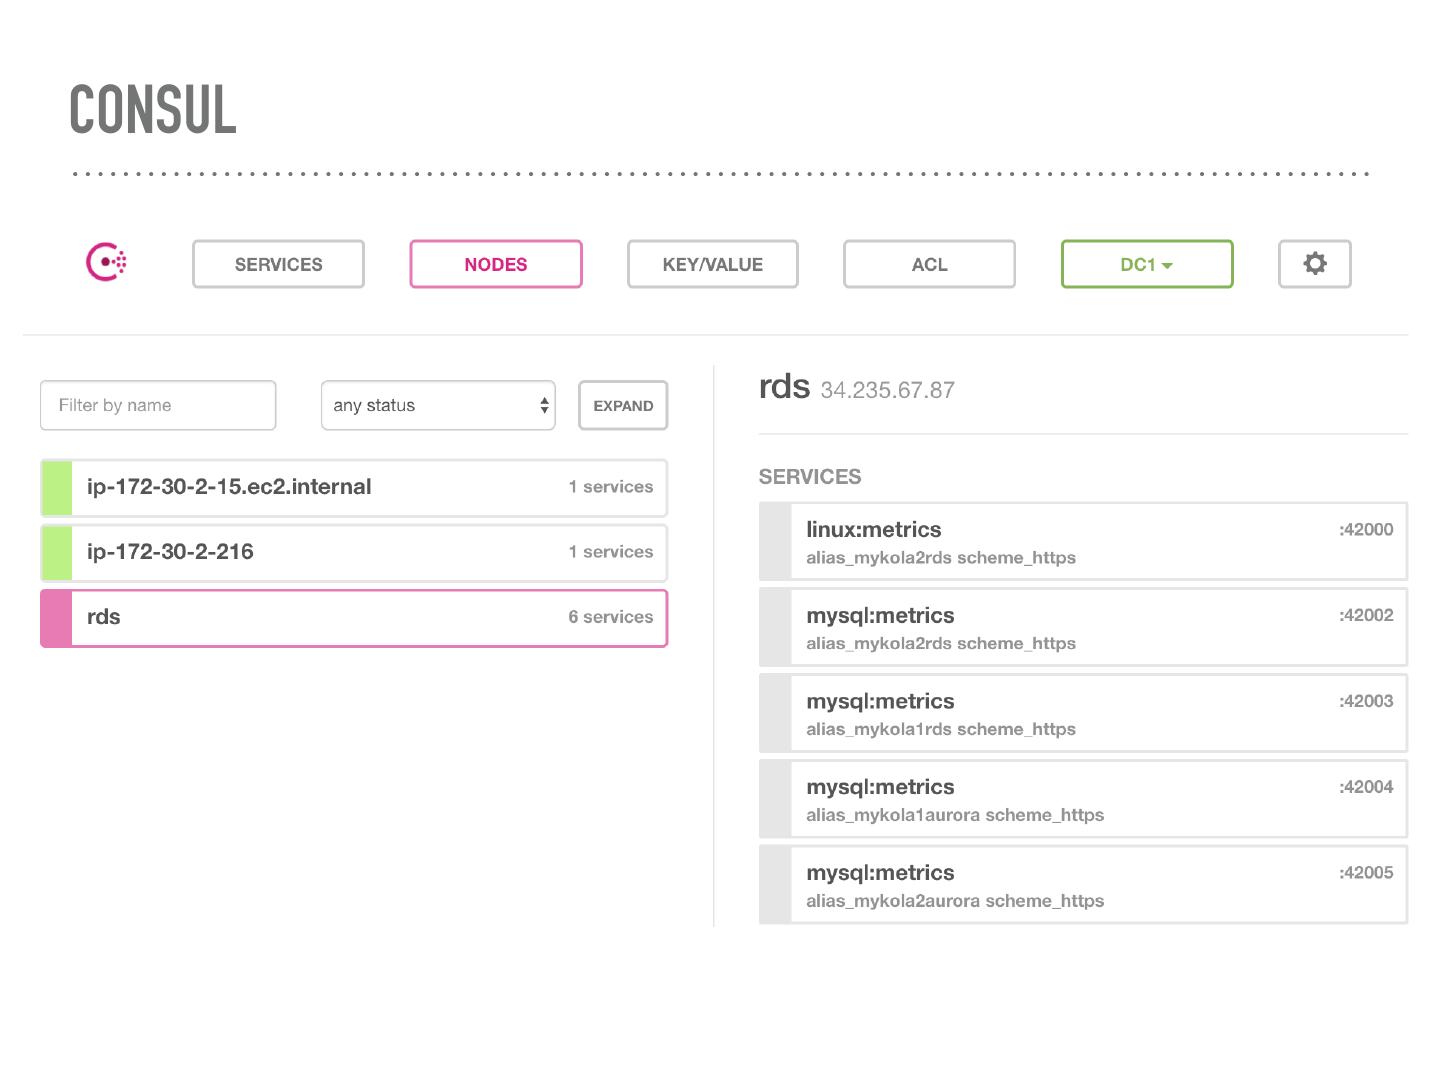
25 .CONSUL The tool for service discovery and configuration. REST API service, Database (golang): ➤ receive configuration from pmm-admin tool ➤ save configuration to own database ➤ return configuration to Prometheus
26 .CONSUL
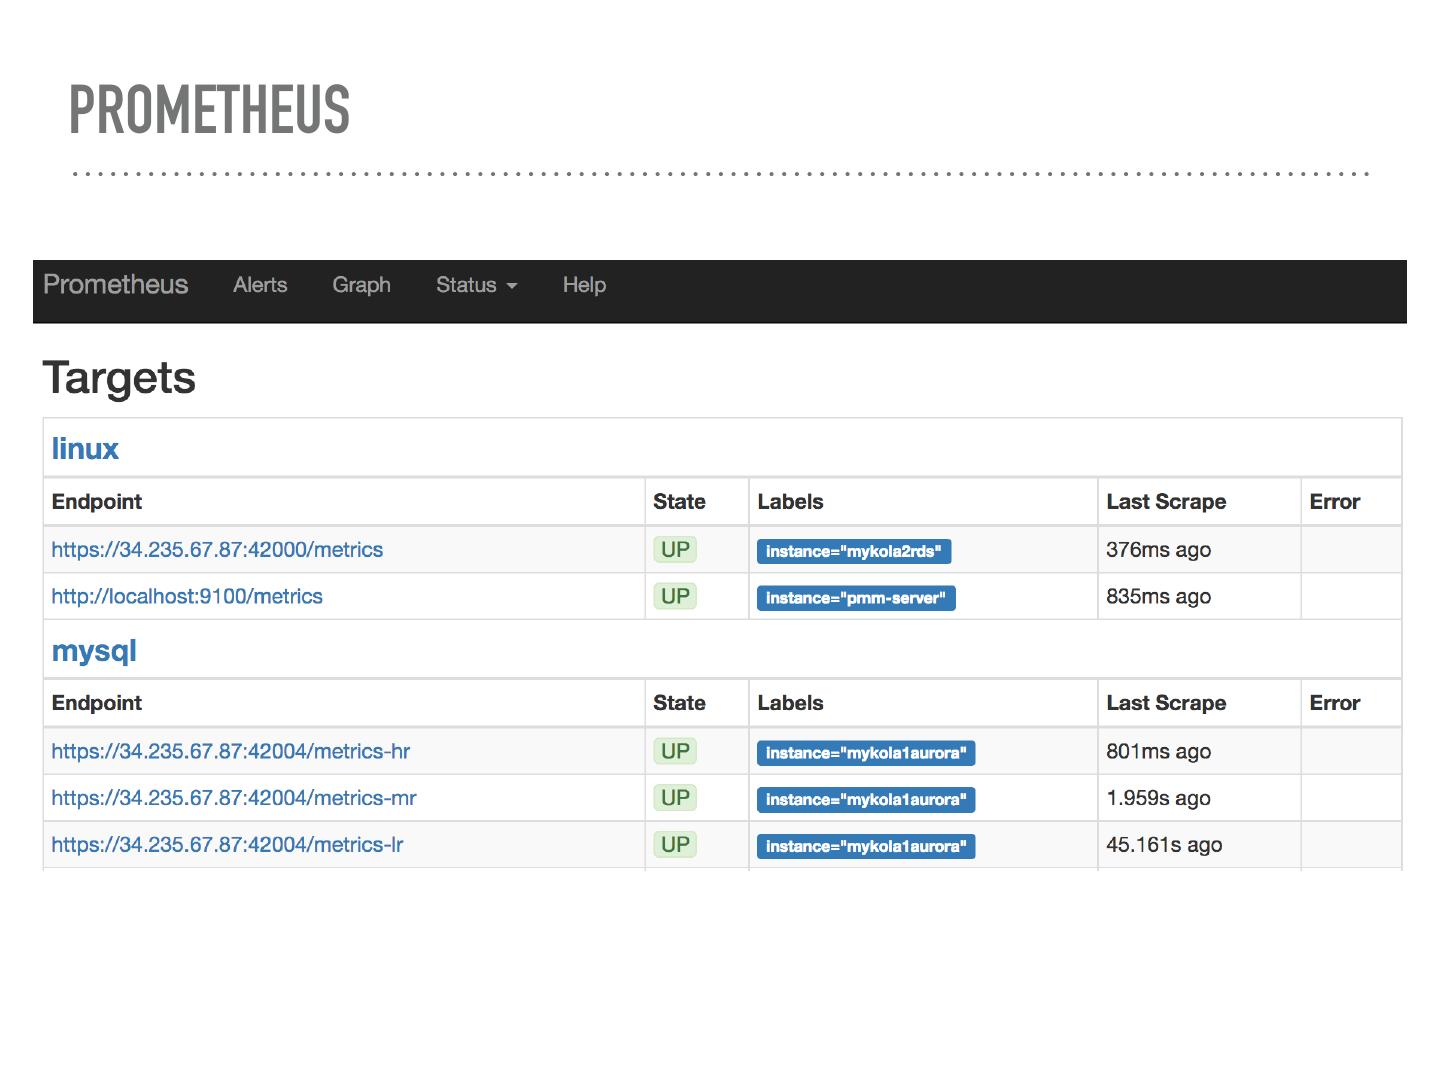
27 .PROMETHEUS The monitoring system and time series database. Metrics collector, Database, REST API service (golang): ➤ find targets in Consul ➤ pull metrics from exporters ➤ save metrics on the disk ➤ return metrics to Grafana
28 .PROMETHEUS
29 .GRAFANA The tool for beautiful monitoring and metric analytics & dashboards. Web Interface, REST API service (AngularJS, golang): ➤ show nice graphs ➤ fetches data from Prometheus ➤ fetches data from AWS CloudWatch ➤ dashboards developed by Percona


