- 快召唤伙伴们来围观吧
- 微博 QQ QQ空间 贴吧
- 文档嵌入链接
- <iframe src="https://www.slidestalk.com/u9435/Proactive_MySQL_Monitoring?embed" frame border="0" width="640" height="360" scrolling="no" allowfullscreen="true">复制
- 微信扫一扫分享
Proactive MySQL Monitoring
需要高级数据捕获和可视化的MySQL监控的两个令人兴奋的方面是诊断和容量规划——了解数据如何帮助解决问题,并使用数据规划未来性能。在本文中,我们将讨论诊断如何使用数据来解决即时问题。我们将回顾一些最常见的MySQL问题,它们如何在数据中呈现,以及如何使用这些数据来解决问题。我们还将讨论如何使用中长期趋势来估计未来的系统容量,以及如何找到潜在的瓶颈,以避免由于资源限制而导致的未来问题。
展开查看详情
1 .Proactive MySQL Monitoring Diagnostics and Capacity Planning Peter Zaitsev CEO, Percona October 25, 2016
2 .Many Sides of Monitoring Investigations and Capacity Planning Alerting (When Diagnostics (Finding (Preventing resource things get bad) Root Cause) exhaustion) 2
3 .Alerting
4 .Focus on Service vs Component Service Component • Web Site Overall • General Availability and • Single Web Server Performance • Remove from the service if • Redundancy Loss poor availability or • Other “global” issues ie correctness Performance • Immediate Action required 24/7 • Self Healing (especially cloud) • Automated Actions for Healing and Scaling • 24/7 optional 4
5 .Proactive and Reactive Proactive Reactive • Needs attention to prevent future • When things are bad or problem problem eminent • Working Hours • 24/7/365 • Replication Capacity close to limit • Server Crashed • Will run of space in a week • Replication Broke • Backup is taking longer than • Servicing Queries Slowly desired • Backup Failed 5
6 .Service Impacting and Operational Service Impacting Operational •Directly Impacting •Are backup being taken ? Application •Is configuration valid/secure ? •Service Down •Is replication running and •Service Slow up to date ? 6
7 .Signal Versus Noise High Noise Alerting systems fail due to Human Psychology https://en.wikipedia.org/wiki/The_Boy_Who_Cried_Wolf 7
8 .Learn More on Alerting Fantastic Alerting Philosophy •http://bit.ly/AlertingPhilosophy by Rob Ewaschuk 8
9 .What do we use at Percona ? Working on next Percona Monitoring generation Alerting for Plugins (NAGIOS) Percona Monitoring and http://bit.ly/PerconaMP Management 9
10 .Investigations and Diagnostics
11 .What does MySQL do ? Responds Application Requests 11
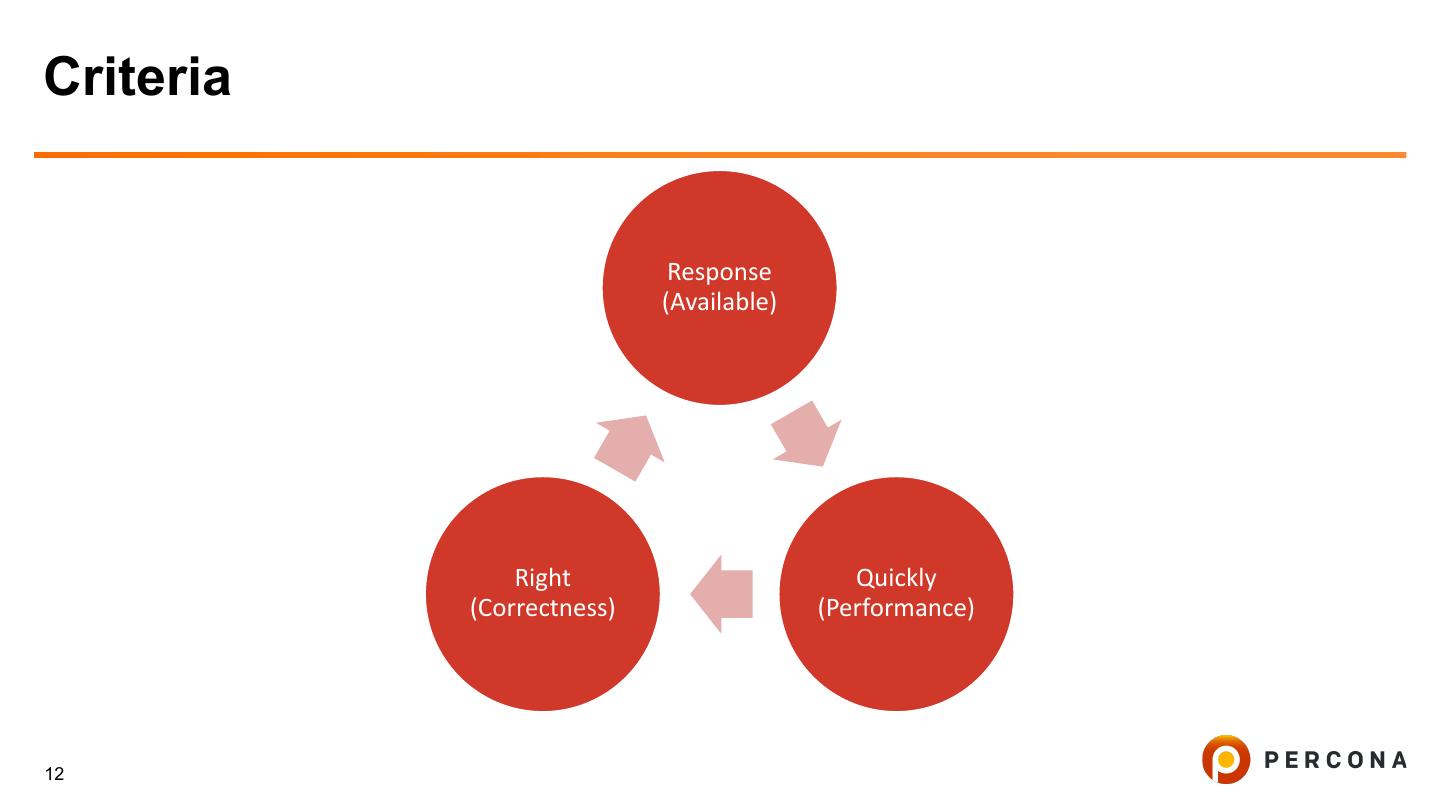
12 .Criteria Response (Available) Right Quickly (Correctness) (Performance) 12
13 .Two Ways to Look Query Focused System Focus 13
14 .Problem Caused By Hardware and Application MySQL Environment • Too many • Choosing Bad • CPU Queries Plan • Disk • Bad Queries • Contention • Memory Issues • Network • Locking 14
15 .With this in mind we built PMM Percona Monitoring and Management http://bit.ly/GetPMM Query Analytics – Looking at the Queries Side Metrics – Looking at the Operating System and MySQL Side Built by using Best in class Open Source Components 100% Free and Open Source Available now as GA 15
16 .Meet PMM Note: Name is futureproof, currently doing Monitoring not Management 16
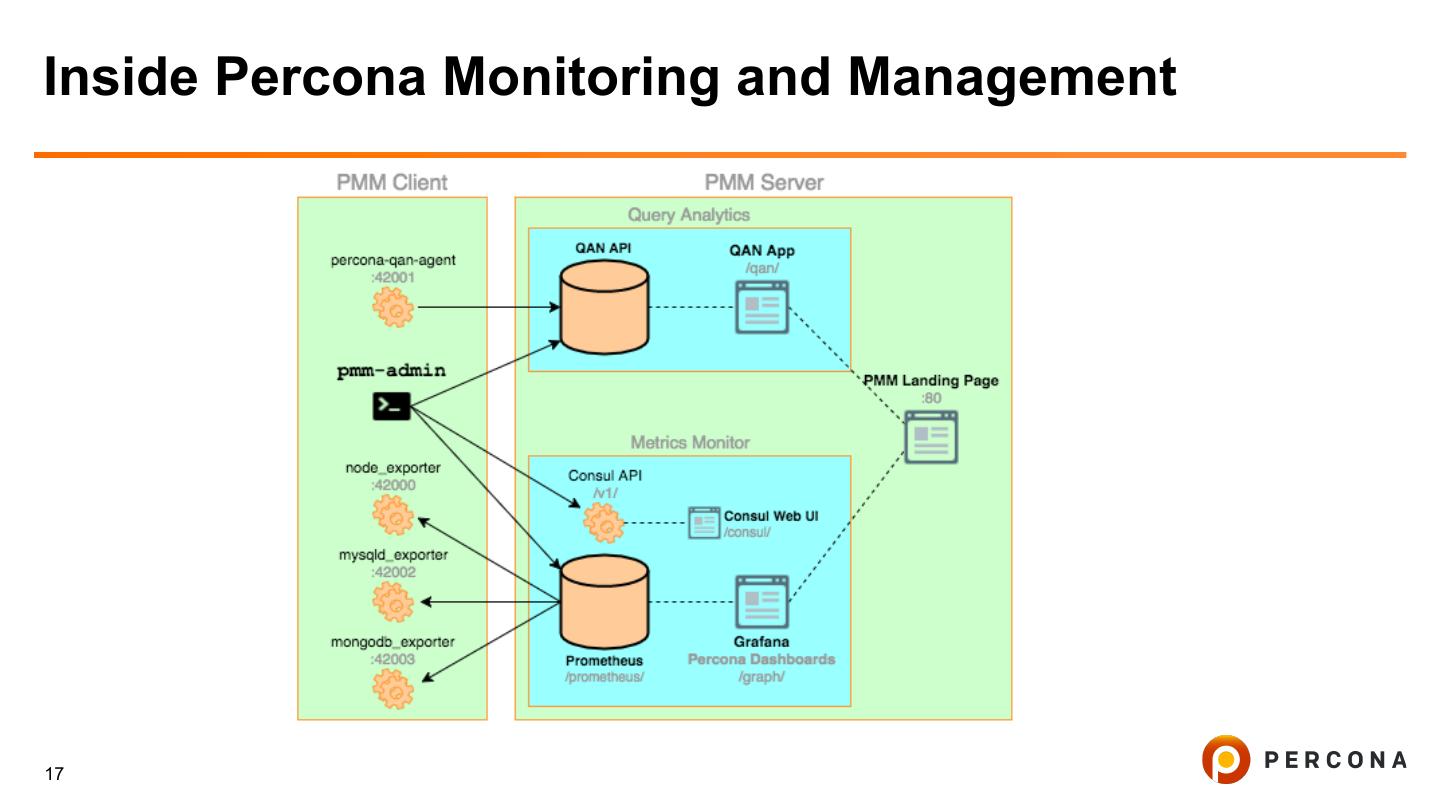
17 .Inside Percona Monitoring and Management 17
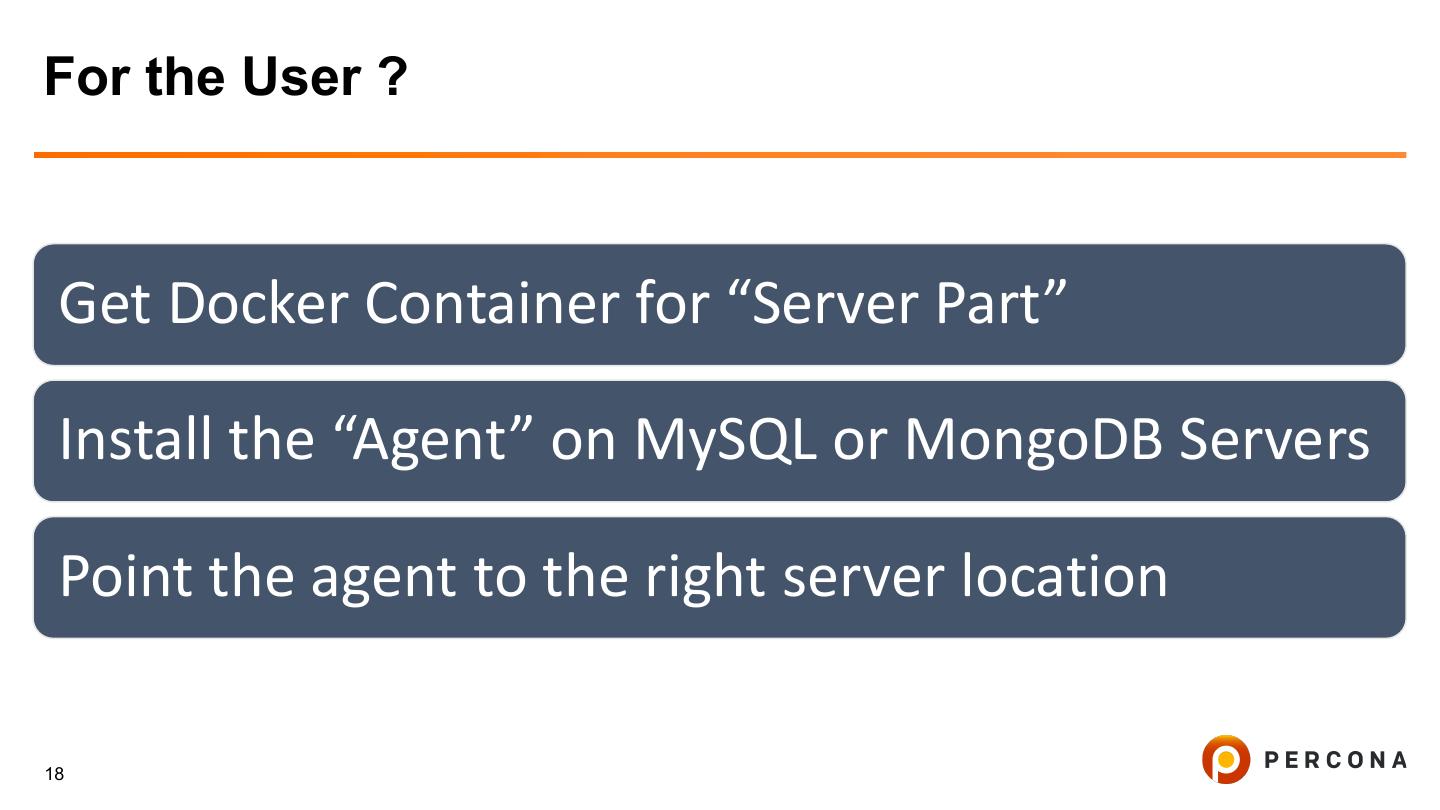
18 .For the User ? Get Docker Container for “Server Part” Install the “Agent” on MySQL or MongoDB Servers Point the agent to the right server location 18
19 .Our Grand for Plan for PMM To Become Open Source Monitoring and Management solution for MySQL and MongoDB Focus on Ease of use for Non-Experts But have depth for Experts to solve most complicated problems Actionable advice as automated as possible Work in and out of the Cloud Do not reinvent bicycle. Use Best in Class Open Source Components 19
20 .Check it Out Live Demo is running at http://pmmdemo.percona.com 20
21 .Lets Explore it Together! (Demo)
22 .Thank You!


