- 快召唤伙伴们来围观吧
- 微博 QQ QQ空间 贴吧
- 文档嵌入链接
- 复制
- 微信扫一扫分享
- 已成功复制到剪贴板
performance schema
性能模式在5.5版中首次引入,是一个非常强大的工具。它正在积极开发中,每一个新版本都为数据库管理员提供了更多的工具。
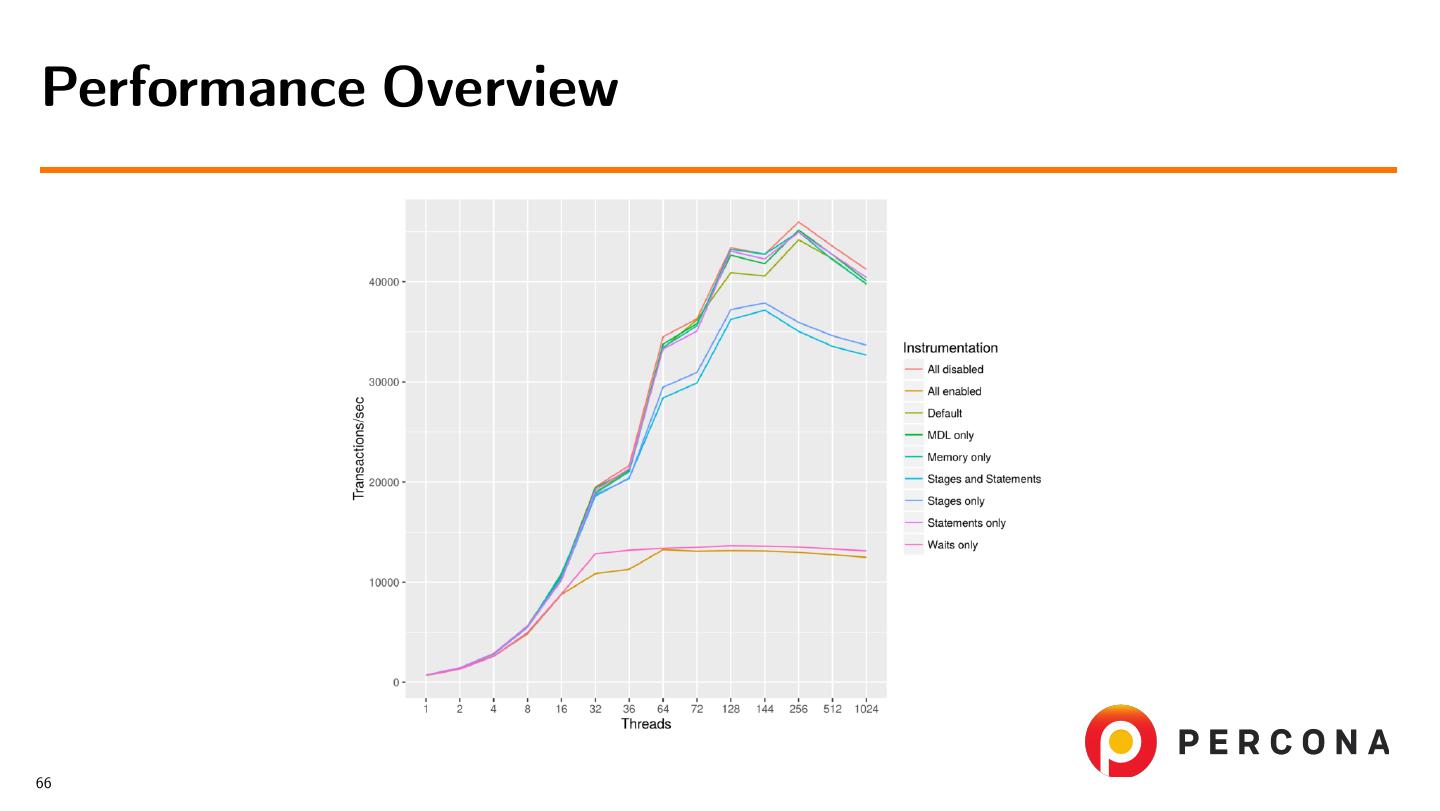
性能模式很复杂。它也不是免费的:如果启用某些仪器,它会降低性能。
在本次网络研讨会中,我将讨论:
-如何开始使用性能模式
-如何有效地设置它,特别是针对您的故障排除案例
-收集数据的时间和方式
-哪些工具会影响性能以及原因
-使用性能模式可以检测到什么
-在哪里可以找到更多信息
-sys模式如何帮助您更有效地使用性能模式
展开查看详情
1 .Performance Schema for MySQL Troubleshooting March, 1, 2018 Sveta Smirnova
2 .Table of Contents •Overview and Configuration •Statements •Memory Usage •Locks Diagnostics •Variables and Status •Errors Summary •Connection Diagnostics •Replication •Server Internals 2
3 .Overview and Configuration
4 .What is Inside? 5.6 5.7 8.0 • 52 tables • 87 tables • 101 tables • 554 instrs • 1019 instrs • 1193 instrs • 31 variables • 42 variables • 44 variables 4
5 .What Can be Found? • Which statements are less optimal • Which operations take most of the time • Which locks and mutexes taken most often • What happens inside a session • How much memory was allocated • Why users cannot connect from a host • More 5
6 .How it Works? • Internally • Instrumented instruction called • Corresponding field updated Counter incremented Time recorded Query recorded ... • More often you call instruction - higher overhead! 6
7 .How it Works? • Internally • From the user point of view • Database performance schema • Set of tables with performance statistics events NAME [current|history[ long]] Few tables with unique names • Setup tables SETUP * • Option variables • Schema sys 6
8 .Performance Schema Defaults • ON by default • Only global, thread, statements and transactions instrumentation enabled • All other consumers are disabled 7
9 .How to Configure • Use pattern update performance_schema.setup_consumers set enabled=’yes’ \ where name like ’OUR_REQUIREMENT_%’; update performance_schema.setup_instruments set enabled=’yes’, \ timed=’yes’ where name like ’OUR_REQUIREMENT_%’; 8
10 .How to Configure • Use pattern • Or easier call sys.ps_setup_enable_consumer(YOUR_CONSUMER); Requires sys schema call sys.ps_setup_enable_instrument(YOUR_INSTRUMENT); Needs separate install before 5.7 8
11 .How to Configure • Use pattern • Or easier • Be careful! • They are memory and CPU intensive • Do not turn them all ON until needed 8
12 .Statements
13 .Statements Instrumentation • For regular SQL statements • Prepared statements • Stored routines • Stages of statements execution 10
14 .What Can We Discover? • Why statements are slow? • Per-query statistics • Most evolving stages 11
15 .What Can We Discover? • Why statements are slow? • Per-query statistics • Most evolving stages • What was executed inside stored routine? 11
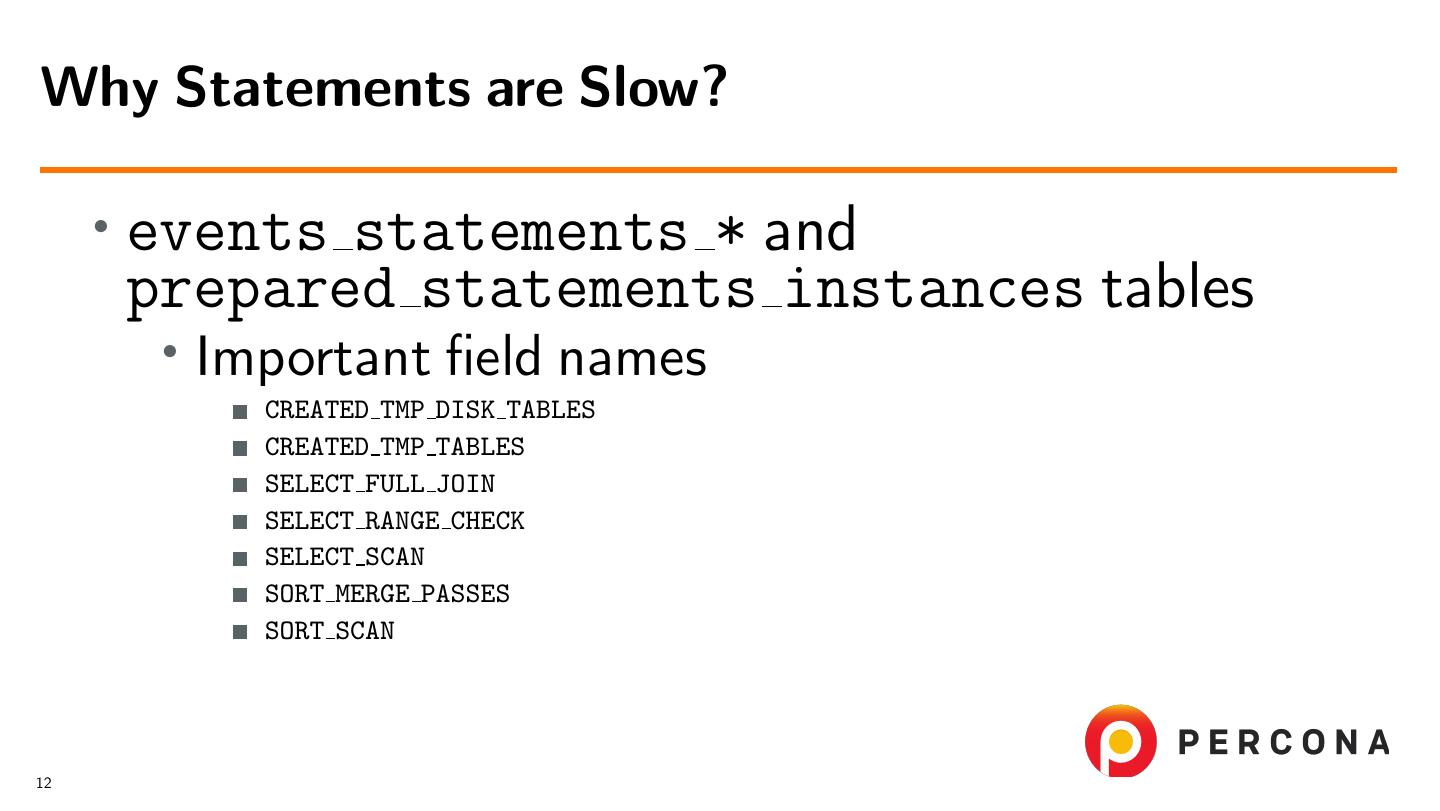
16 .Why Statements are Slow? • events statements * and prepared statements instances tables • Important field names CREATED TMP DISK TABLES CREATED TMP TABLES SELECT FULL JOIN SELECT RANGE CHECK SELECT SCAN SORT MERGE PASSES SORT SCAN 12
17 .Why Statements are Slow? • events statements * and prepared statements instances tables • Views in sys schema • Important view names statement analysis statements with full table scans statements with runtimes in 95th percentile statements with sorting statements with temp tables statements with errors or warnings 12
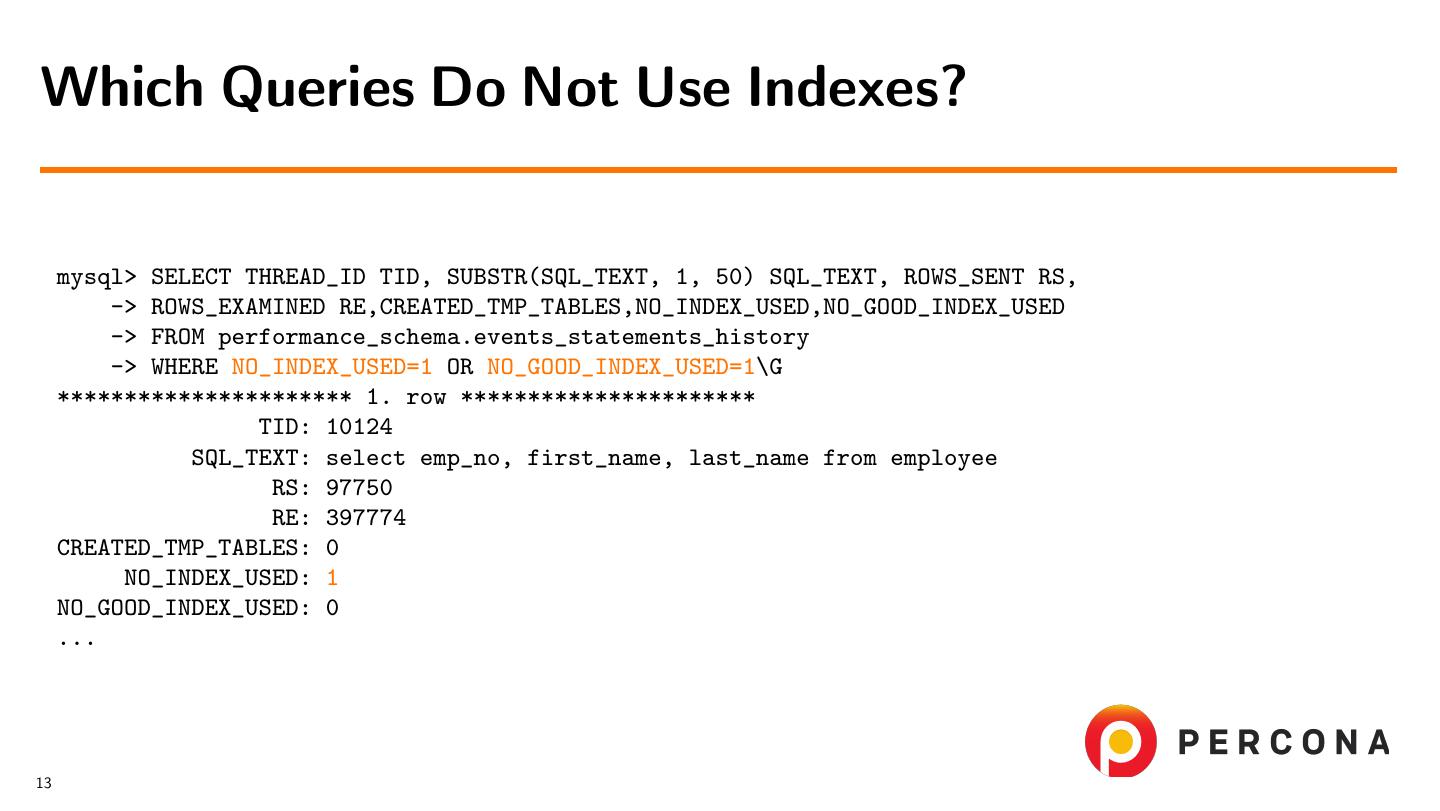
18 .Which Queries Do Not Use Indexes? mysql> SELECT THREAD_ID TID, SUBSTR(SQL_TEXT, 1, 50) SQL_TEXT, ROWS_SENT RS, -> ROWS_EXAMINED RE,CREATED_TMP_TABLES,NO_INDEX_USED,NO_GOOD_INDEX_USED -> FROM performance_schema.events_statements_history -> WHERE NO_INDEX_USED=1 OR NO_GOOD_INDEX_USED=1\G ********************** 1. row ********************** TID: 10124 SQL_TEXT: select emp_no, first_name, last_name from employee RS: 97750 RE: 397774 CREATED_TMP_TABLES: 0 NO_INDEX_USED: 1 NO_GOOD_INDEX_USED: 0 ... 13
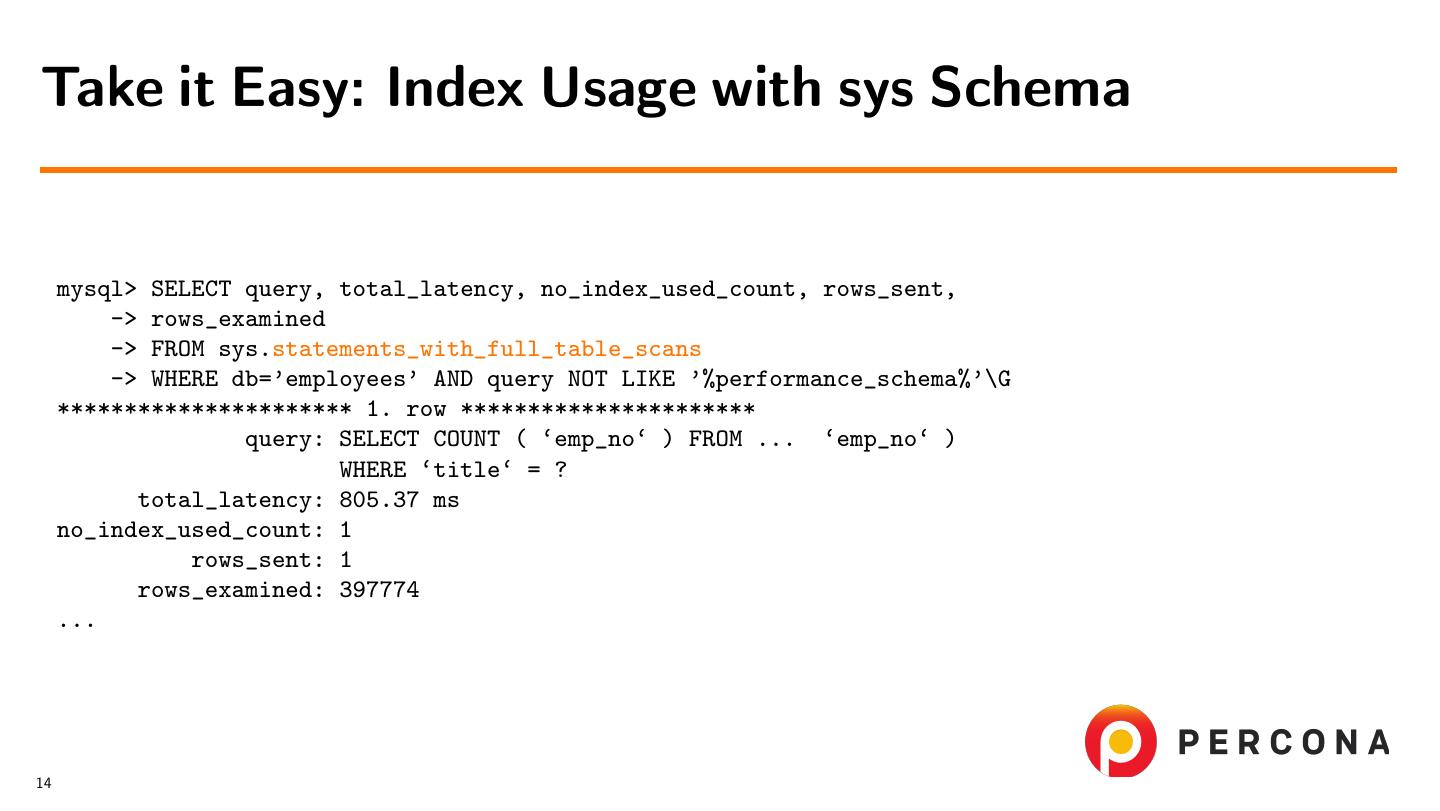
19 .Take it Easy: Index Usage with sys Schema mysql> SELECT query, total_latency, no_index_used_count, rows_sent, -> rows_examined -> FROM sys.statements_with_full_table_scans -> WHERE db=’employees’ AND query NOT LIKE ’%performance_schema%’\G ********************** 1. row ********************** query: SELECT COUNT ( ‘emp_no‘ ) FROM ... ‘emp_no‘ ) WHERE ‘title‘ = ? total_latency: 805.37 ms no_index_used_count: 1 rows_sent: 1 rows_examined: 397774 ... 14
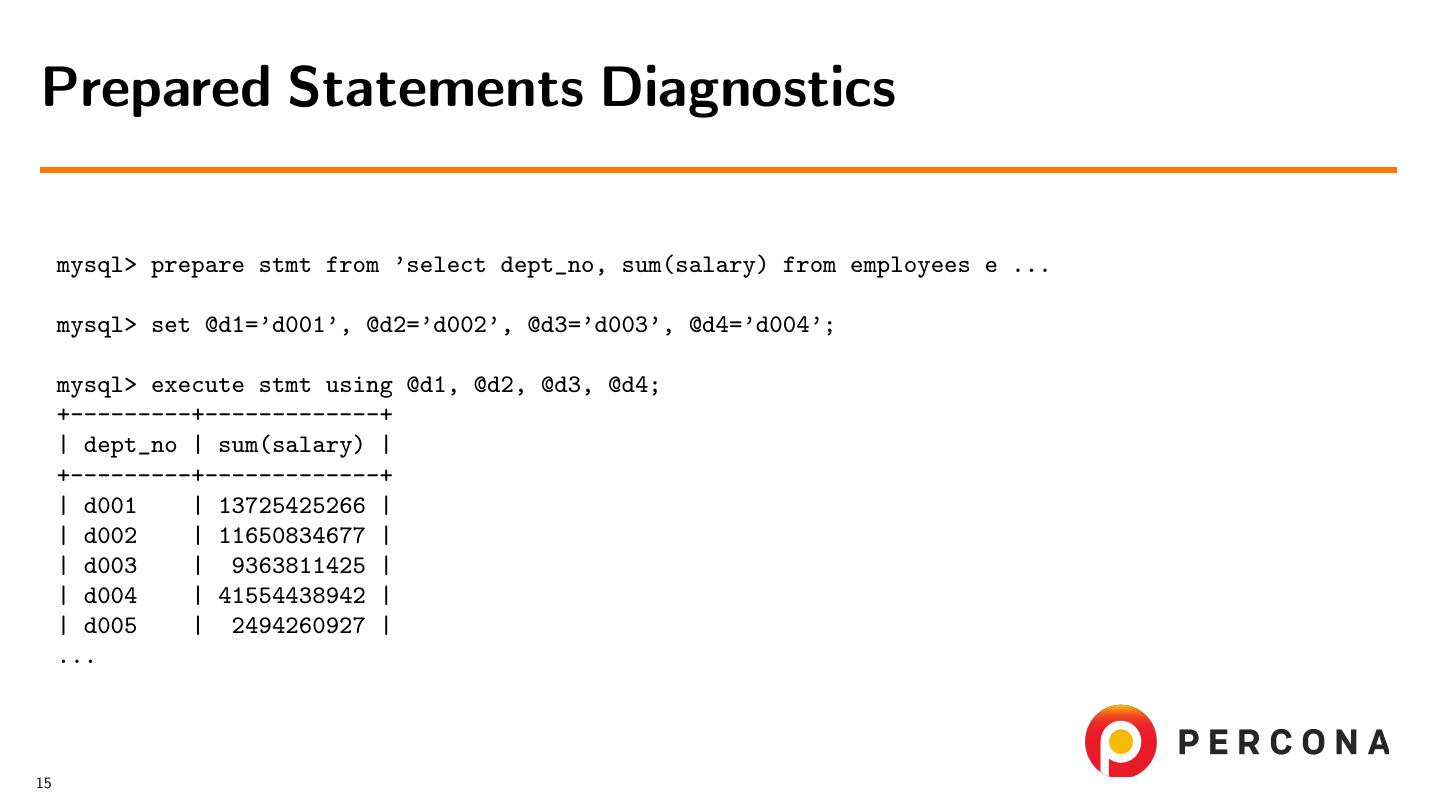
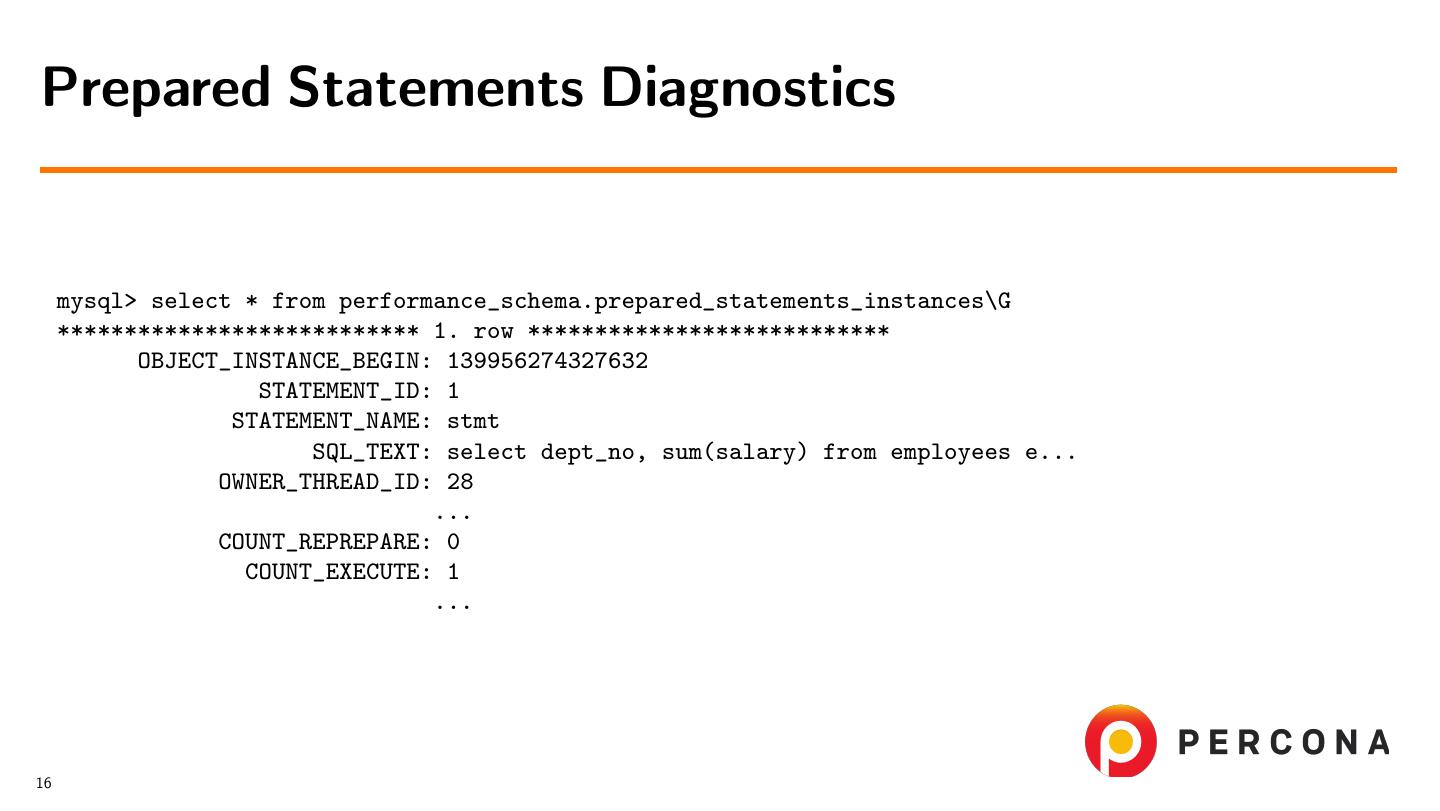
20 .Prepared Statements Diagnostics mysql> prepare stmt from ’select dept_no, sum(salary) from employees e ... mysql> set @d1=’d001’, @d2=’d002’, @d3=’d003’, @d4=’d004’; mysql> execute stmt using @d1, @d2, @d3, @d4; +---------+-------------+ | dept_no | sum(salary) | +---------+-------------+ | d001 | 13725425266 | | d002 | 11650834677 | | d003 | 9363811425 | | d004 | 41554438942 | | d005 | 2494260927 | ... 15
21 .Prepared Statements Diagnostics mysql> select * from performance_schema.prepared_statements_instances\G *************************** 1. row *************************** OBJECT_INSTANCE_BEGIN: 139956274327632 STATEMENT_ID: 1 STATEMENT_NAME: stmt SQL_TEXT: select dept_no, sum(salary) from employees e... OWNER_THREAD_ID: 28 ... COUNT_REPREPARE: 0 COUNT_EXECUTE: 1 ... 16
22 .Prepared Statements Diagnostics ... SUM_ROWS_SENT: 9 SUM_ROWS_EXAMINED: 2011495 SUM_CREATED_TMP_DISK_TABLES: 0 SUM_CREATED_TMP_TABLES: 1 ... SUM_SELECT_SCAN: 1 ... SUM_SORT_ROWS: 9 SUM_SORT_SCAN: 1 17
23 .Stored Routines Instrumentation • What happens inside a routine • Queries, called from the routine • statement/sp/statement 18
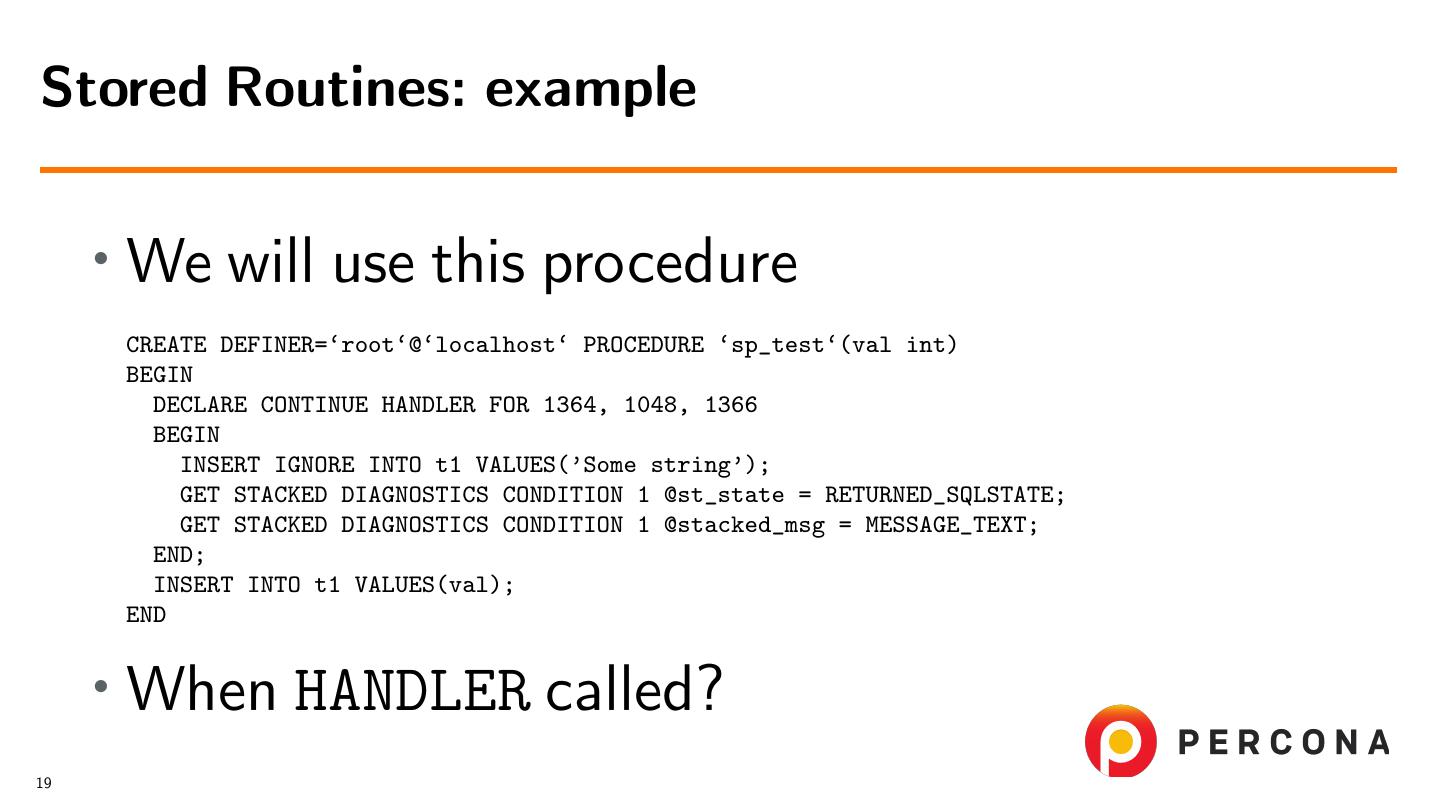
24 .Stored Routines: example • We will use this procedure CREATE DEFINER=‘root‘@‘localhost‘ PROCEDURE ‘sp_test‘(val int) BEGIN DECLARE CONTINUE HANDLER FOR 1364, 1048, 1366 BEGIN INSERT IGNORE INTO t1 VALUES(’Some string’); GET STACKED DIAGNOSTICS CONDITION 1 @st_state = RETURNED_SQLSTATE; GET STACKED DIAGNOSTICS CONDITION 1 @stacked_msg = MESSAGE_TEXT; END; INSERT INTO t1 VALUES(val); END • When HANDLER called? 19
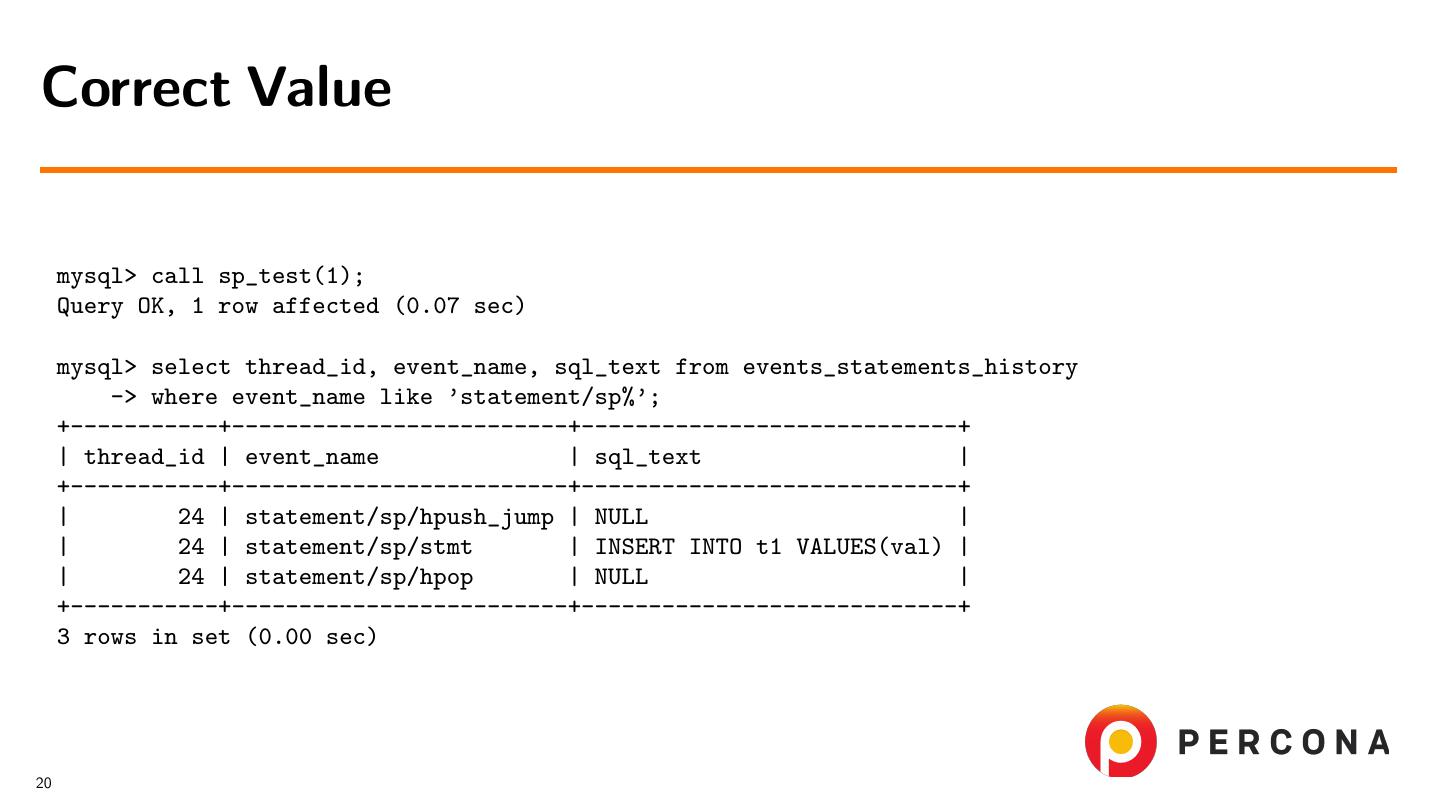
25 .Correct Value mysql> call sp_test(1); Query OK, 1 row affected (0.07 sec) mysql> select thread_id, event_name, sql_text from events_statements_history -> where event_name like ’statement/sp%’; +-----------+-------------------------+----------------------------+ | thread_id | event_name | sql_text | +-----------+-------------------------+----------------------------+ | 24 | statement/sp/hpush_jump | NULL | | 24 | statement/sp/stmt | INSERT INTO t1 VALUES(val) | | 24 | statement/sp/hpop | NULL | +-----------+-------------------------+----------------------------+ 3 rows in set (0.00 sec) 20
26 .HANDLER call mysql> call sp_test(NULL); Query OK, 1 row affected (0.07 sec) mysql> select thread_id, event_name, sql_text from events_statements_history -> where event_name like ’statement/sp%’; +-----------+-------------------------+-------------------------------------------+ | thread_id | event_name | sql_text | +-----------+-------------------------+-------------------------------------------+ | 24 | statement/sp/hpush_jump | NULL | | 24 | statement/sp/stmt | INSERT INTO t1 VALUES(val) | | 24 | statement/sp/stmt | INSERT IGNORE INTO t1 VALUES(’Som... | | 24 | statement/sp/stmt | GET STACKED DIAGNOSTICS CONDITION... | | 24 | statement/sp/stmt | GET STACKED DIAGNOSTICS CONDITION... | | 24 | statement/sp/hreturn | NULL | | 24 | statement/sp/hpop | NULL | +-----------+-------------------------+ 7 rows in set (0.00 sec) 21
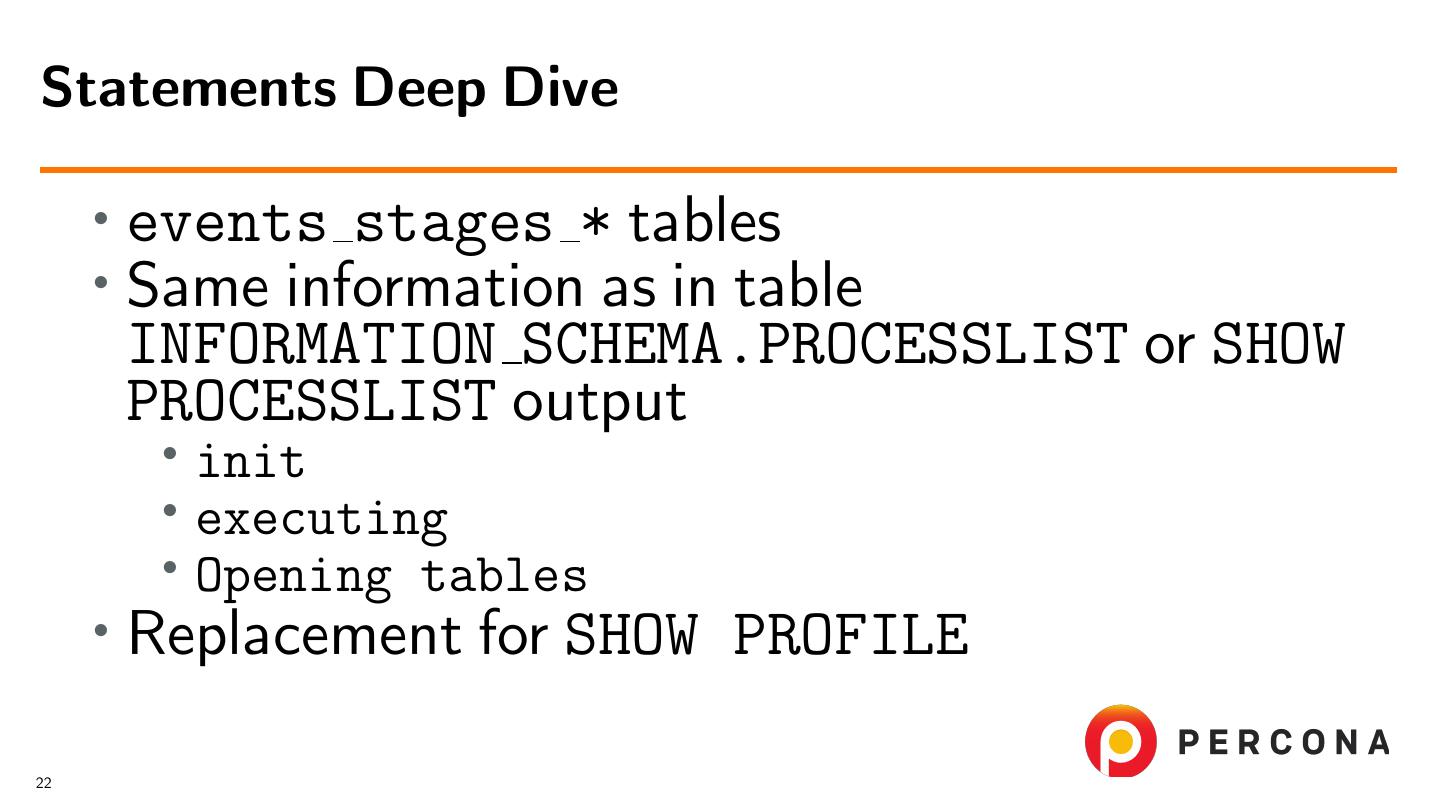
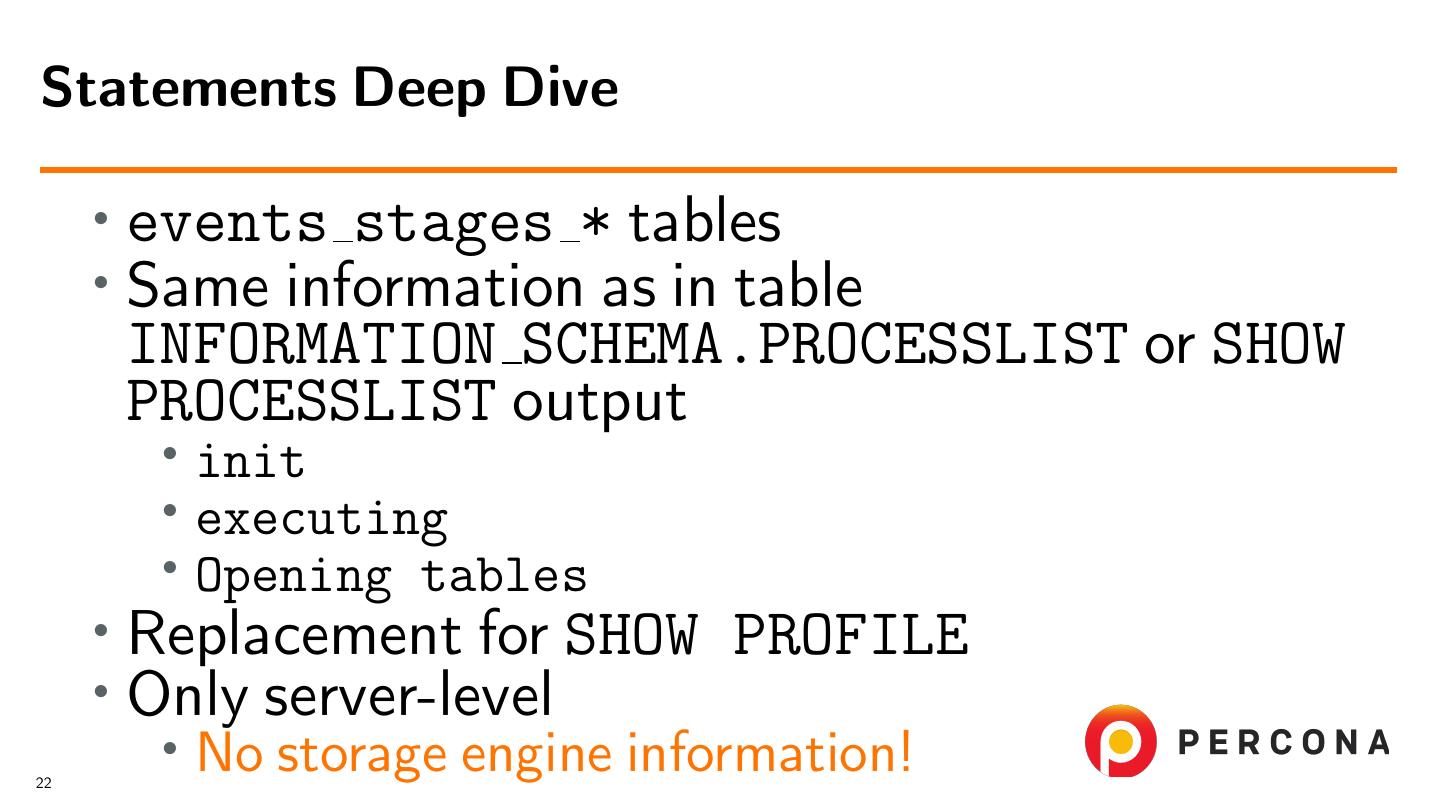
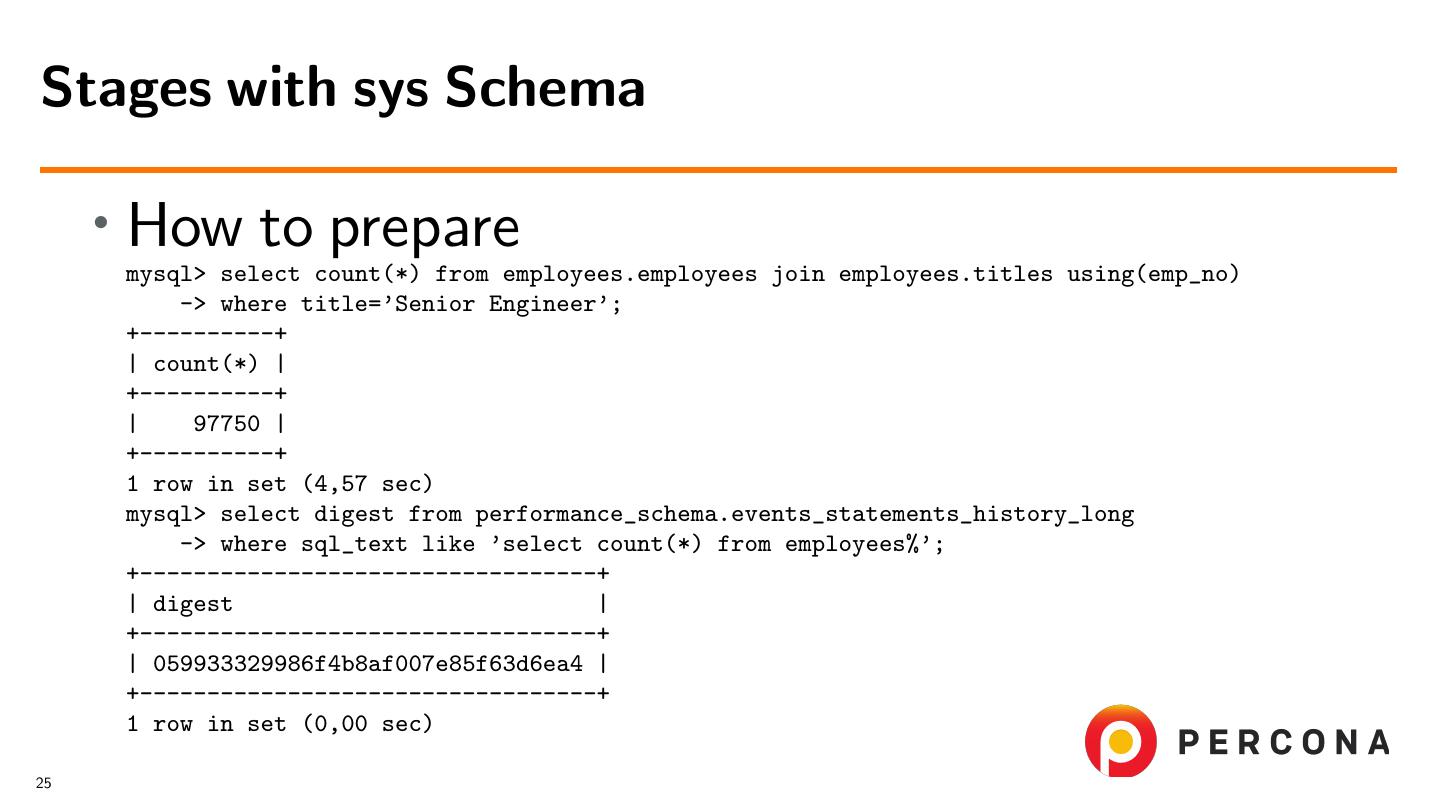
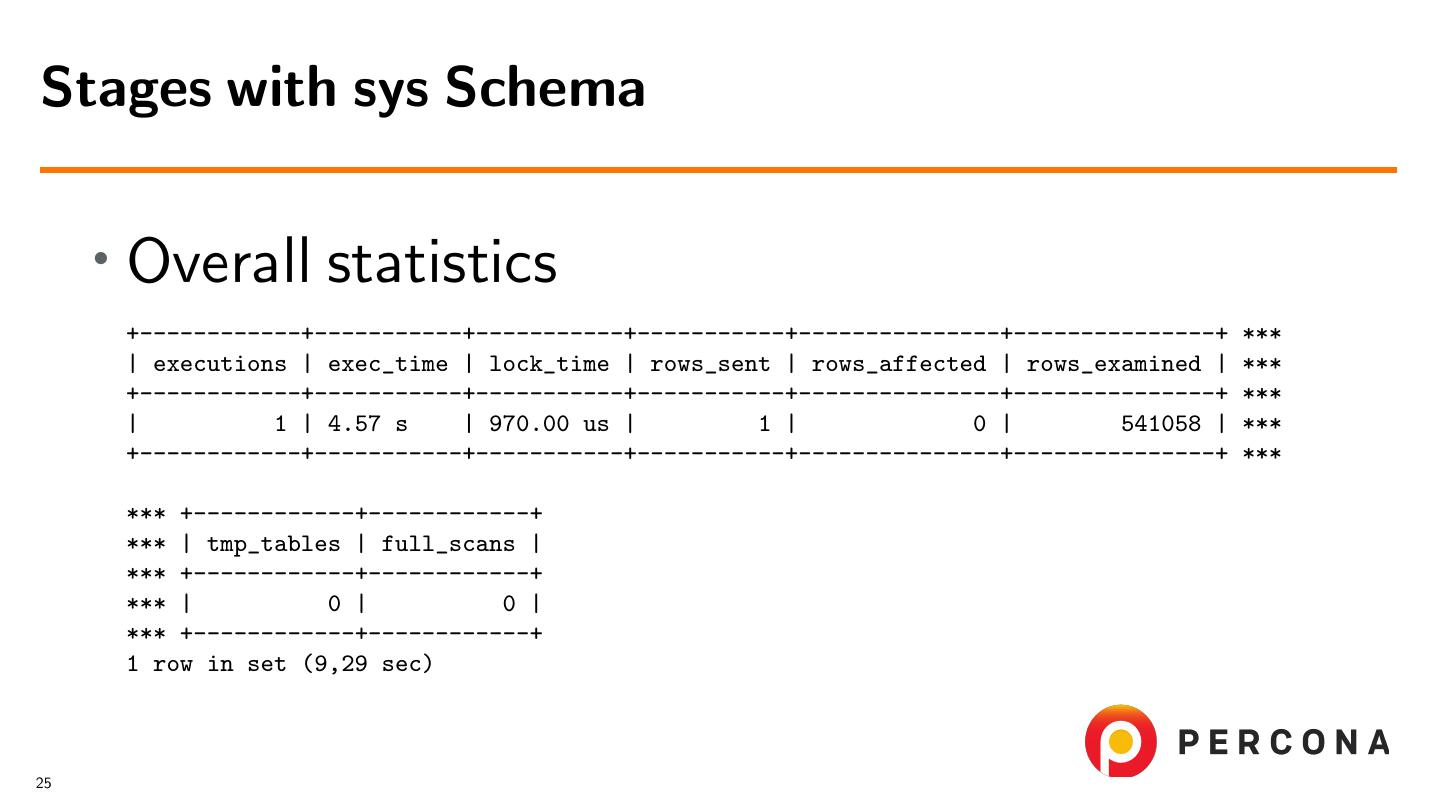
27 .Statements Deep Dive • events stages * tables 22
28 .Statements Deep Dive • events stages * tables • Same information as in table INFORMATION SCHEMA.PROCESSLIST or SHOW PROCESSLIST output • init • executing • Opening tables 22
29 .Statements Deep Dive • events stages * tables • Same information as in table INFORMATION SCHEMA.PROCESSLIST or SHOW PROCESSLIST output • init • executing • Opening tables • Replacement for SHOW PROFILE 22


