- 快召唤伙伴们来围观吧
- 微博 QQ QQ空间 贴吧
- 视频嵌入链接 文档嵌入链接
- <iframe src="https://www.slidestalk.com/Spark/ApacheSparkAIUseCaseinTelcoNetworkQualityAnalysisandPredictionwithGeospatialVisualization?embed&video" frame border="0" width="640" height="360" scrolling="no" allowfullscreen="true">复制
- 微信扫一扫分享


Apache Spark AI Use Case in Telco - Network Quality Analysis and Prediction
In this talk, we will present how we analyze, predict, and visualize network quality data, as a spark AI use case in a telecommunications company. SK Telecom is the largest wireless telecommunications provider in South Korea with 300,000 cells and 27 million subscribers. These 300,000 cells generate data every 10 seconds, the total size of which is 60TB, 120 billion records per day.
In order to address previous problems of Spark based on HDFS, we have developed a new data store for SparkSQL consisting of Redis and RocksDB that allows us to distribute and store these data in real time and analyze it right away, We were not satisfied with being able to analyze network quality in real-time, we tried to predict network quality in near future in order to quickly detect and recover network device failures, by designing network signal pattern-aware DNN model and a new in-memory data pipeline from spark to tensorflow.
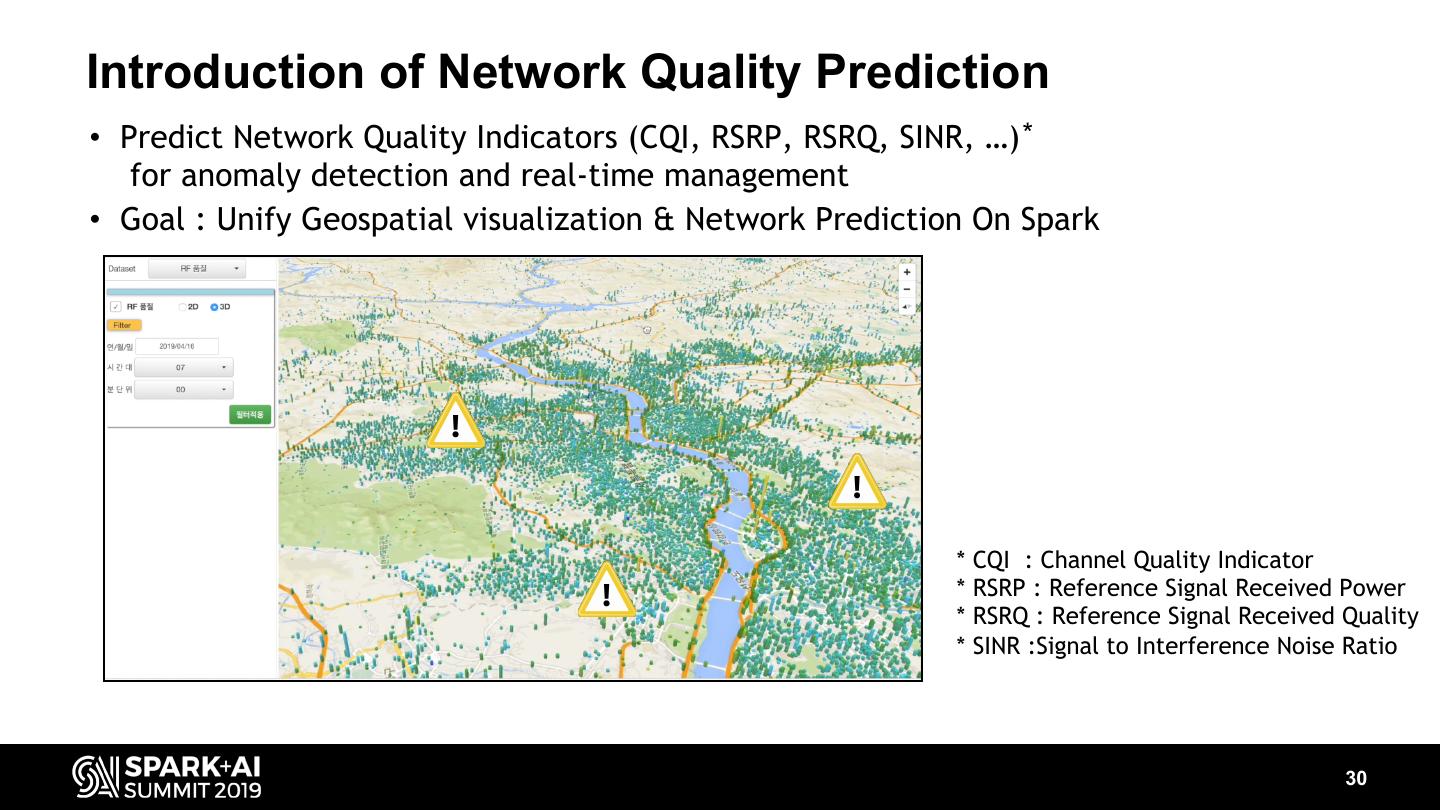
In addition, by integrating Apache Livy and MapboxGL to SparkSQL and our new store, we have built a geospatial visualization system that shows the current population and signal strength of 300,000 cells on the map in real time.
Topics
-The architecture of our How we utilize Redis & RocksDB in order to store tremendous data in an efficient way.
-The architecture of Spark Data Source for Redis: filter out irrelevant Redis keys using filter pushdown.
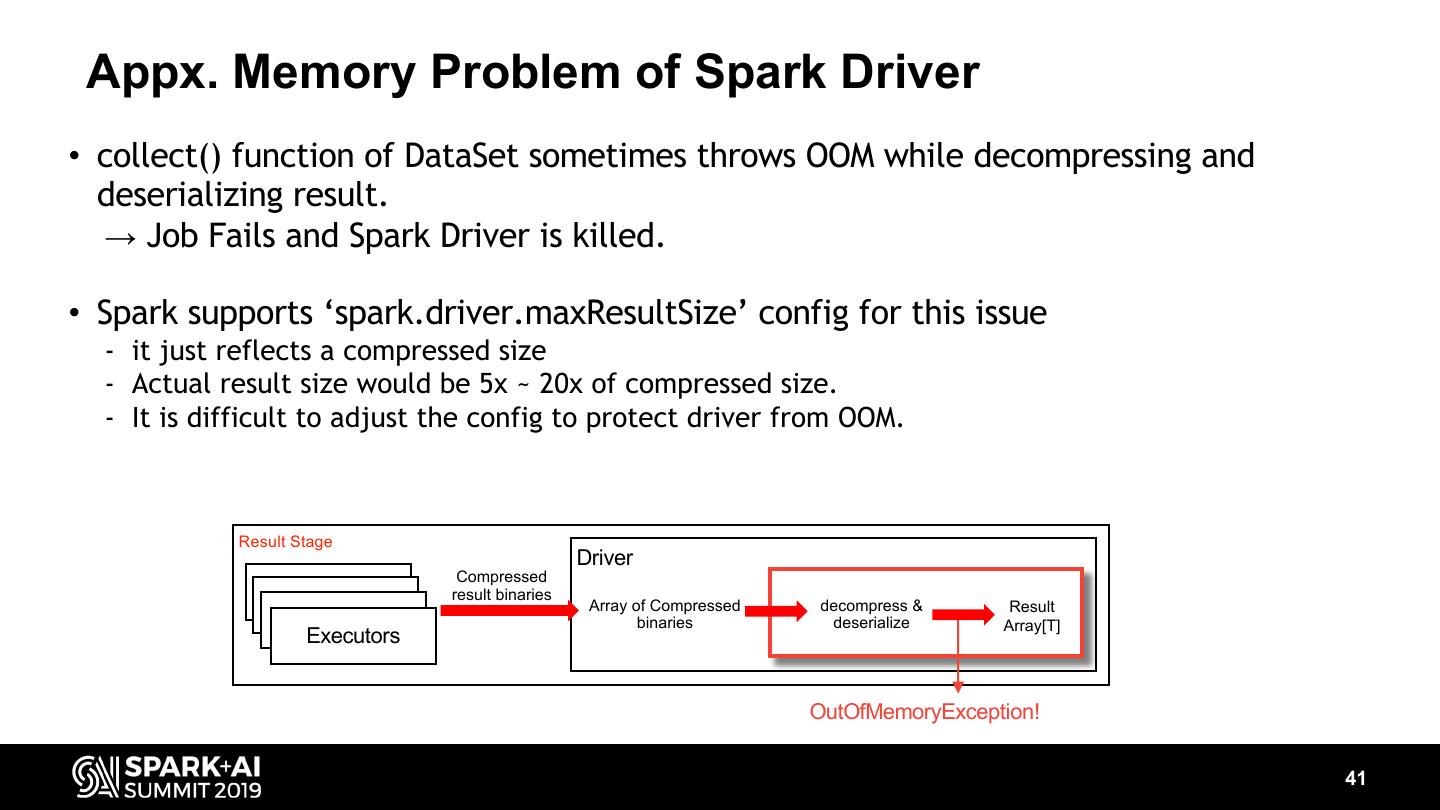
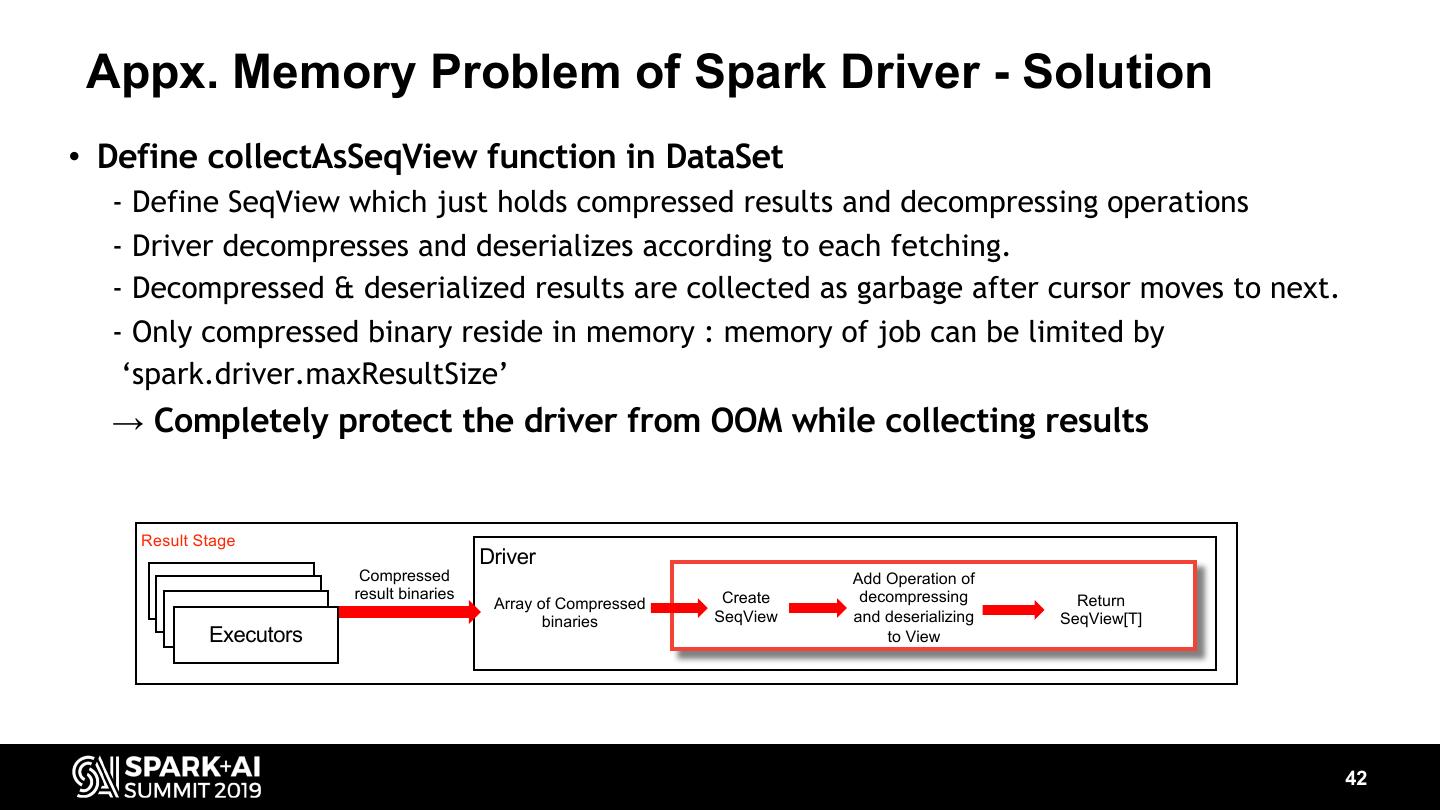
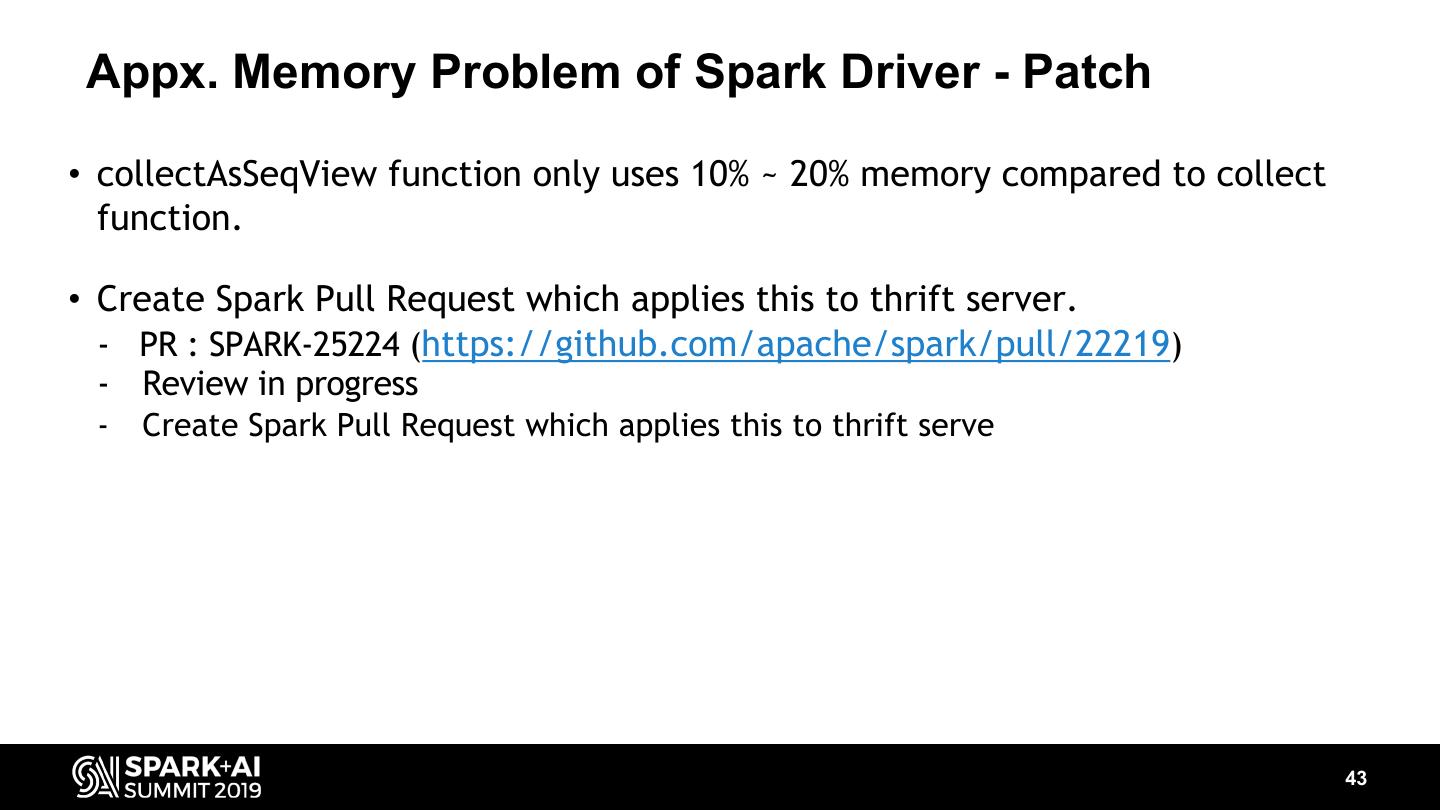
-How we reduce memory usage of Spark driver and prevent its OutOfMemoryError.
-Better prediction model for network quality prediction than RNN.
-How we train a prediction model for network quality of 300,000 cells each of which has different signal patterns.
-How we visualize in geospatial data: Customized logical plan for spatial query aggregation & pushdown
-How we optimize Spatial query: aggregation pushdown and vectorized aggregation using SIMD
展开查看详情
1 .WIFI SSID:Spark+AISummit | Password: UnifiedDataAnalytics
2 .Spark AI Usecase in Telco: Network Quality Analysis and Prediction with Geospatial Visualization Hongchan Roh, Dooyoung Hwang, SK Telecom #UnifiedDataAnalytics #SparkAISummit
3 .Network Quality Visualization Demo ▸ Demo shows - Visualize RF quality of cell towers - Height : connection count - Colors : RF quality Good Bad ▸ Data source - 300,000 cell tower network device logs ▸ Resources - 5 CPU nodes with Intel Xeon Gold 6240 youtube demo video link: https://youtu.be/HpDkF3CxEow This doesn’t exactly reflect real network quality, we generated synthetic data from real one 3
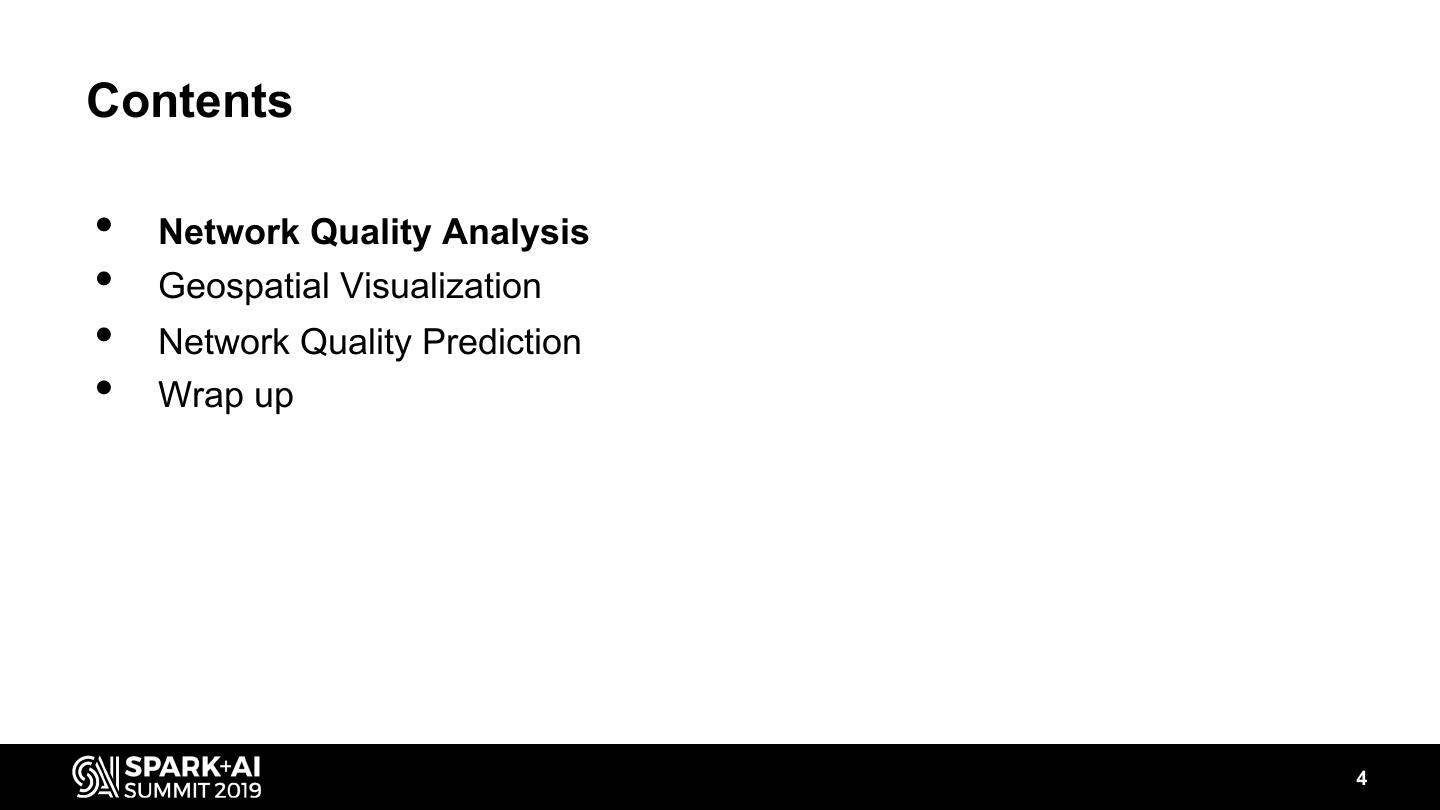
4 .Contents • Network Quality Analysis • Geospatial Visualization • Network Quality Prediction • Wrap up 4
5 .Network Quality Analysis SK Telecom : The largest telecommunications provider in South Korea • 27 million subscribers • 300,000 cells Target Data: Radio cell tower logs • time-series data with timestamp tags generated every 10 seconds • geospatial data with geographical coordinates (latitude and longitude) translated by cell tower’s location 5
6 .Network Quality Analysis Data Ingestion Requirements • Ingestion 1.4 million records / sec, (500 byte of records, 200~500 columns) • 120 billion records / day, 60 TB / day • Data retention period: 7 ~ 30 days Query Requirements • web dashboard and ad-hoc queries: response within 3 sec for a specific time and region (cell) predicates for multi sessions • daily batch queries: response within hours for long query pipelines having heavy operations such as joins and aggregations 6
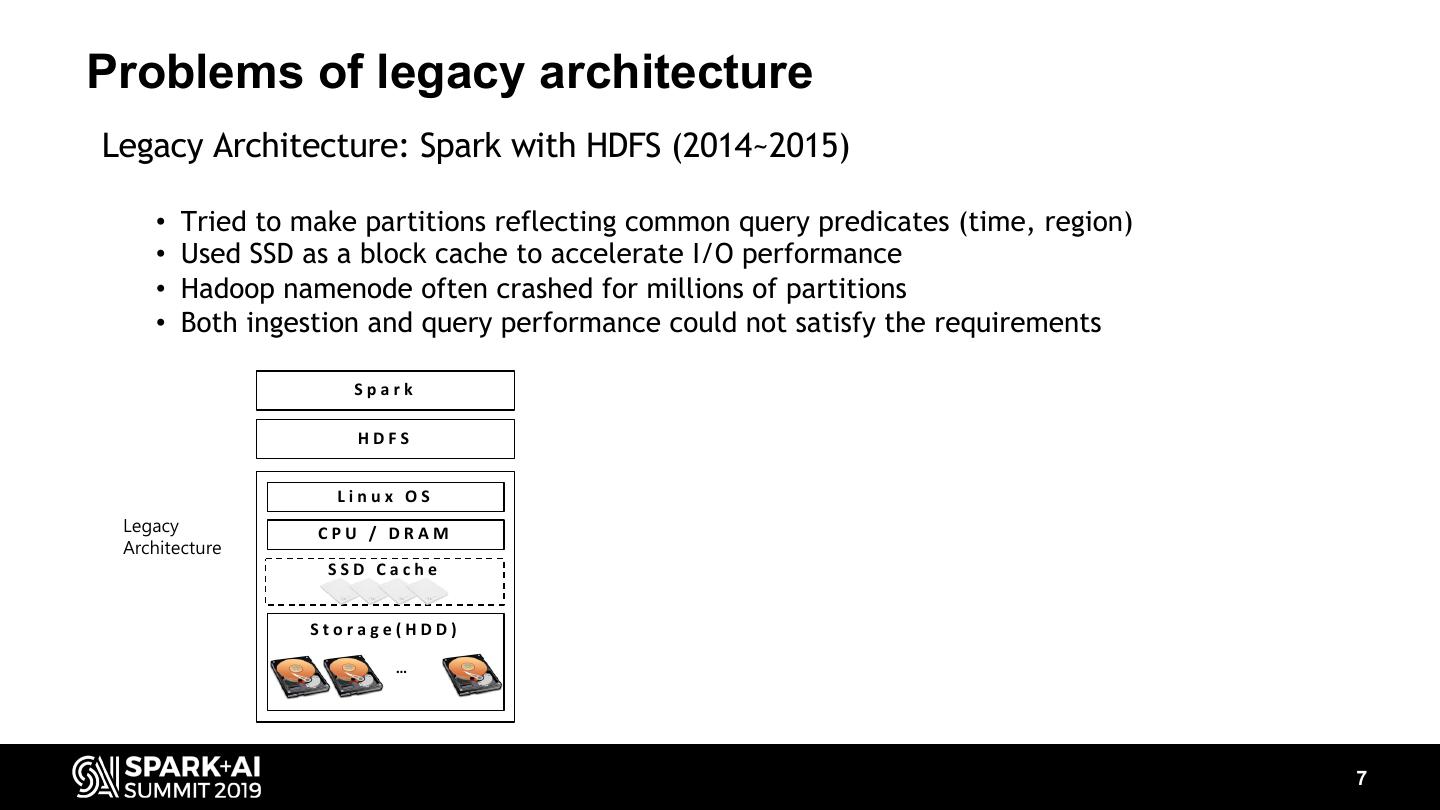
7 .Problems of legacy architecture Legacy Architecture: Spark with HDFS (2014~2015) • Tried to make partitions reflecting common query predicates (time, region) • Used SSD as a block cache to accelerate I/O performance • Hadoop namenode often crashed for millions of partitions • Both ingestion and query performance could not satisfy the requirements Spark HDFS Linux OS Legacy CPU / DRAM Architecture SSD Cache Storage(HDD) … 7
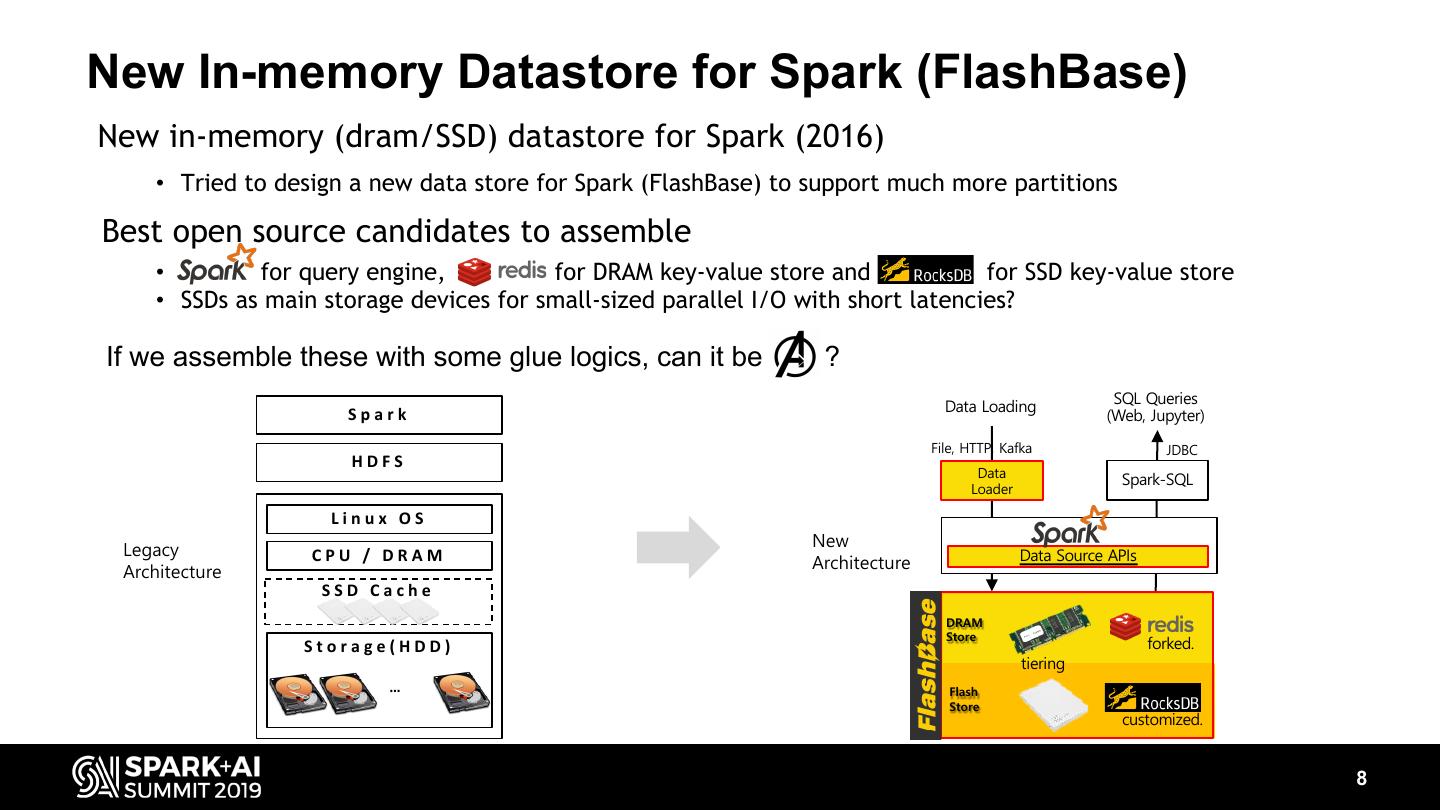
8 .New In-memory Datastore for Spark (FlashBase) New in-memory (dram/SSD) datastore for Spark (2016) • Tried to design a new data store for Spark (FlashBase) to support much more partitions Best open source candidates to assemble • for query engine, for DRAM key-value store and for SSD key-value store • SSDs as main storage devices for small-sized parallel I/O with short latencies? If we assemble these with some glue logics, can it be ? SQL Queries Spark Data Loading (Web, Jupyter) File, HTTP, Kafka JDBC HDFS Data Spark-SQL Loader Linux OS New Legacy CPU / DRAM Data Source APIs Architecture Architecture SSD Cache DRAM Store Storage(HDD) forked. tiering … Flash Store customized. 8
9 .Initial avengers didn’t get along 9
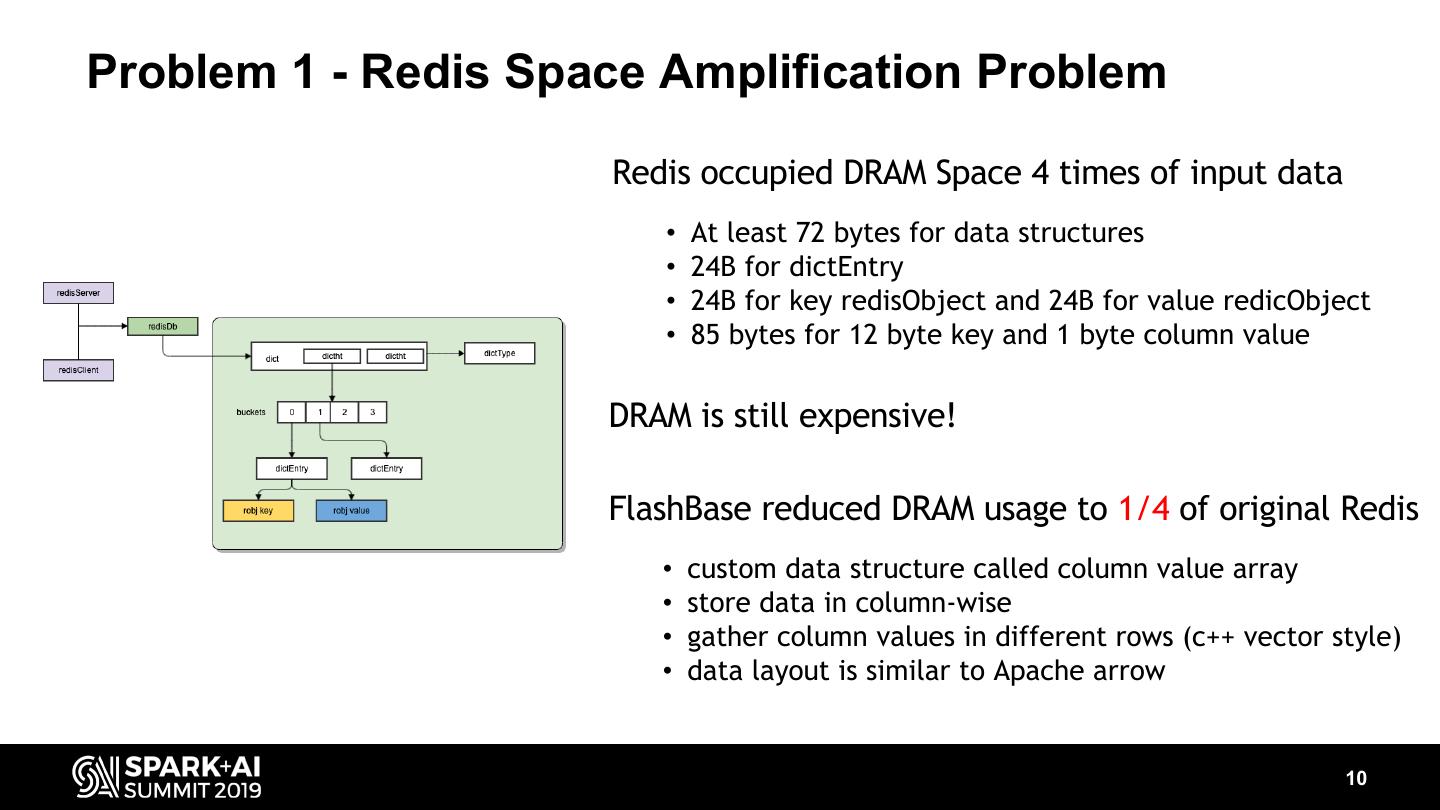
10 .Problem 1 - Redis Space Amplification Problem Redis occupied DRAM Space 4 times of input data • At least 72 bytes for data structures • 24B for dictEntry • 24B for key redisObject and 24B for value redicObject • 85 bytes for 12 byte key and 1 byte column value DRAM is still expensive! FlashBase reduced DRAM usage to 1/4 of original Redis • custom data structure called column value array • store data in column-wise • gather column values in different rows (c++ vector style) • data layout is similar to Apache arrow 10
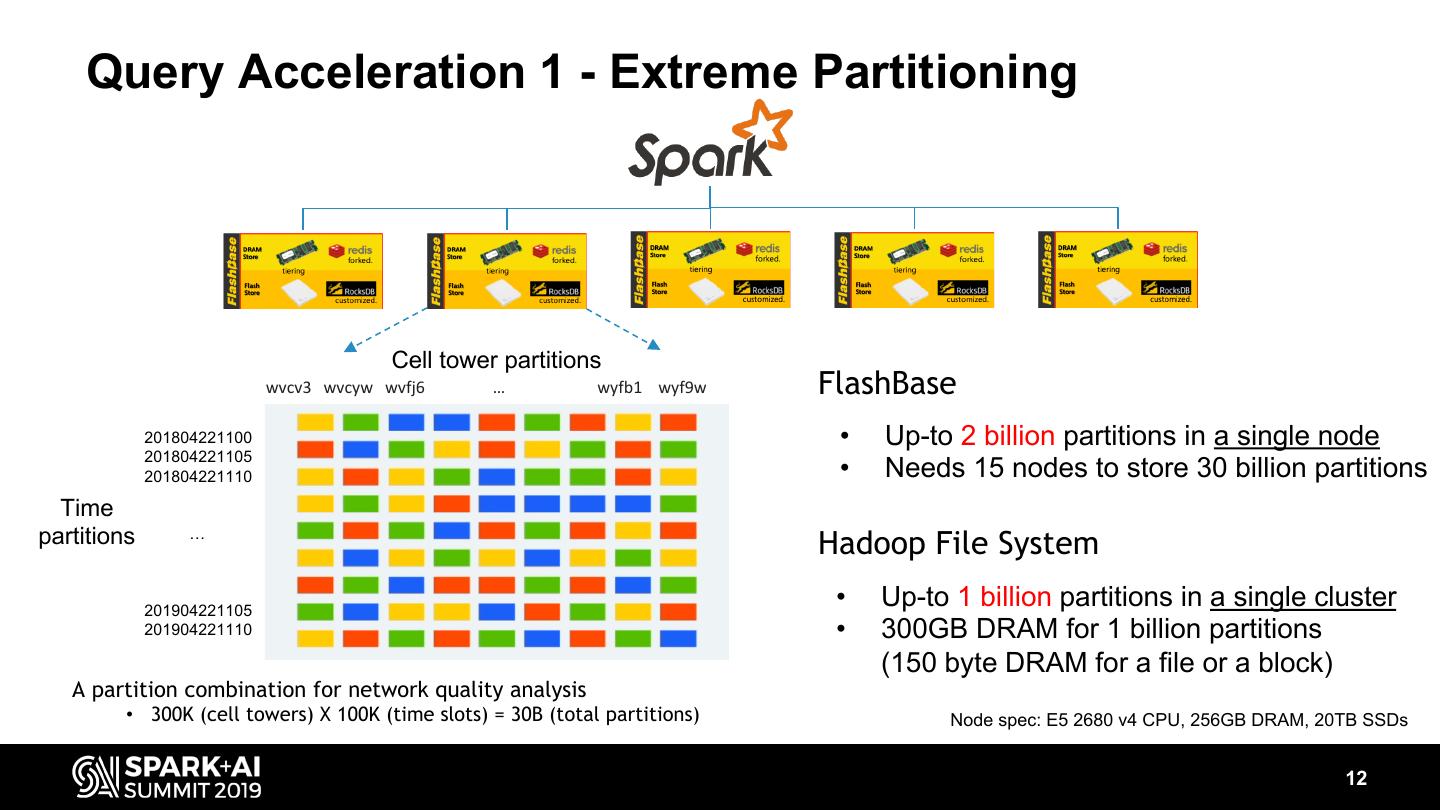
11 .Problem 2 - Rocksdb Write Amplification Problem Rocksdb wrote 40 times of input data to SSDs • Rocksdb consists of multi-level indexes with sorted key values in each level • Key values are migrated from top level to next level by compaction algorithm • Key values are written multiple times (# of levels) with larger update regions (a factor of level multiplier) The more writes, the faster SSD fault! • SSDs have limitation on the number of drive writes (DWPD) • SSD fault causes service down time and more TCO for replacing SSDs FlashBase reduced writes to 1/10 of original Rocksdb • Customized rocksdb for compaction job to avoid next level update at most • 5 times better ingestion performance, and 1/10 TCO for SSD replacement 11
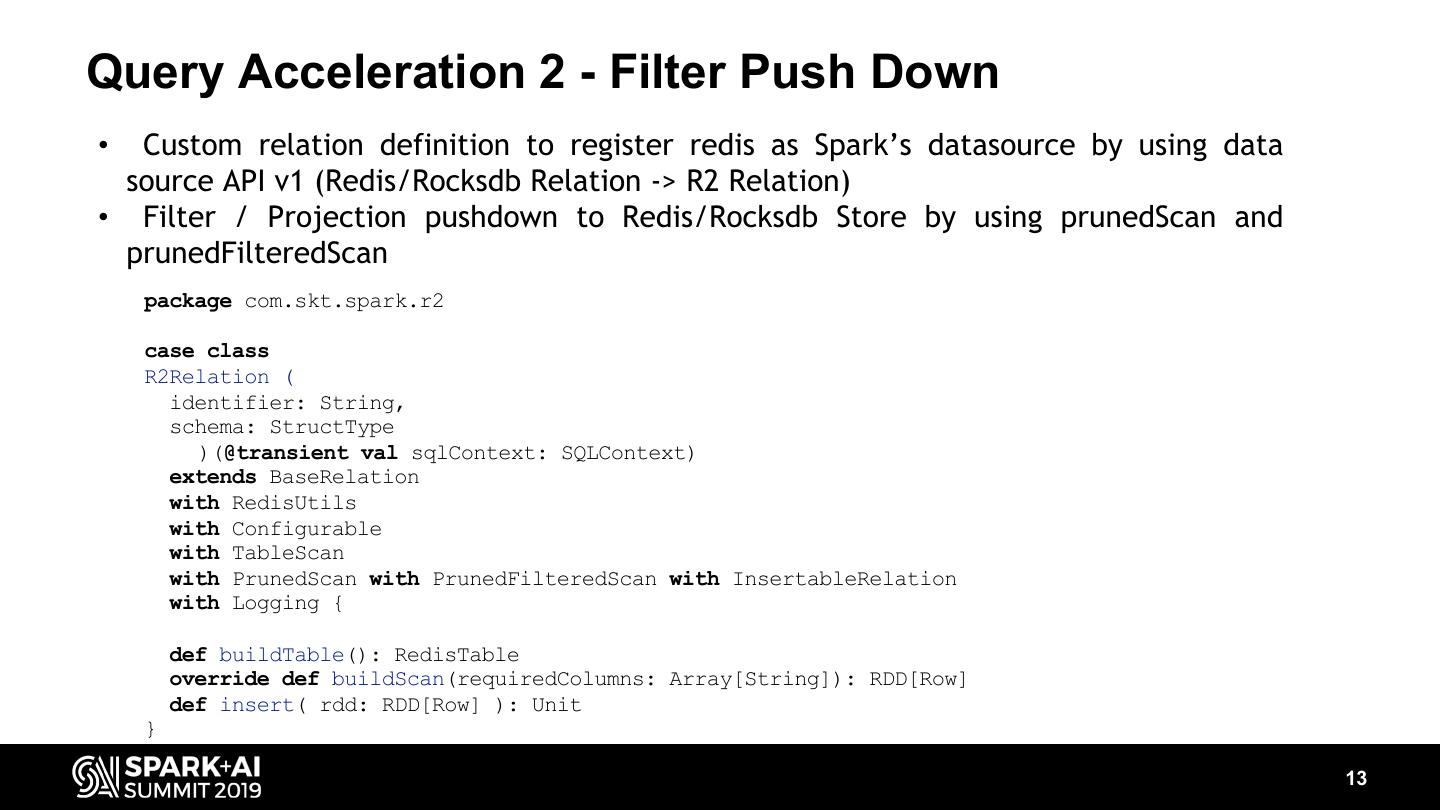
12 . Query Acceleration 1 - Extreme Partitioning Cell tower partitions wvcv3 wvcyw wvfj6 … wyfb1 wyf9w FlashBase 201804221100 • Up-to 2 billion partitions in a single node 201804221105 201804221110 • Needs 15 nodes to store 30 billion partitions Time partitions … Hadoop File System 201904221105 • Up-to 1 billion partitions in a single cluster 201904221110 • 300GB DRAM for 1 billion partitions (150 byte DRAM for a file or a block) A partition combination for network quality analysis • 300K (cell towers) X 100K (time slots) = 30B (total partitions) Node spec: E5 2680 v4 CPU, 256GB DRAM, 20TB SSDs 12
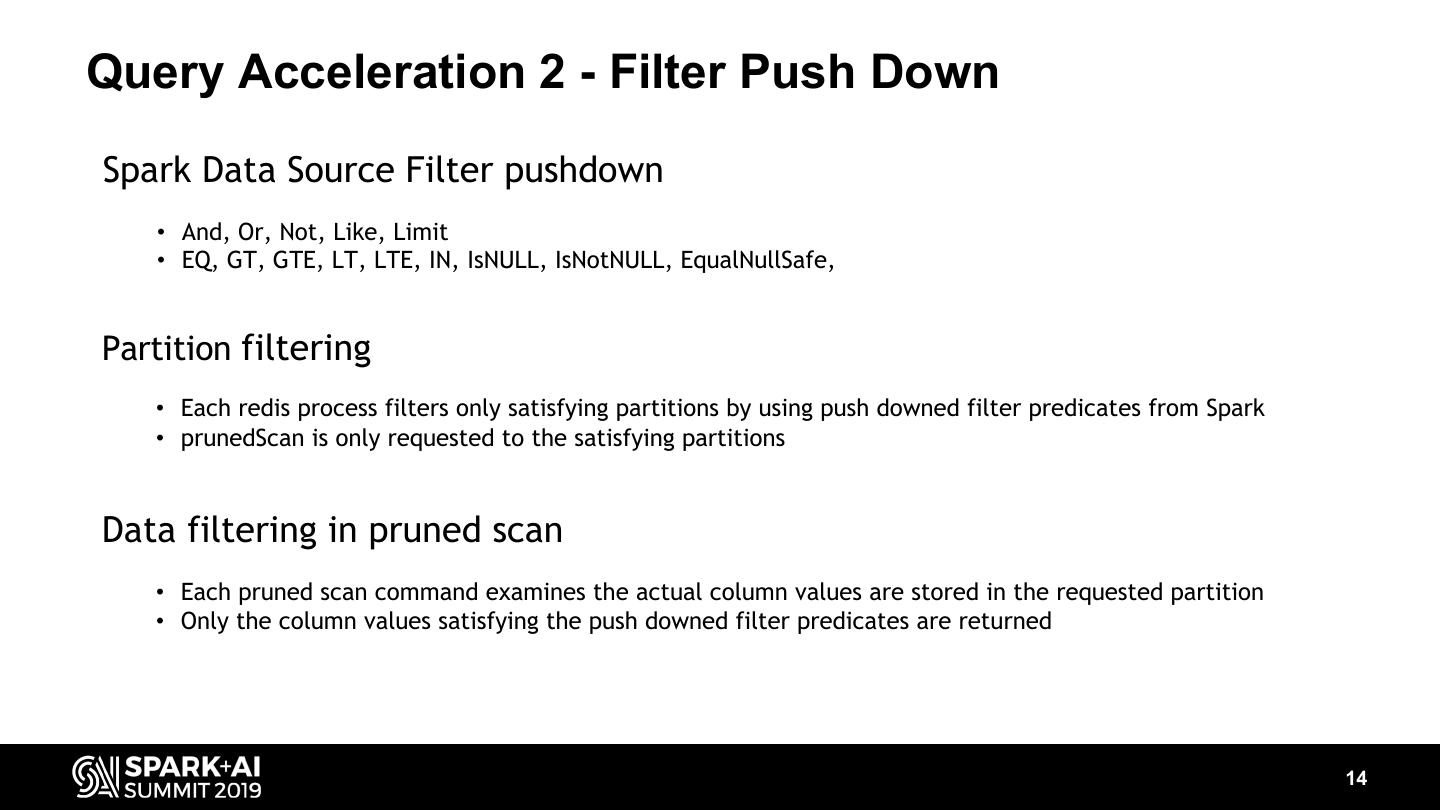
13 .Query Acceleration 2 - Filter Push Down • Custom relation definition to register redis as Spark’s datasource by using data source API v1 (Redis/Rocksdb Relation -> R2 Relation) • Filter / Projection pushdown to Redis/Rocksdb Store by using prunedScan and prunedFilteredScan package com.skt.spark.r2 case class R2Relation ( identifier: String, schema: StructType )(@transient val sqlContext: SQLContext) extends BaseRelation with RedisUtils with Configurable with TableScan with PrunedScan with PrunedFilteredScan with InsertableRelation with Logging { def buildTable(): RedisTable override def buildScan(requiredColumns: Array[String]): RDD[Row] def insert( rdd: RDD[Row] ): Unit } 13
14 .Query Acceleration 2 - Filter Push Down Spark Data Source Filter pushdown • And, Or, Not, Like, Limit • EQ, GT, GTE, LT, LTE, IN, IsNULL, IsNotNULL, EqualNullSafe, Partition filtering • Each redis process filters only satisfying partitions by using push downed filter predicates from Spark • prunedScan is only requested to the satisfying partitions Data filtering in pruned scan • Each pruned scan command examines the actual column values are stored in the requested partition • Only the column values satisfying the push downed filter predicates are returned 14
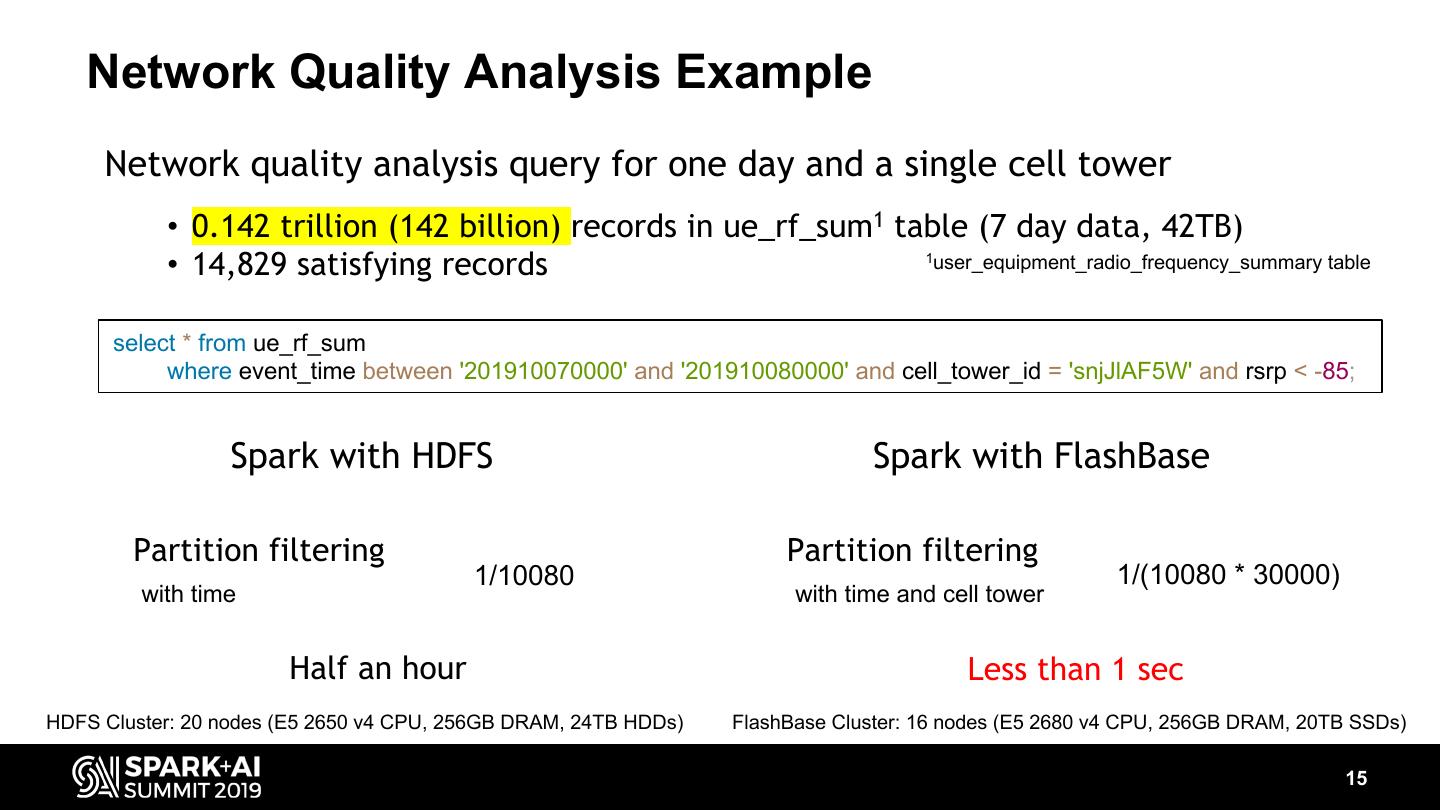
15 . Network Quality Analysis Example Network quality analysis query for one day and a single cell tower • 0.142 trillion (142 billion) records in ue_rf_sum1 table (7 day data, 42TB) • 14,829 satisfying records 1user_equipment_radio_frequency_summary table select * from ue_rf_sum where event_time between '201910070000' and '201910080000' and cell_tower_id = 'snjJlAF5W' and rsrp < -85; Spark with HDFS Spark with FlashBase Partition filtering Partition filtering 1/10080 1/(10080 * 30000) with time with time and cell tower Half an hour Less than 1 sec HDFS Cluster: 20 nodes (E5 2650 v4 CPU, 256GB DRAM, 24TB HDDs) FlashBase Cluster: 16 nodes (E5 2680 v4 CPU, 256GB DRAM, 20TB SSDs) 15
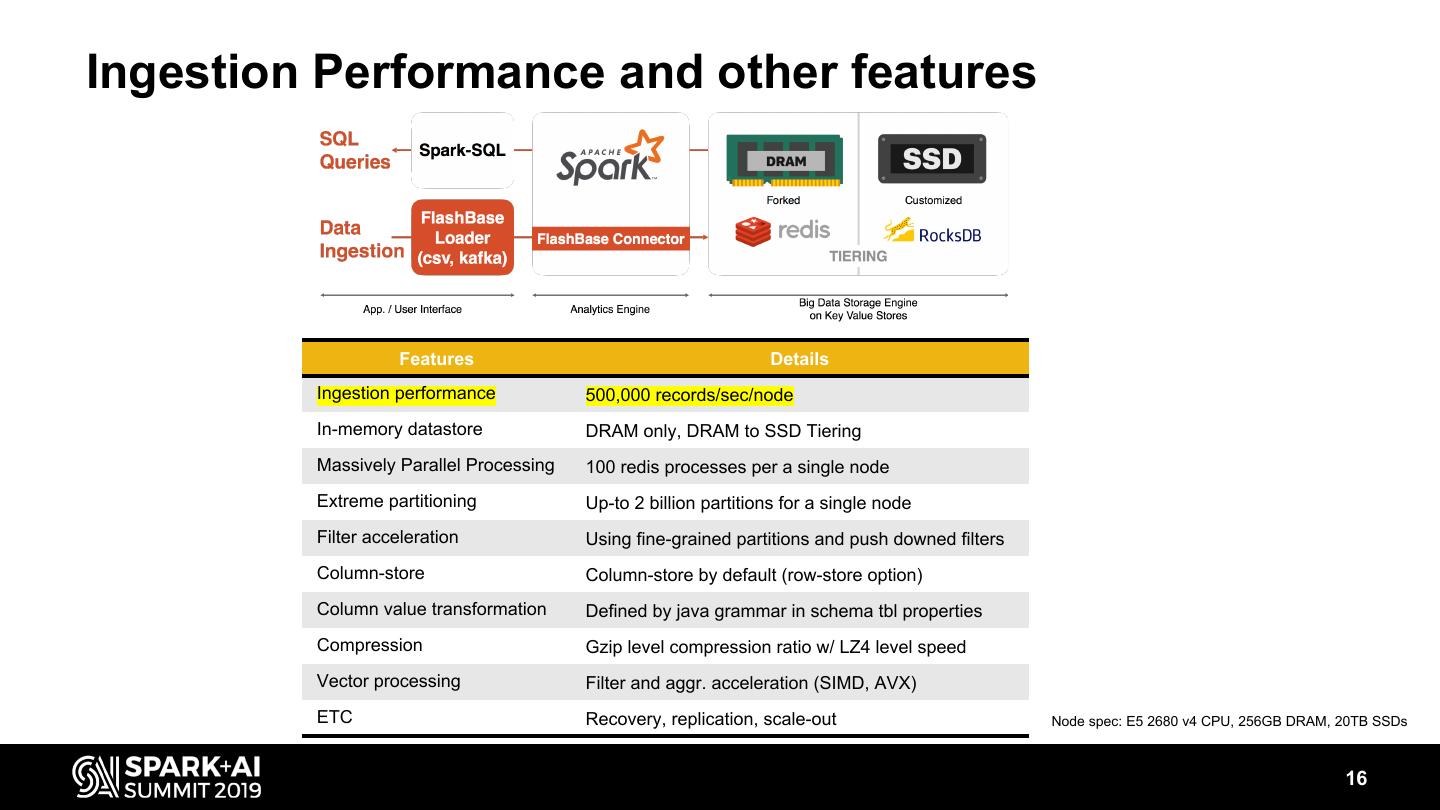
16 .Ingestion Performance and other features Features Details Ingestion performance 500,000 records/sec/node In-memory datastore DRAM only, DRAM to SSD Tiering Massively Parallel Processing 100 redis processes per a single node Extreme partitioning Up-to 2 billion partitions for a single node Filter acceleration Using fine-grained partitions and push downed filters Column-store Column-store by default (row-store option) Column value transformation Defined by java grammar in schema tbl properties Compression Gzip level compression ratio w/ LZ4 level speed Vector processing Filter and aggr. acceleration (SIMD, AVX) ETC Recovery, replication, scale-out Node spec: E5 2680 v4 CPU, 256GB DRAM, 20TB SSDs 16
17 .Seven Production Hells 17
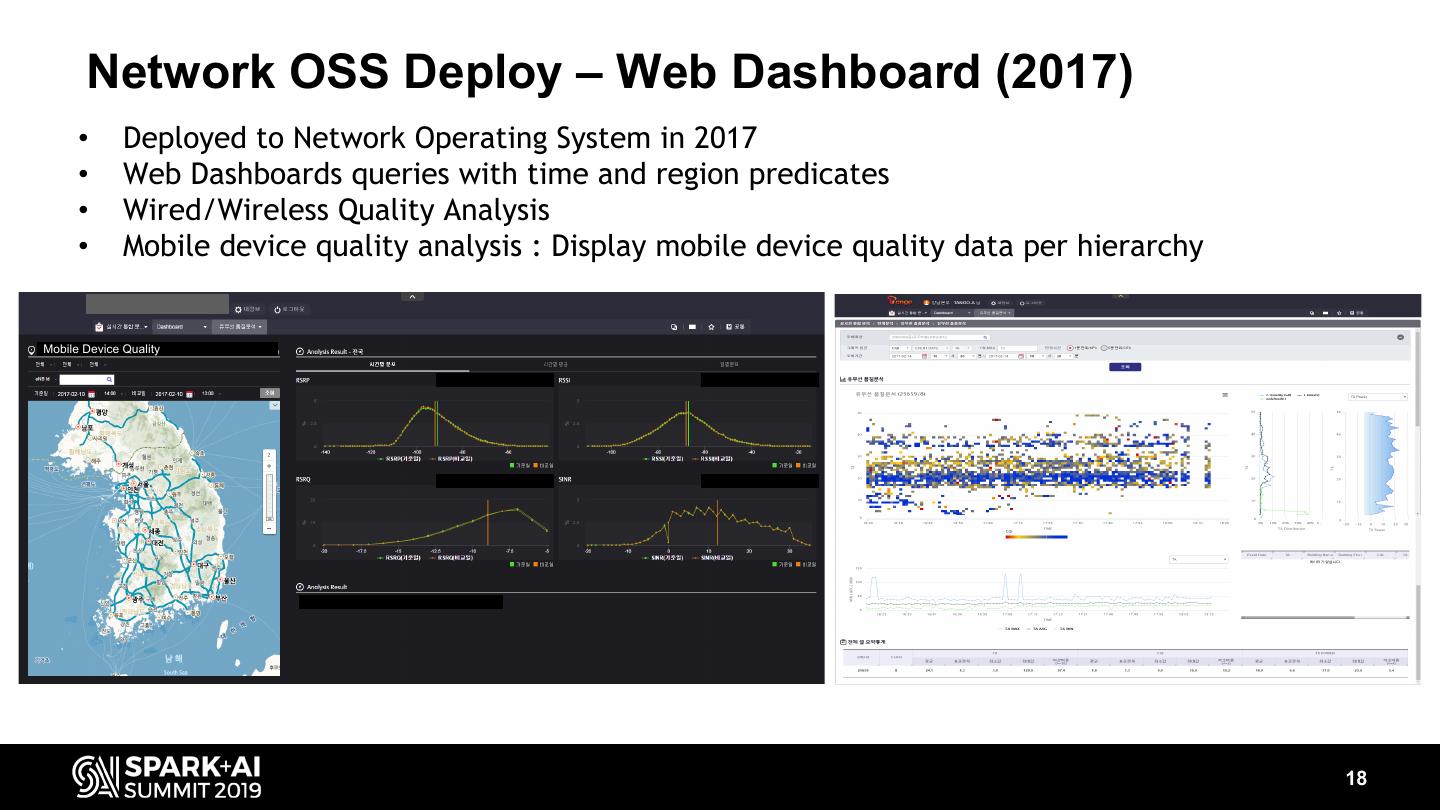
18 . Network OSS Deploy – Web Dashboard (2017) • Deployed to Network Operating System in 2017 • Web Dashboards queries with time and region predicates • Wired/Wireless Quality Analysis • Mobile device quality analysis : Display mobile device quality data per hierarchy Mobile Device Quality 18
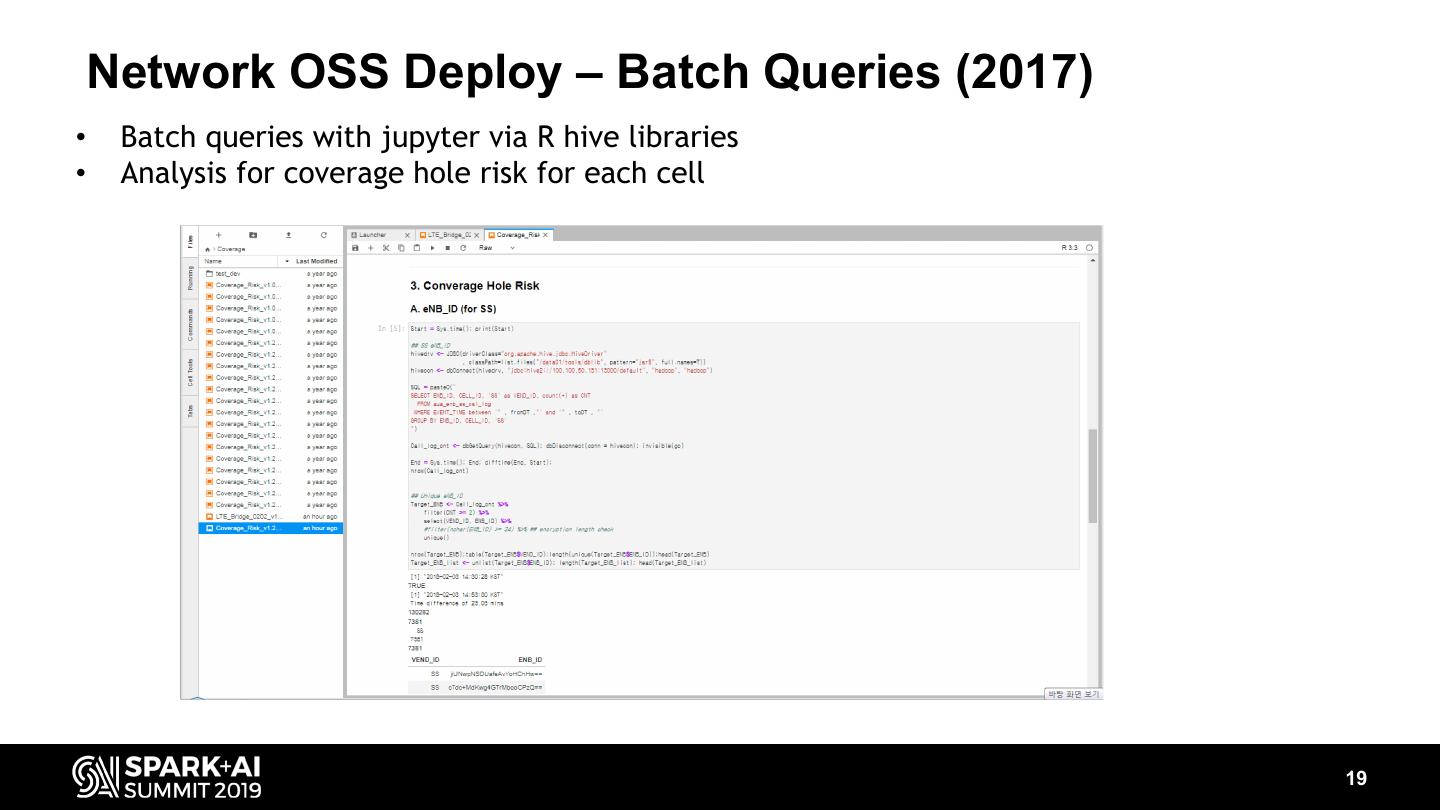
19 . Network OSS Deploy – Batch Queries (2017) • Batch queries with jupyter via R hive libraries • Analysis for coverage hole risk for each cell 19
20 .Contents • Network Quality Analysis • Geospatial Visualization • Network Quality Prediction • Wrap up 20
21 . Why Geospatial Visualization? • Geospatial Analysis - Gathers, manipulates and displays geographic information system (GIS) data - Requires heavy aggregate computations → Good case to demonstrate real-time big data processing - Some companies demonstrated geospatial analysis to show advantages of GPU database over CPU database → We have tried it with Spark & FlashBase based on CPU 21
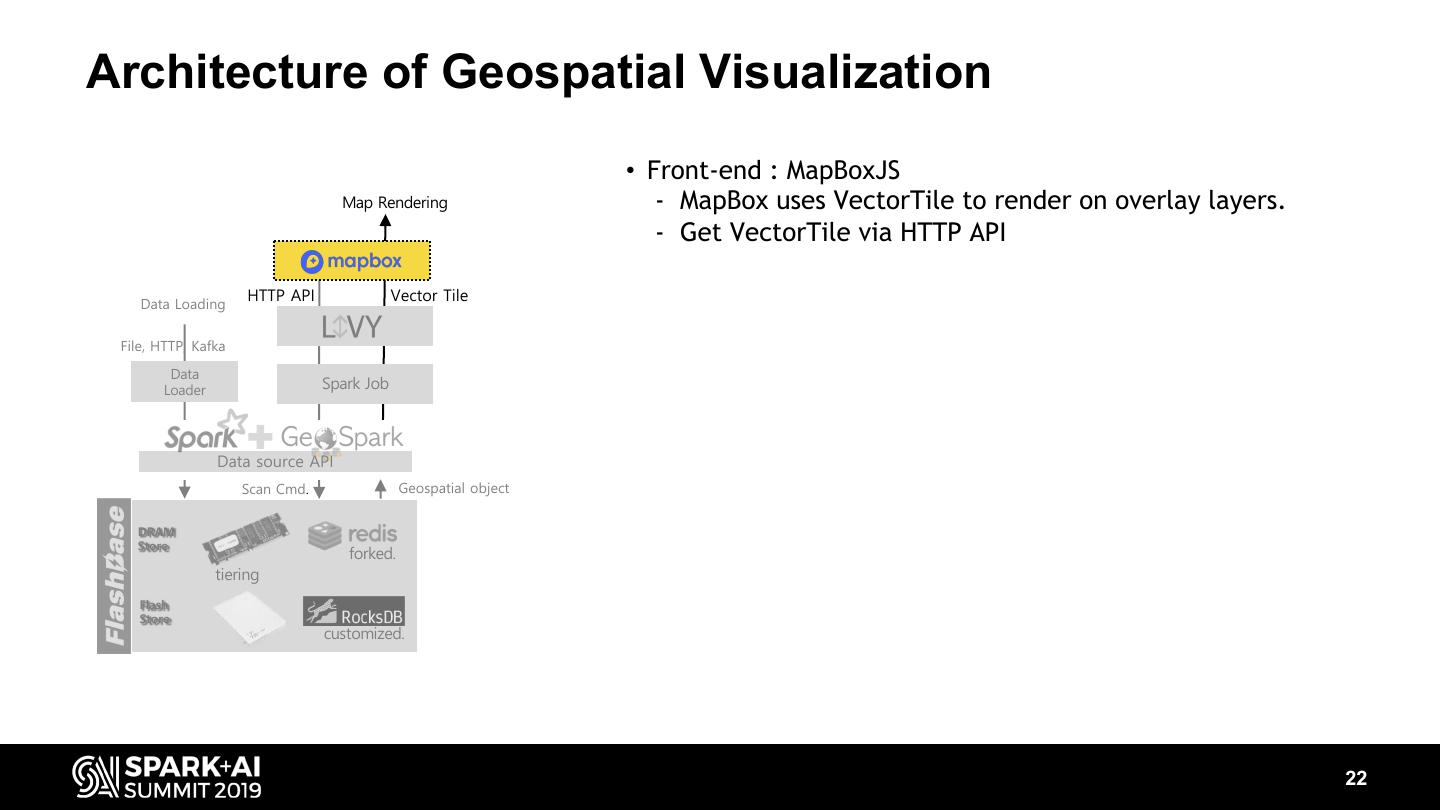
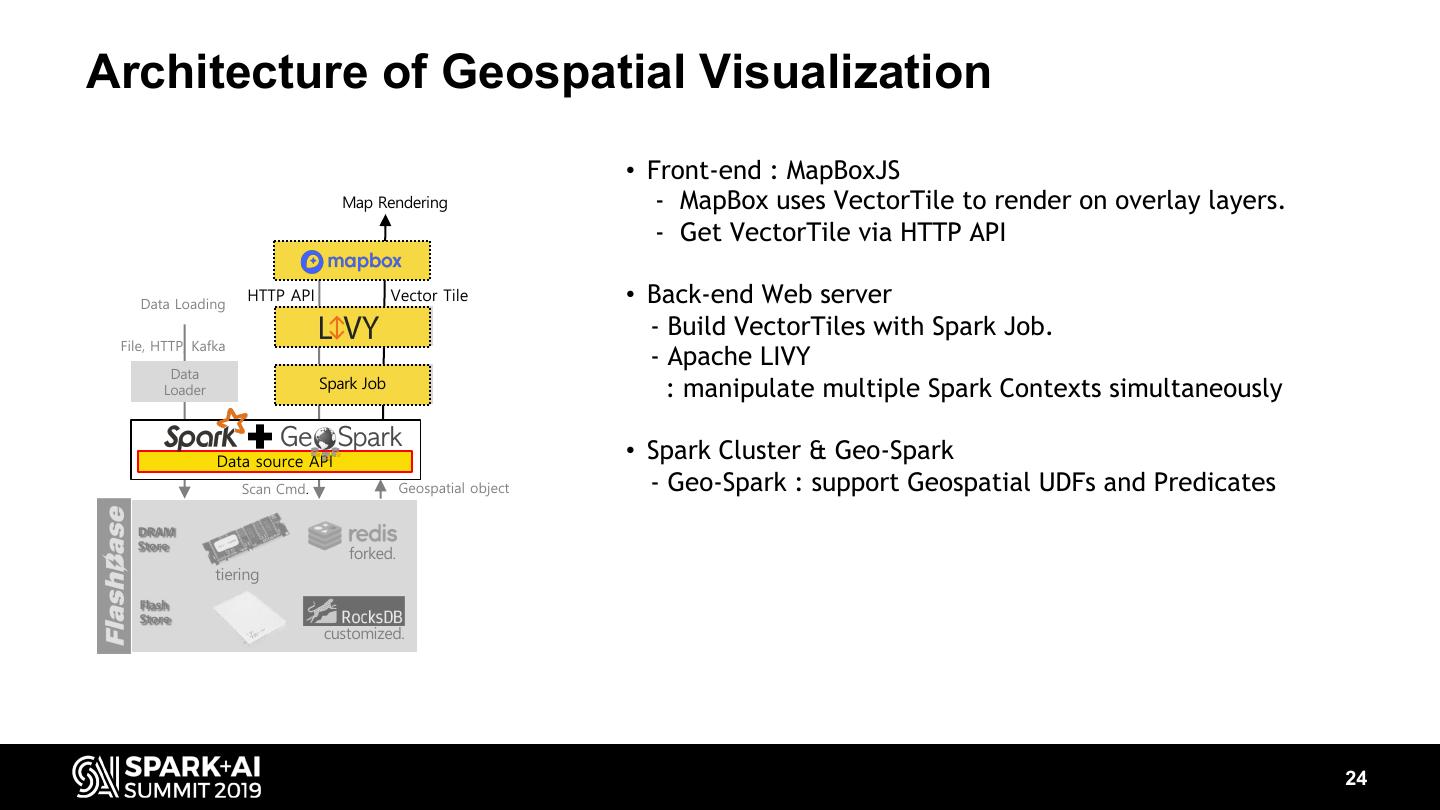
22 .Architecture of Geospatial Visualization • Front-end : MapBoxJS Map Rendering - MapBox uses VectorTile to render on overlay layers. - Get VectorTile via HTTP API Data Loading HTTP API Vector Tile File, HTTP, Kafka Data Loader Spark Job Data source API Scan Cmd. Geospatial object DRAM Store forked. tiering Flash Store customized. 22
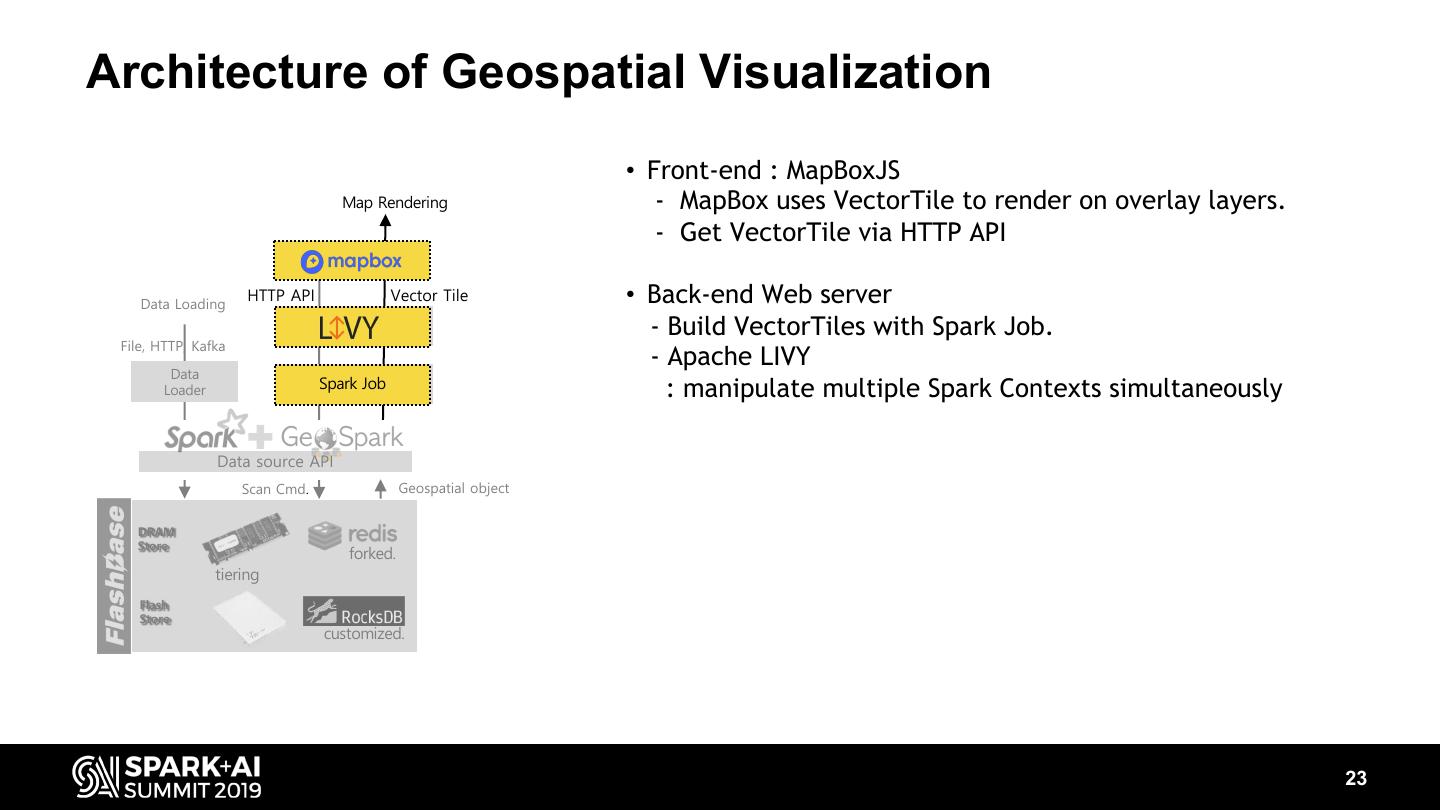
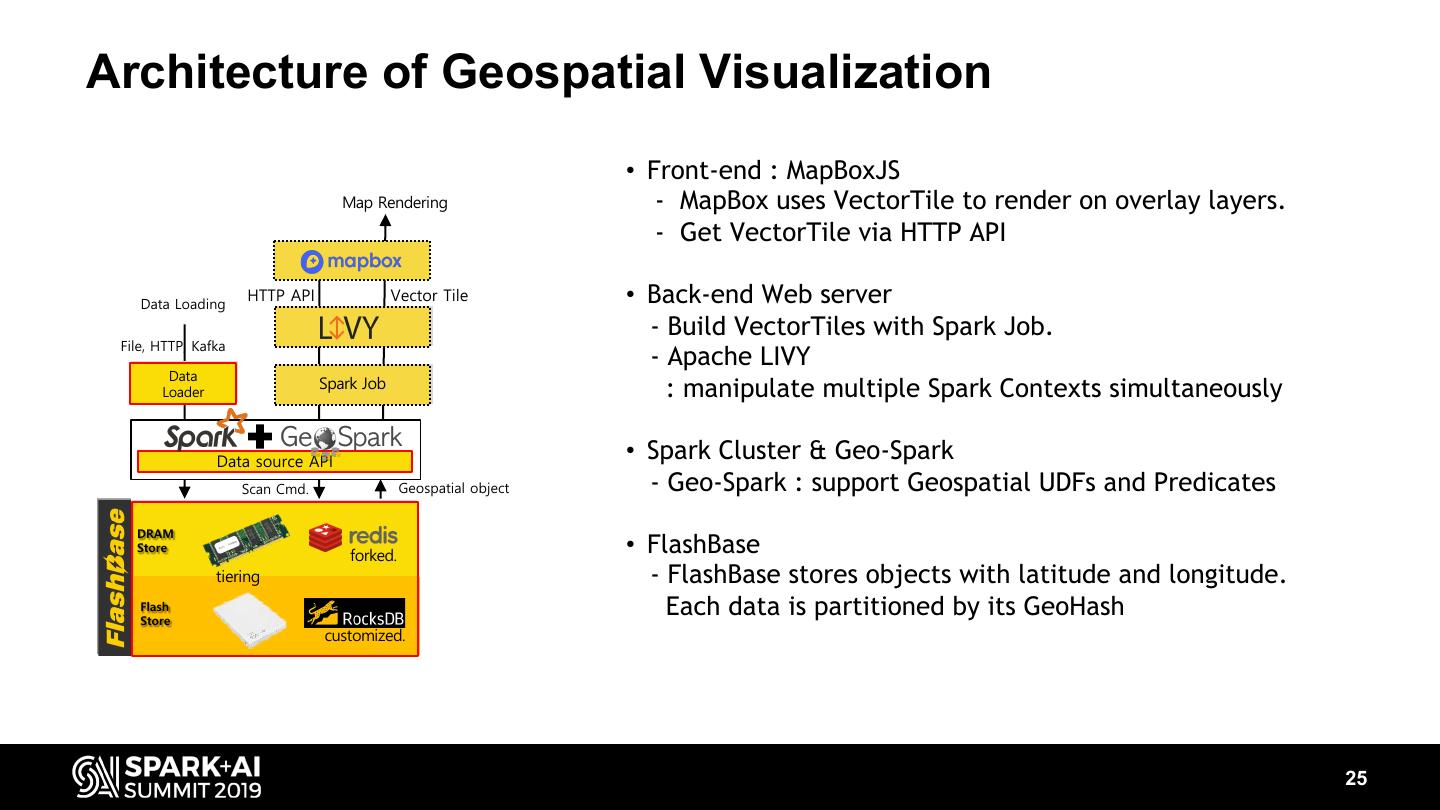
23 .Architecture of Geospatial Visualization • Front-end : MapBoxJS Map Rendering - MapBox uses VectorTile to render on overlay layers. - Get VectorTile via HTTP API Data Loading HTTP API Vector Tile • Back-end Web server - Build VectorTiles with Spark Job. File, HTTP, Kafka - Apache LIVY Data Spark Job Spark Job Loader : manipulate multiple Spark Contexts simultaneously Data source API Scan Cmd. Geospatial object DRAM Store forked. tiering Flash Store customized. 23
24 .Architecture of Geospatial Visualization • Front-end : MapBoxJS Map Rendering - MapBox uses VectorTile to render on overlay layers. - Get VectorTile via HTTP API Data Loading HTTP API Vector Tile • Back-end Web server - Build VectorTiles with Spark Job. File, HTTP, Kafka - Apache LIVY Data Spark Job Spark Job Loader : manipulate multiple Spark Contexts simultaneously Data source API • Spark Cluster & Geo-Spark Scan Cmd. Geospatial object - Geo-Spark : support Geospatial UDFs and Predicates DRAM Store forked. tiering Flash Store customized. 24
25 .Architecture of Geospatial Visualization • Front-end : MapBoxJS Map Rendering - MapBox uses VectorTile to render on overlay layers. - Get VectorTile via HTTP API Data Loading HTTP API Vector Tile • Back-end Web server - Build VectorTiles with Spark Job. File, HTTP, Kafka - Apache LIVY Data Data Spark Job Spark Job Loader Loader : manipulate multiple Spark Contexts simultaneously Data source API • Spark Cluster & Geo-Spark Scan Cmd. Geospatial object - Geo-Spark : support Geospatial UDFs and Predicates DRAM DRAM Store Store forked. • FlashBase tiering - FlashBase stores objects with latitude and longitude. Flash Flash Store Each data is partitioned by its GeoHash customized. 25
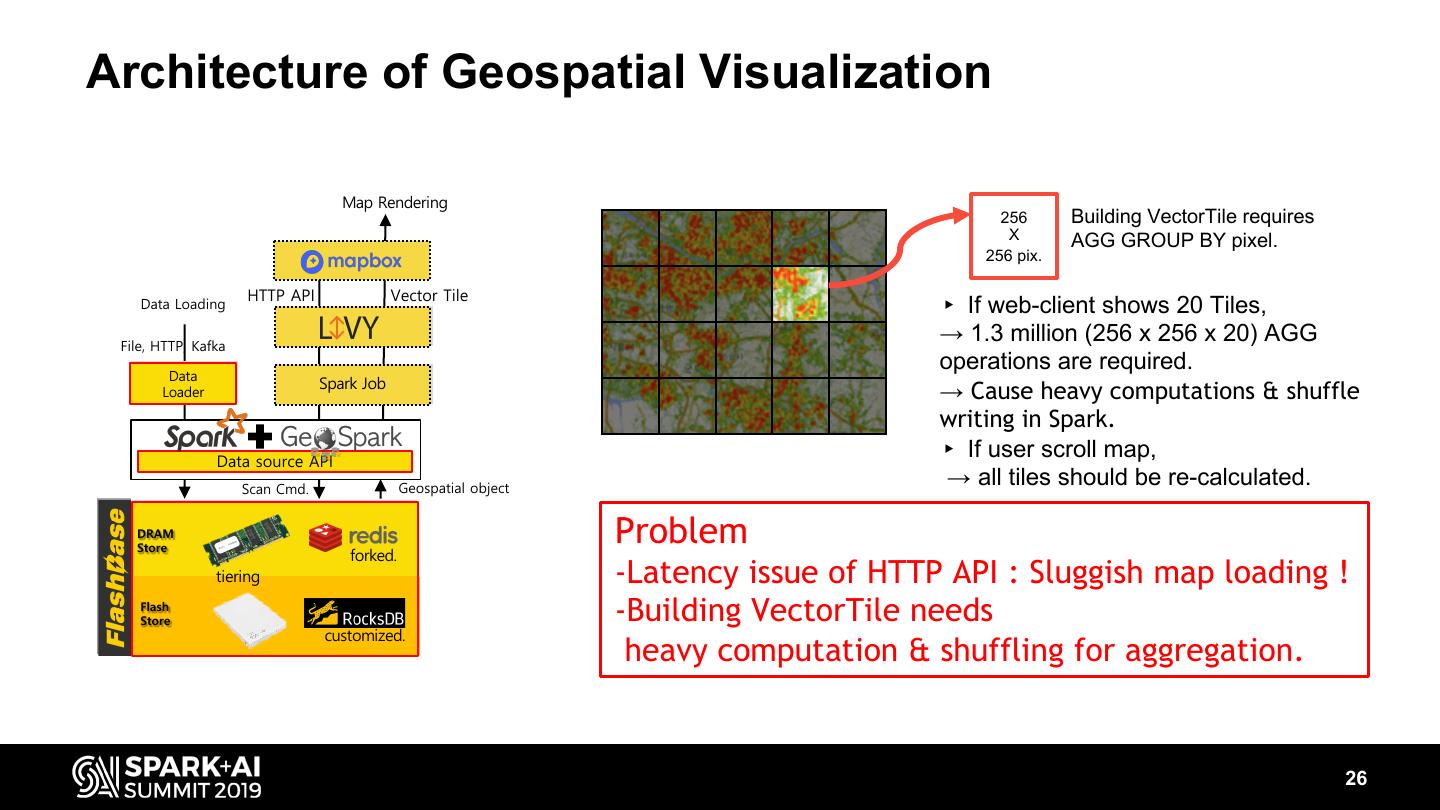
26 .Architecture of Geospatial Visualization Map Rendering 256 Building VectorTile requires X AGG GROUP BY pixel. 256 pix. HTTP API Vector Tile Data Loading ▸ If web-client shows 20 Tiles, File, HTTP, Kafka → 1.3 million (256 x 256 x 20) AGG Data operations are required. Data Spark Job Spark Job Loader Loader → Cause heavy computations & shuffle writing in Spark. Data source API ▸ If user scroll map, Scan Cmd. Geospatial object → all tiles should be re-calculated. DRAM DRAM Store Store forked. Problem tiering -Latency issue of HTTP API : Sluggish map loading ! Flash Flash Store -Building VectorTile needs customized. heavy computation & shuffling for aggregation. 26
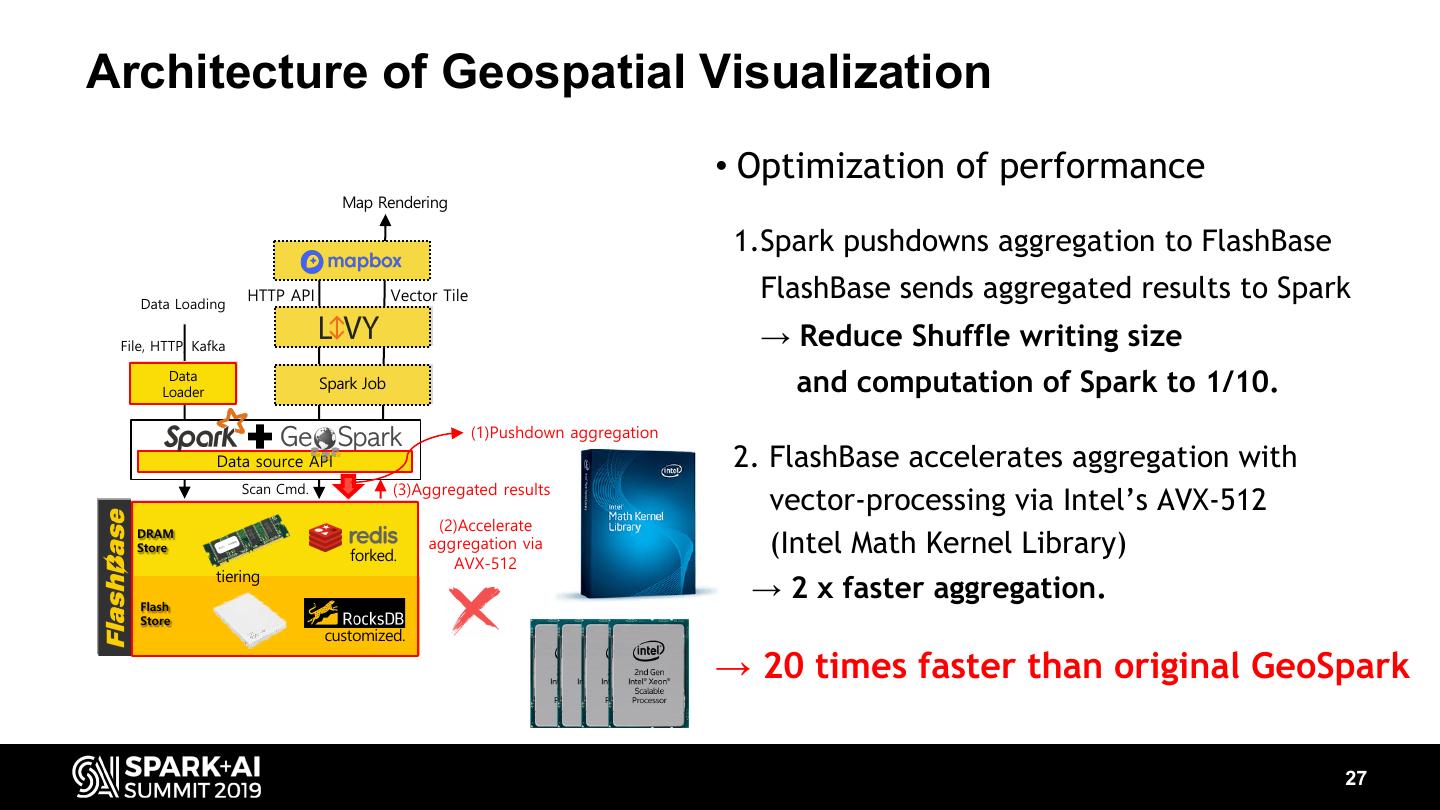
27 .Architecture of Geospatial Visualization • Optimization of performance Map Rendering 1.Spark pushdowns aggregation to FlashBase Data Loading HTTP API Vector Tile FlashBase sends aggregated results to Spark File, HTTP, Kafka → Reduce Shuffle writing size Data Data Loader Loader Spark Job Spark Job and computation of Spark to 1/10. (1)Pushdown aggregation Data source API 2. FlashBase accelerates aggregation with Scan Cmd. (3)Aggregated results vector-processing via Intel’s AVX-512 DRAM DRAM (2)Accelerate Store Store forked. aggregation via (Intel Math Kernel Library) AVX-512 tiering Flash Flash → 2 x faster aggregation. Store customized. → 20 times faster than original GeoSpark 27
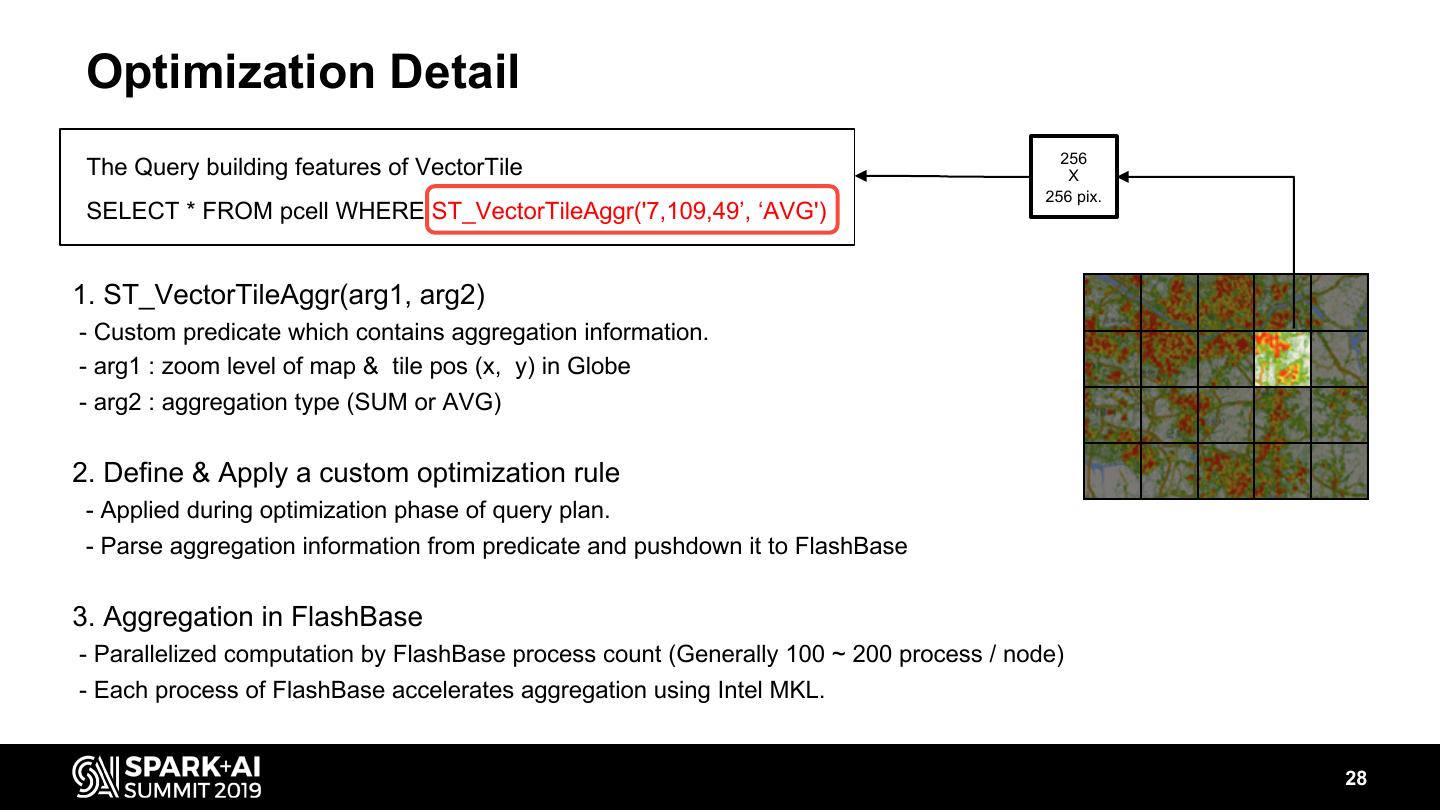
28 . Optimization Detail 256 The Query building features of VectorTile X 256 pix. SELECT * FROM pcell WHERE ST_VectorTileAggr('7,109,49’, ‘AVG') 1. ST_VectorTileAggr(arg1, arg2) - Custom predicate which contains aggregation information. - arg1 : zoom level of map & tile pos (x, y) in Globe - arg2 : aggregation type (SUM or AVG) 2. Define & Apply a custom optimization rule - Applied during optimization phase of query plan. - Parse aggregation information from predicate and pushdown it to FlashBase 3. Aggregation in FlashBase - Parallelized computation by FlashBase process count (Generally 100 ~ 200 process / node) - Each process of FlashBase accelerates aggregation using Intel MKL. 28
29 .Contents • Network Quality Analysis • Geospatial Visualization • Network Quality Prediction • Wrap up 29


