- 快召唤伙伴们来围观吧
- 微博 QQ QQ空间 贴吧
- 视频嵌入链接 文档嵌入链接
- <iframe src="https://www.slidestalk.com/Spark/ContinuousEvaluationofDeployedModelsinProduction?embed&video" frame border="0" width="640" height="360" scrolling="no" allowfullscreen="true">复制
- 微信扫一扫分享


Continuous Evaluation of Deployed Models in Production
Many high-tech industries rely on machine-learning systems in production environments to automatically classify and respond to vast amounts of incoming data. Despite their critical roles, these systems are often not actively monitored. When a problem first arises, it may go unnoticed for some time. Once it is noticed, investigating its underlying cause is a time-consuming, manual process. Wouldn’t it be great if the model’s output were automatically monitored? If they could be visualized, sliced by different dimensions? If the system could automatically detect performance degradation and trigger alerts? In this presentation, we describe our experience from building such a core machine-learning services: Model Evaluation.
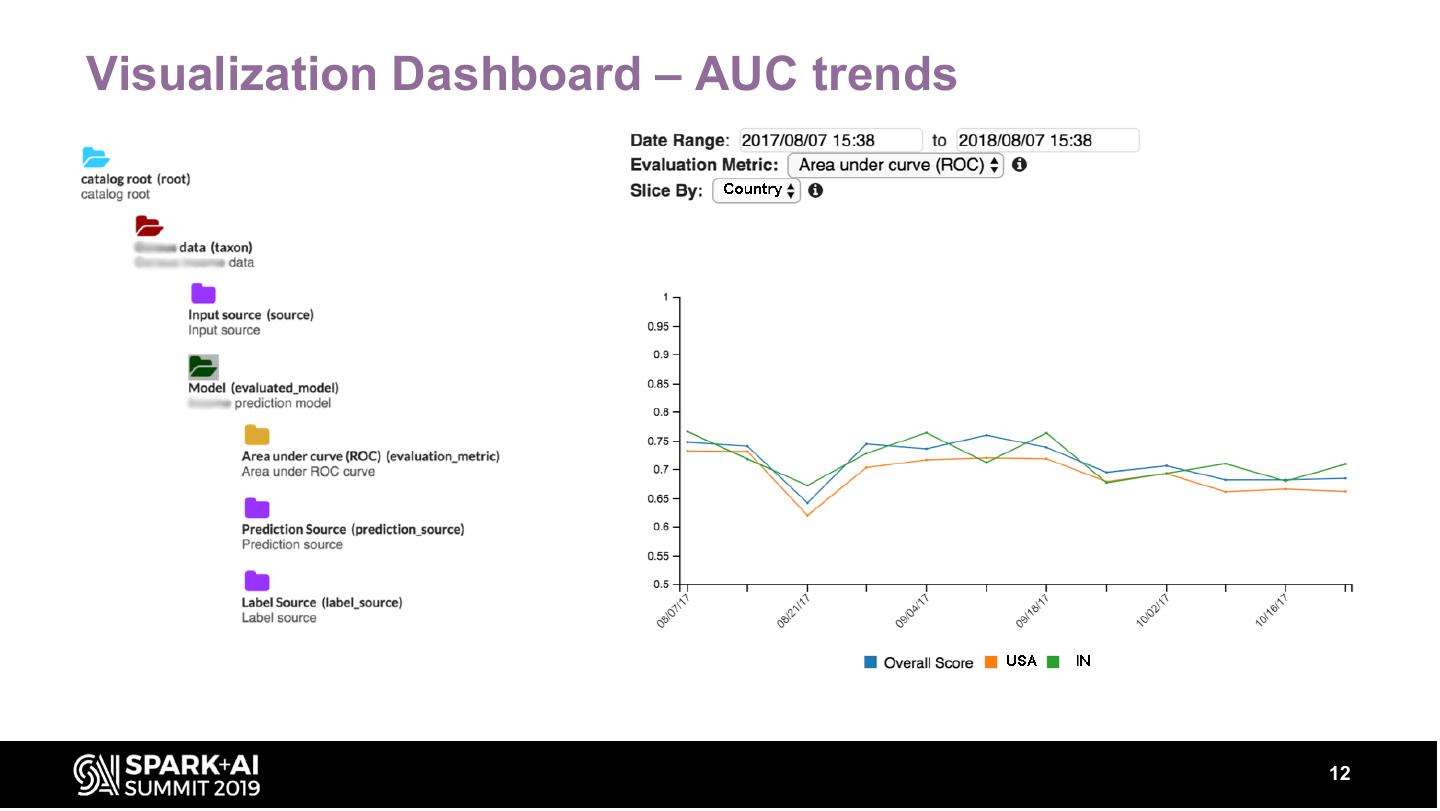
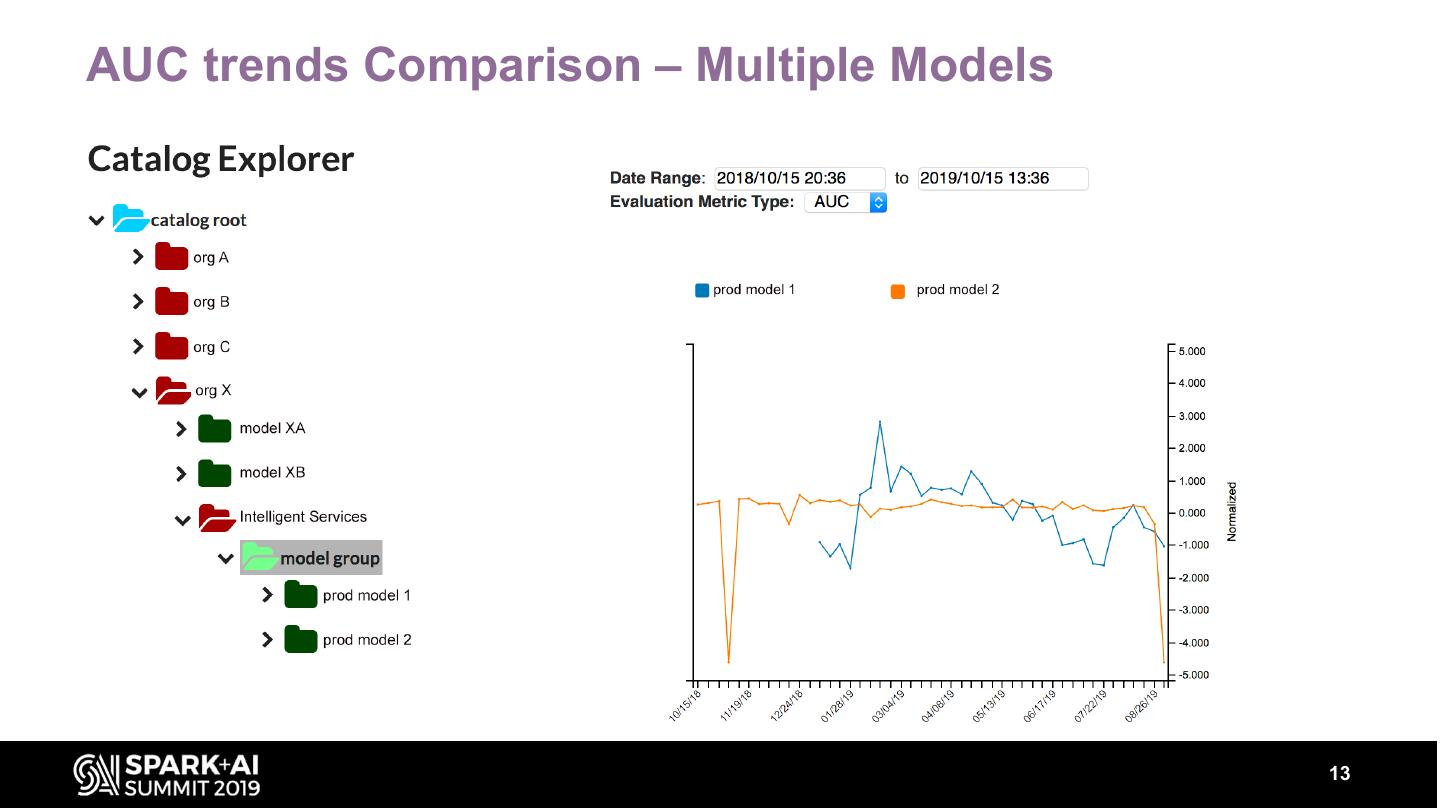
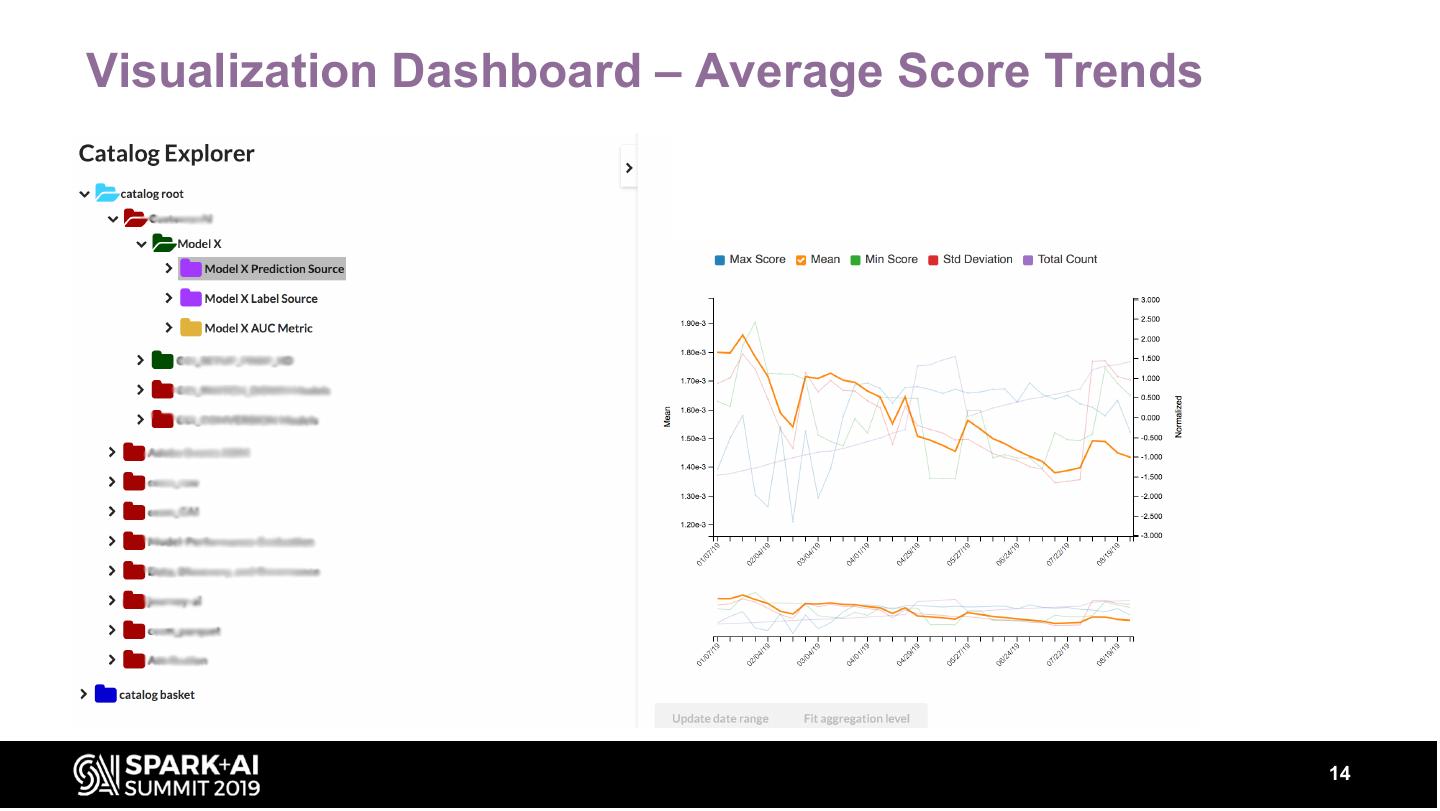
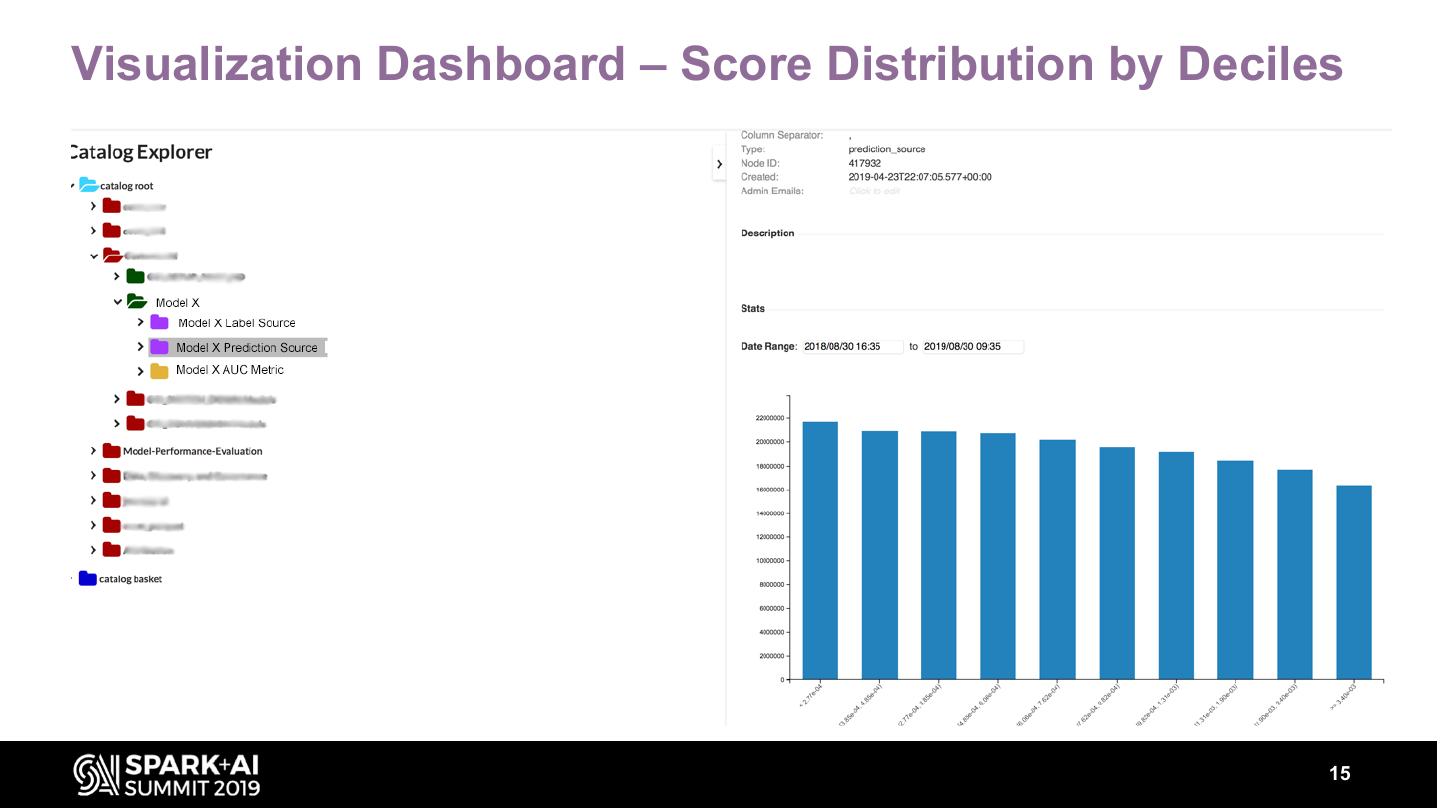
Our service provides automated, continuous evaluation of the performance of a deployed model over commonly-used metrics like the area-under-the-curve (AUC), root-mean-square-error (RMSE) etc. In addition, summary statistics about the model’s output, their distributions are also computed. The service also provides a dashboard to visualize the performance metrics, summary statistics and distributions of a model over time along with REST APIs to retrieve these metrics programmatically.
These metrics can be sliced by input features (e.g. Geography, Product type) to provide insights into model performance over different segments. The talk will describe various components that are required in building such a service and metrics of interest. Our system has a backend component built with spark on Azure Databricks. The backend can scale to analyze TBs of data to generate model evaluation metrics.
We will talk about how we modified Spark MLLib for computing AUC sliced by different dimensions and other optimizations in Spark to improve compute and performance. Our front-end and middle-tier, built with Docker and Azure Webapp provides visuals and REST APIs to retrieve the above metrics. This talk will cover various aspects of building, deploying and using the above system.
展开查看详情
1 .WIFI SSID:Spark+AISummit | Password: UnifiedDataAnalytics
2 .Continuous Evaluation of Deployed Models in Production Vijay Srivastava & Deepak Pai Adobe Inc. #UnifiedDataAnalytics #SparkAISummit
3 .Agenda Overview: ML Core Services • Services & Architecture Continuous Model Evaluation • Why do we need it? • Evaluation pipeline • Evaluation metrics - AUC trends, Score distribution Spark ML AUC optimization 3
4 .Core ML Services • ML Core Services • Major Services: – Data Quality, Summarization and Visualization – Continuous Model Evaluation – Causal Inference – Model Interpretation 4
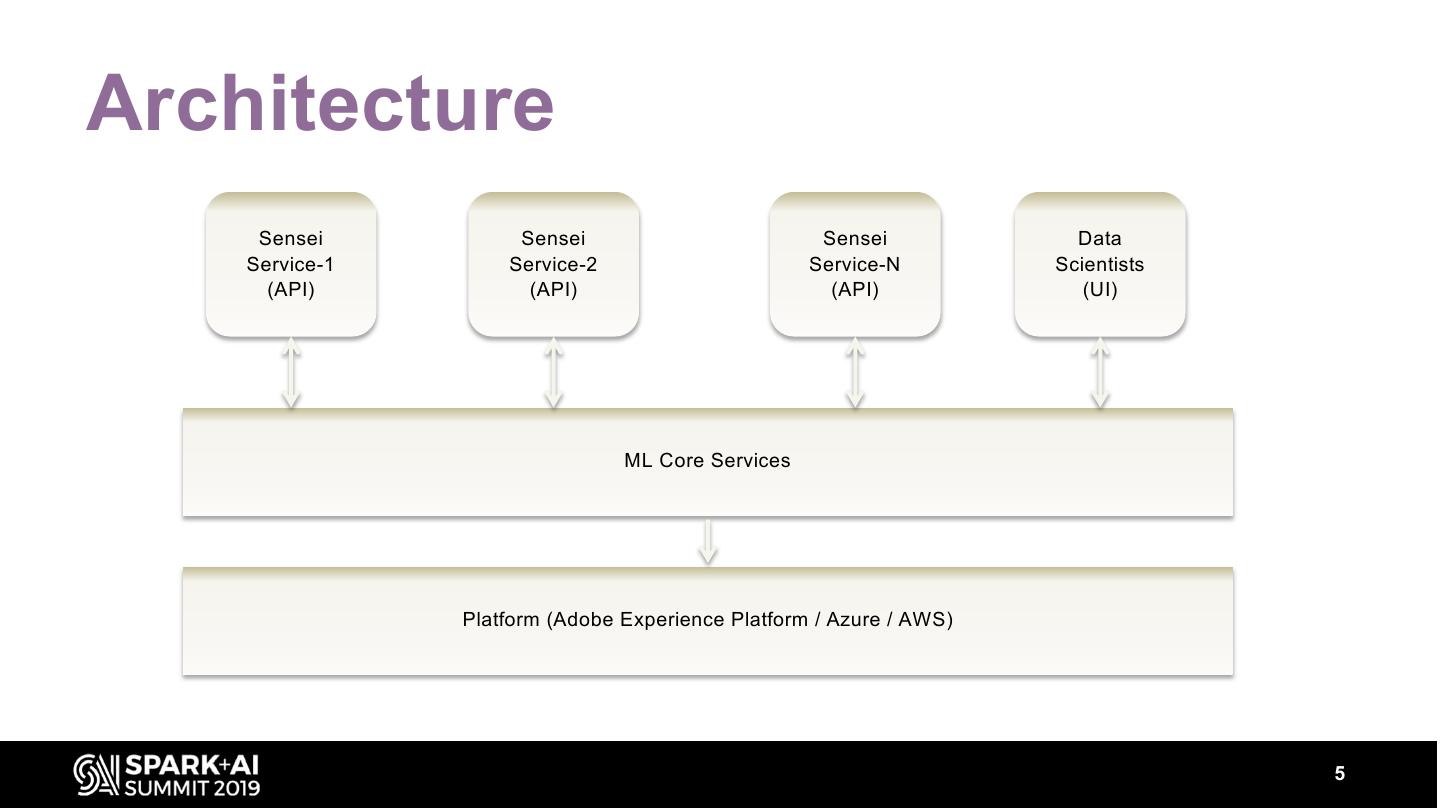
5 .Architecture Sensei Sensei Sensei Data Service-1 Service-2 Service-N Scientists (API) (API) (API) (UI) ML Core Services Platform (Adobe Experience Platform / Azure / AWS) 5
6 .Continuous Model Evaluation 6
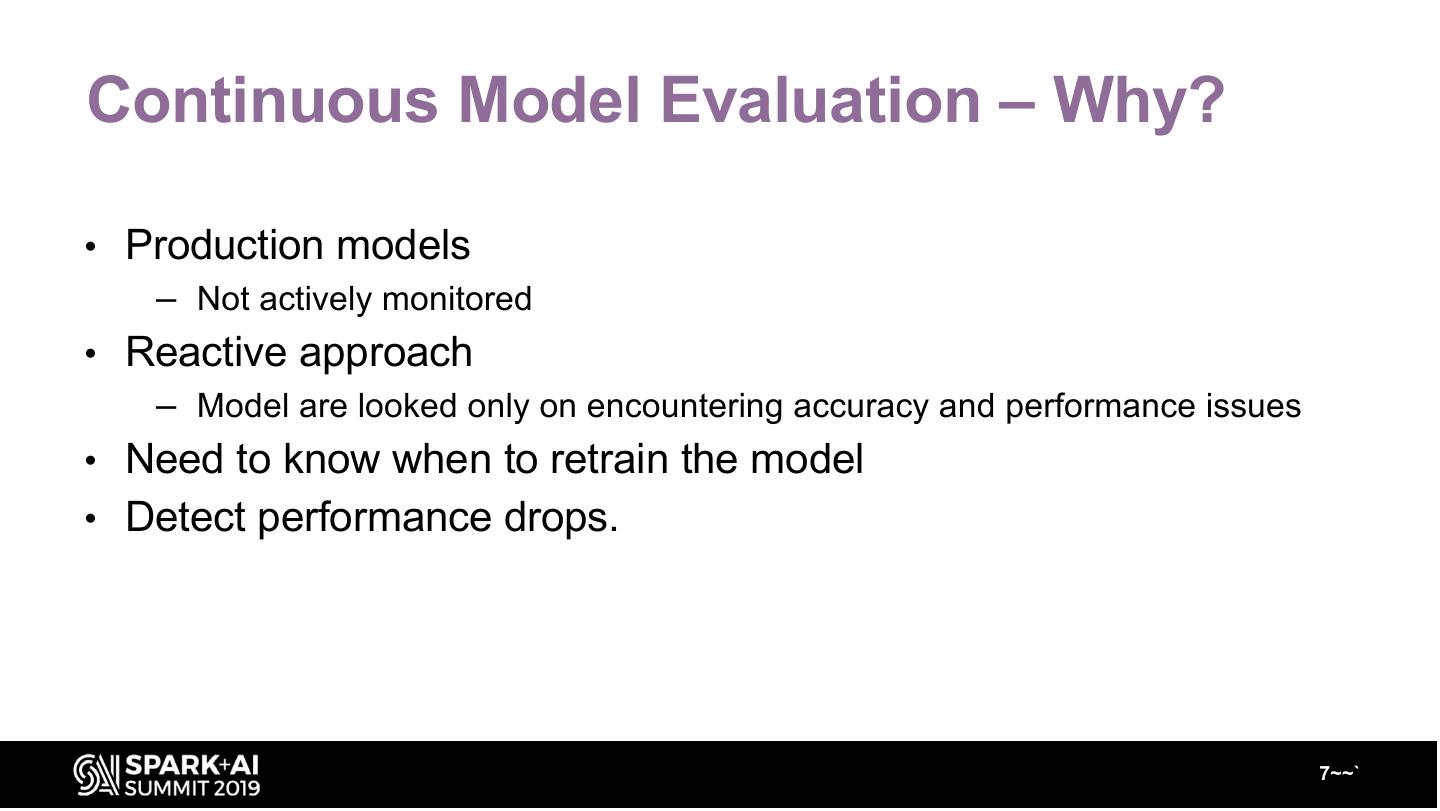
7 .Continuous Model Evaluation – Why? • Production models – Not actively monitored • Reactive approach – Model are looked only on encountering accuracy and performance issues • Need to know when to retrain the model • Detect performance drops. 7~~`
8 .Continuous Model Evaluation – How? • Automate performance evaluation/monitoring of models. • Score and Label distributions. • Visualize performance metrics sliced by attributes. • Detect performance drops and trigger alerts. 8
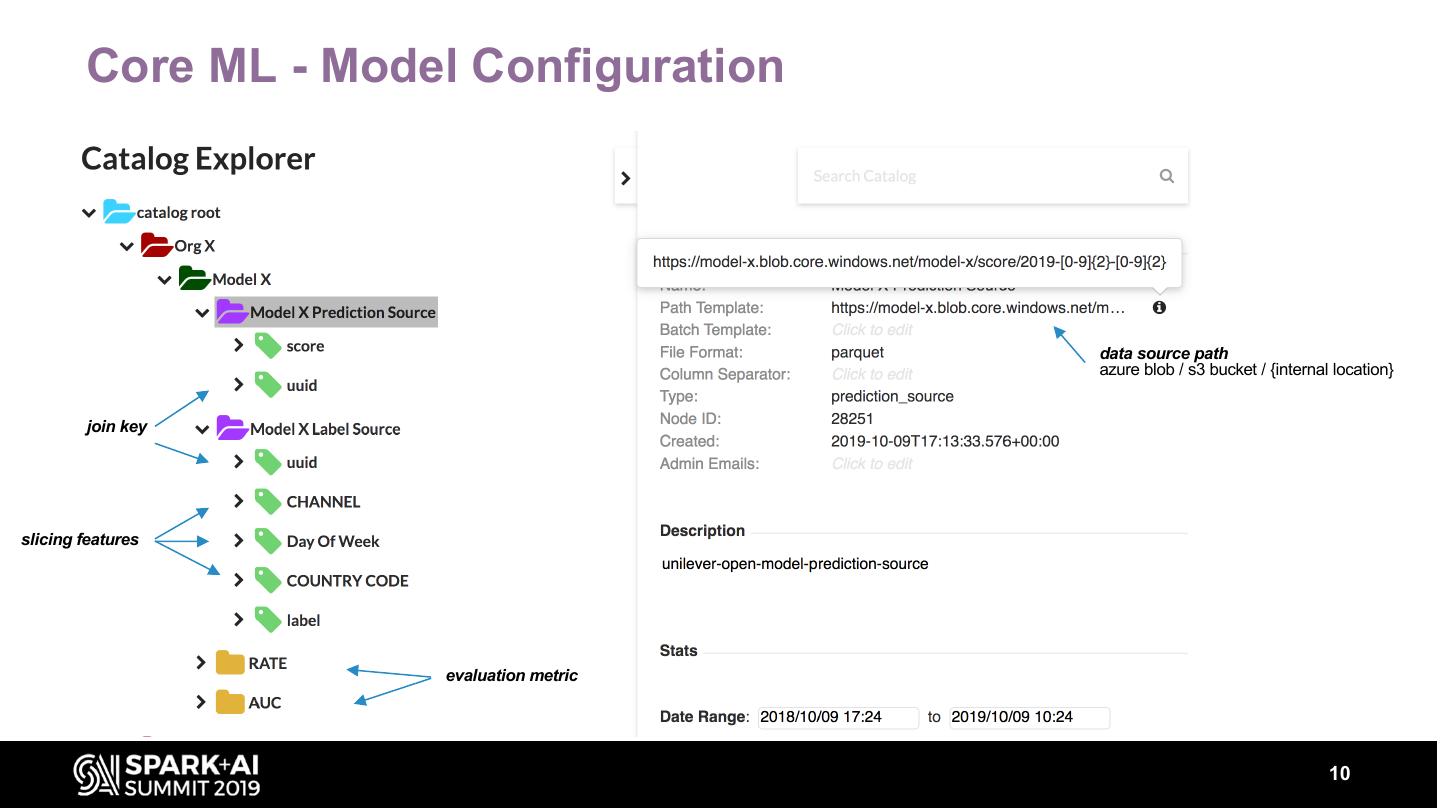
9 .Core ML - Model Configuration • Configure Model and linked data sources – Configure data source storing model output scores (Prediction Source) – Configure data source storing ground-truth (Label Source) – Configure evaluation metrics (e.g. AUC, RATE) • Define features to slice/visualize metrics evaluations. 9
10 . Core ML - Model Configuration data source path azure blob / s3 bucket / {internal location} join key slicing features evaluation metric 10
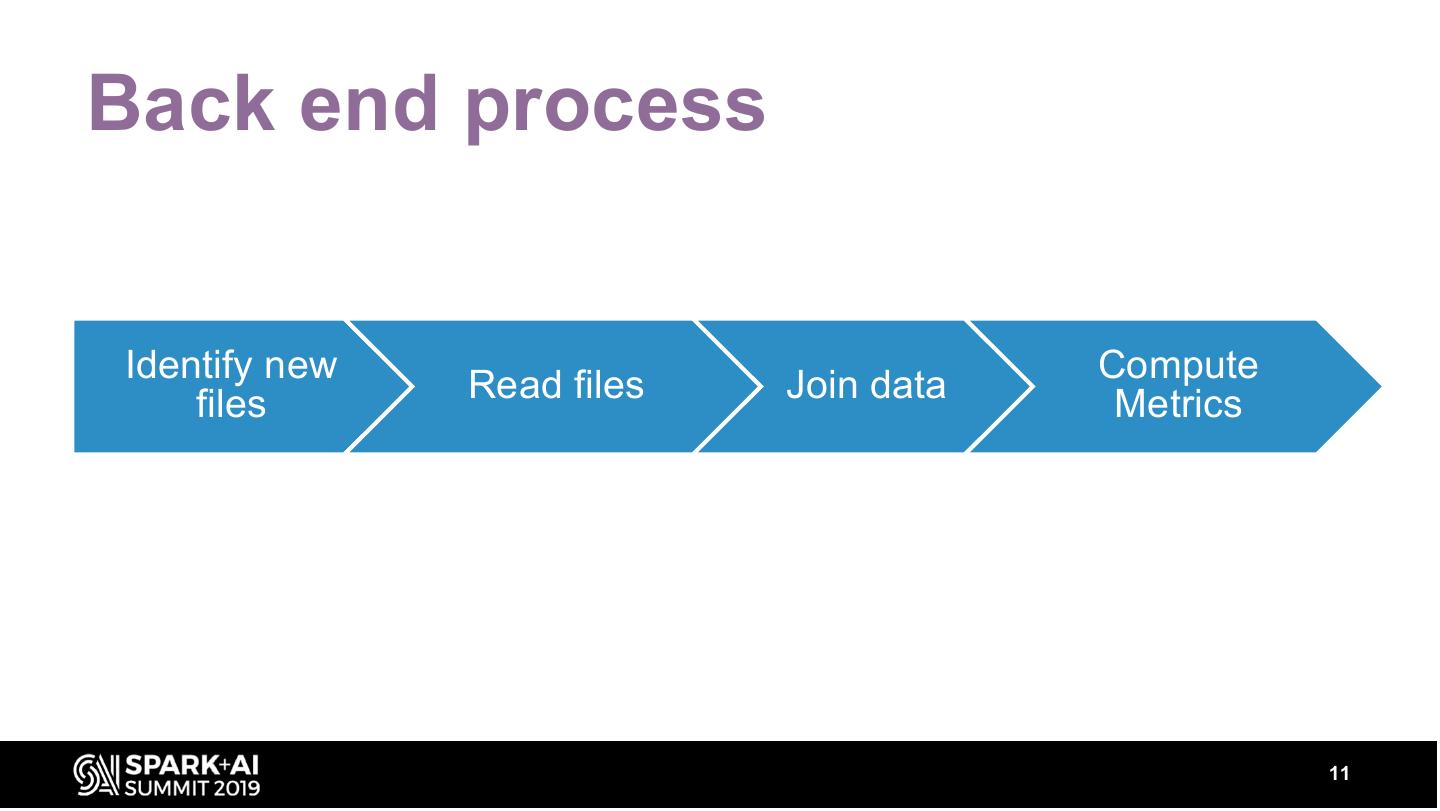
11 .Back end process Identify new Compute files Read files Join data Metrics 11
12 .Visualization Dashboard – AUC trends 12
13 .AUC trends Comparison – Multiple Models 13
14 .Visualization Dashboard – Average Score Trends 14
15 .Visualization Dashboard – Score Distribution by Deciles 15
16 .AUC Computation Optimization 16
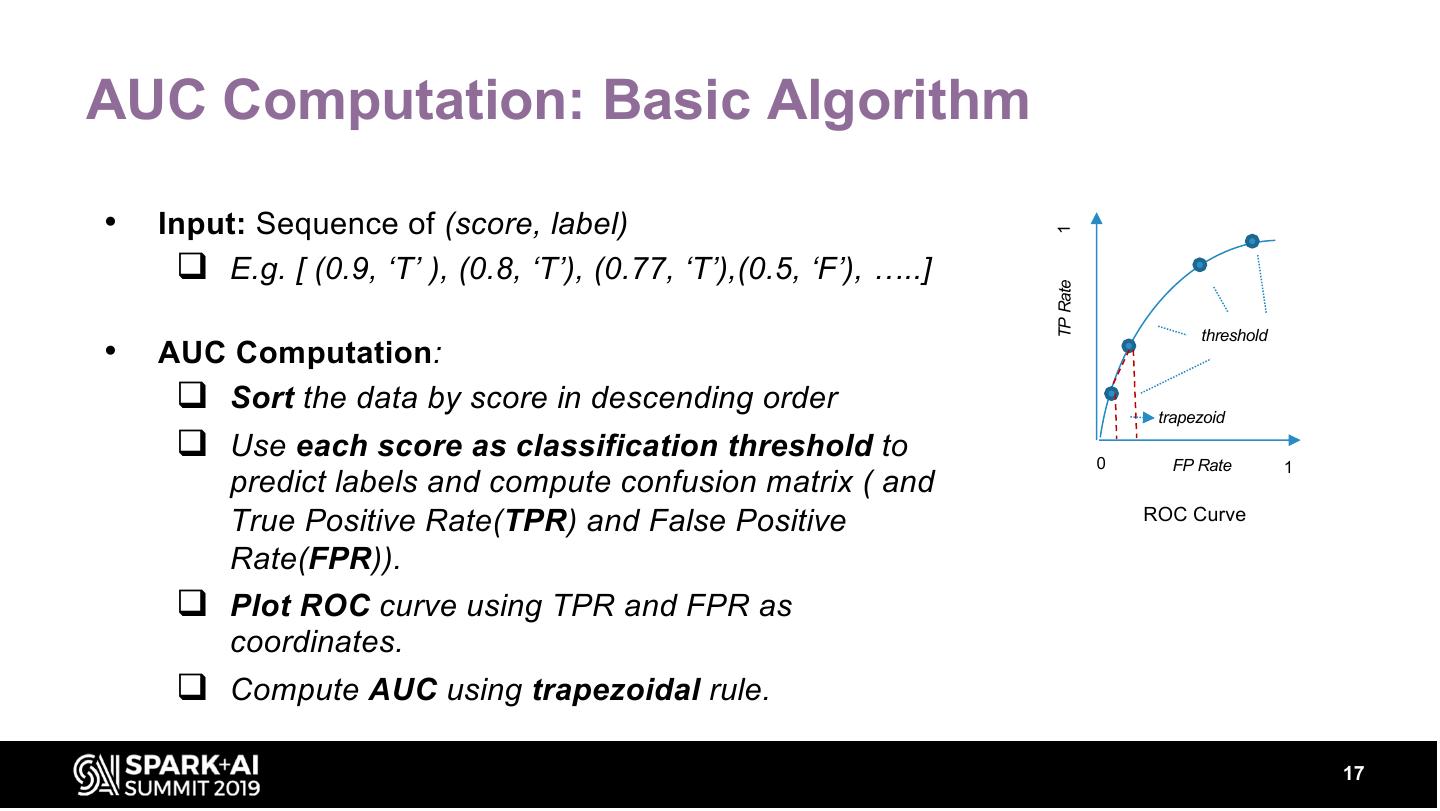
17 .AUC Computation: Basic Algorithm • Input: Sequence of (score, label) 1 q E.g. [ (0.9, ‘T’ ), (0.8, ‘T’), (0.77, ‘T’),(0.5, ‘F’), …..] TP Rate threshold • AUC Computation: q Sort the data by score in descending order trapezoid q Use each score as classification threshold to 0 FP Rate 1 predict labels and compute confusion matrix ( and True Positive Rate(TPR) and False Positive ROC Curve Rate(FPR)). q Plot ROC curve using TPR and FPR as coordinates. q Compute AUC using trapezoidal rule. 17
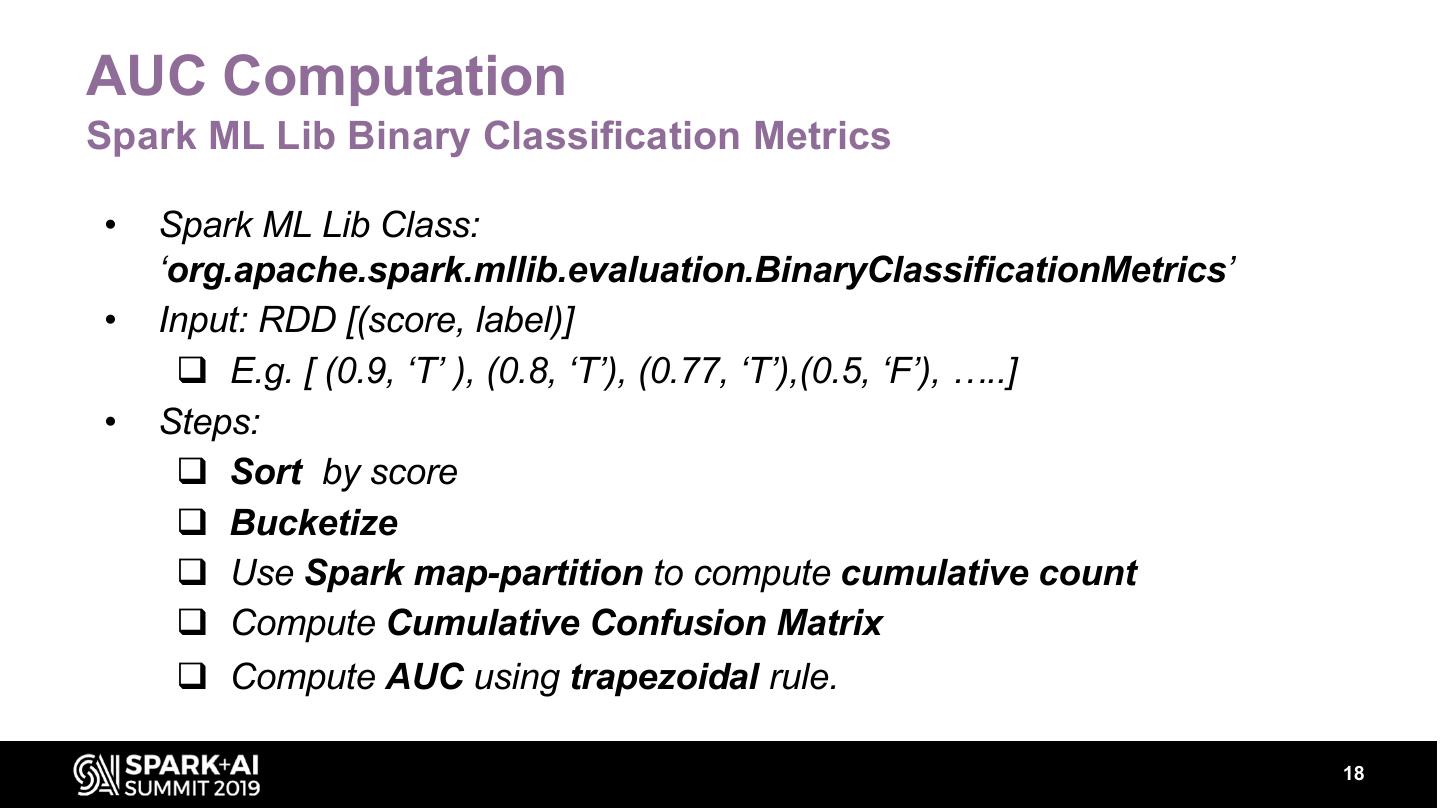
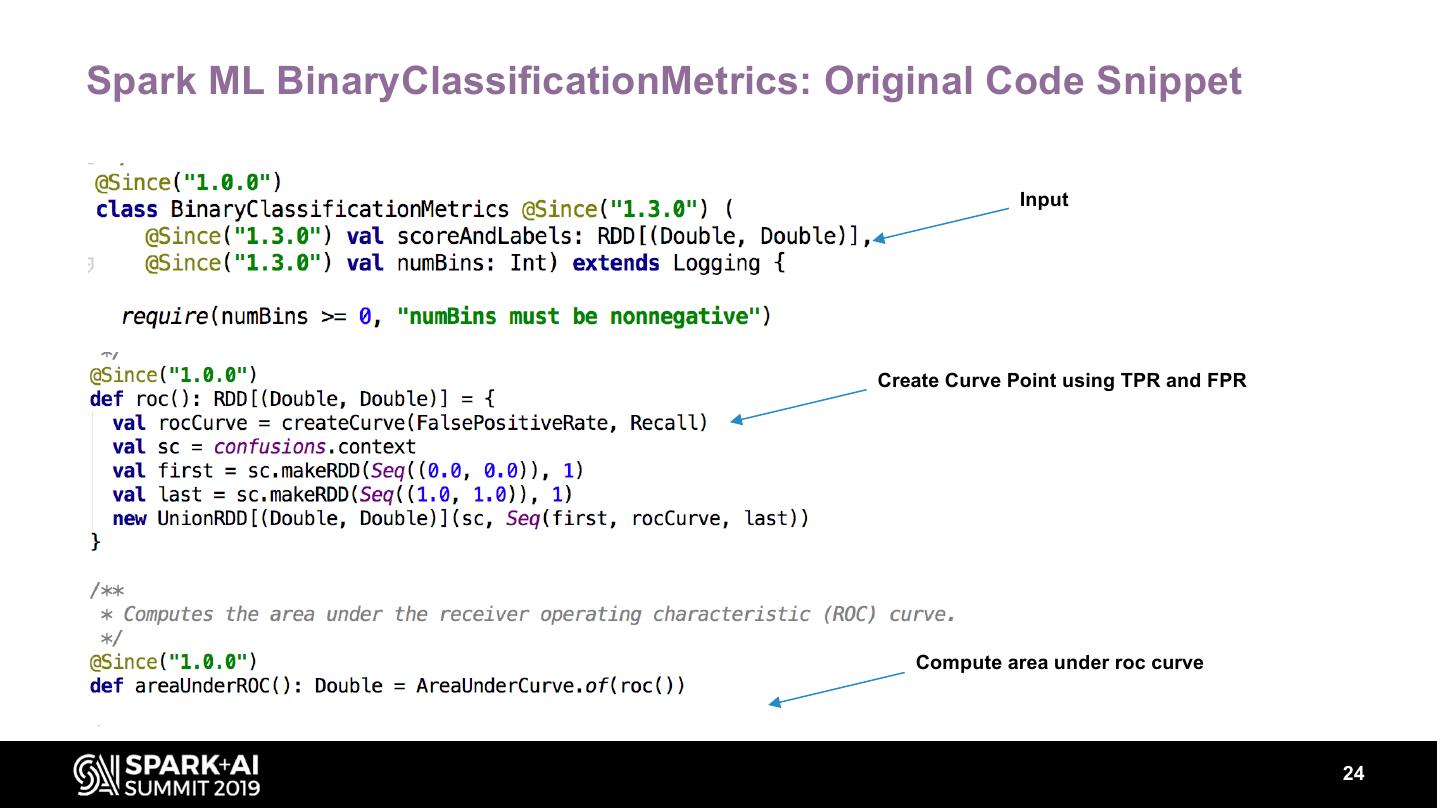
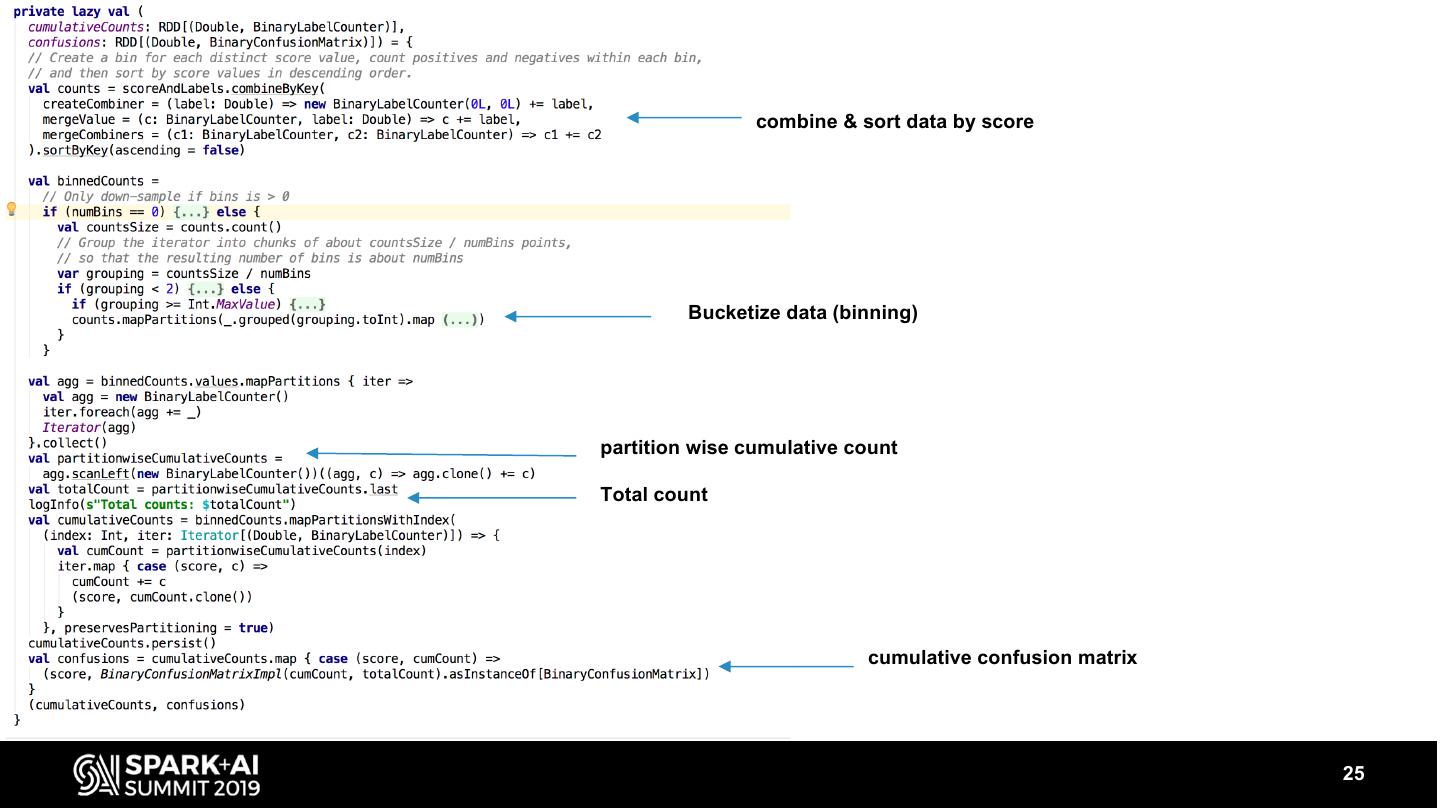
18 .AUC Computation Spark ML Lib Binary Classification Metrics • Spark ML Lib Class: ‘org.apache.spark.mllib.evaluation.BinaryClassificationMetrics’ • Input: RDD [(score, label)] q E.g. [ (0.9, ‘T’ ), (0.8, ‘T’), (0.77, ‘T’),(0.5, ‘F’), …..] • Steps: q Sort by score q Bucketize q Use Spark map-partition to compute cumulative count q Compute Cumulative Confusion Matrix q Compute AUC using trapezoidal rule. 18
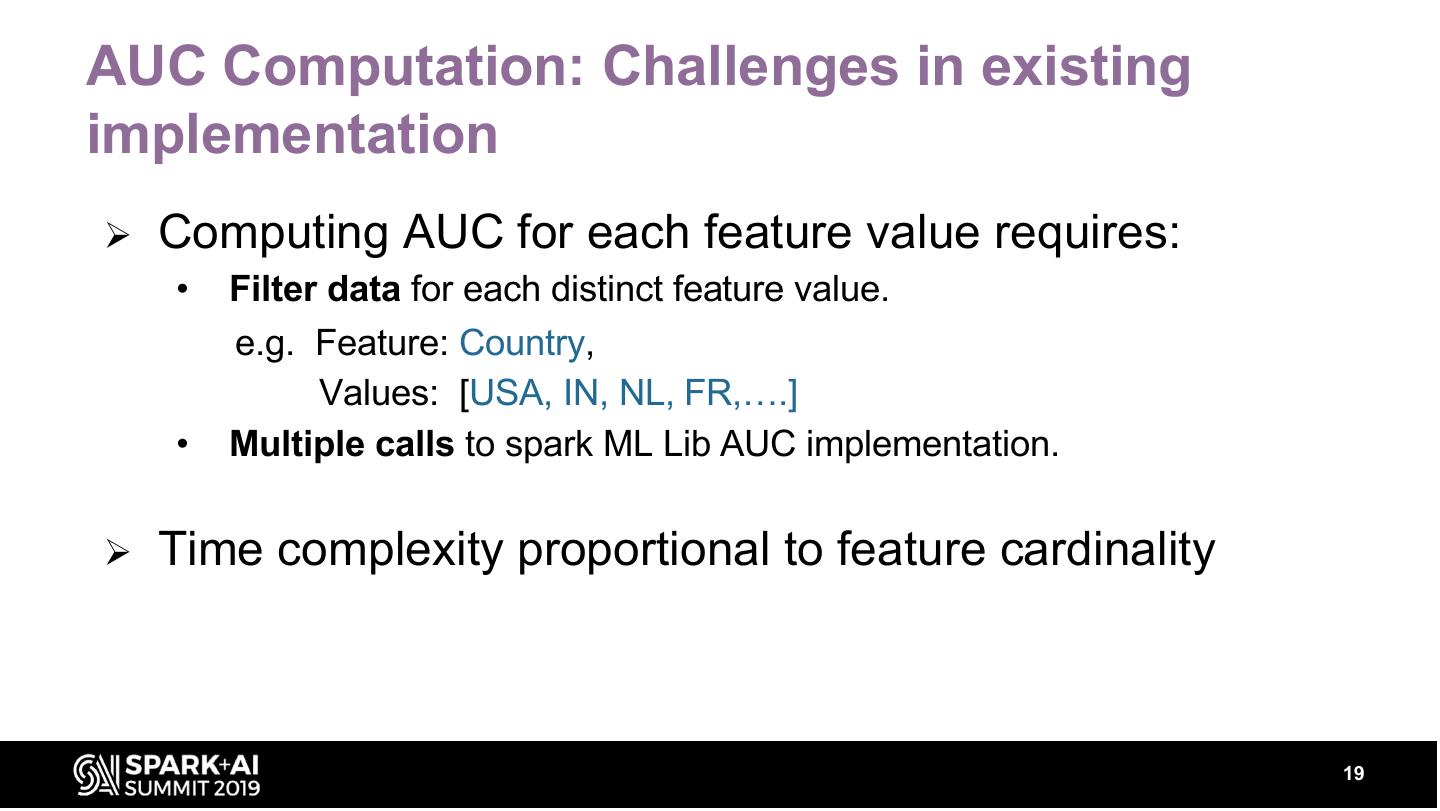
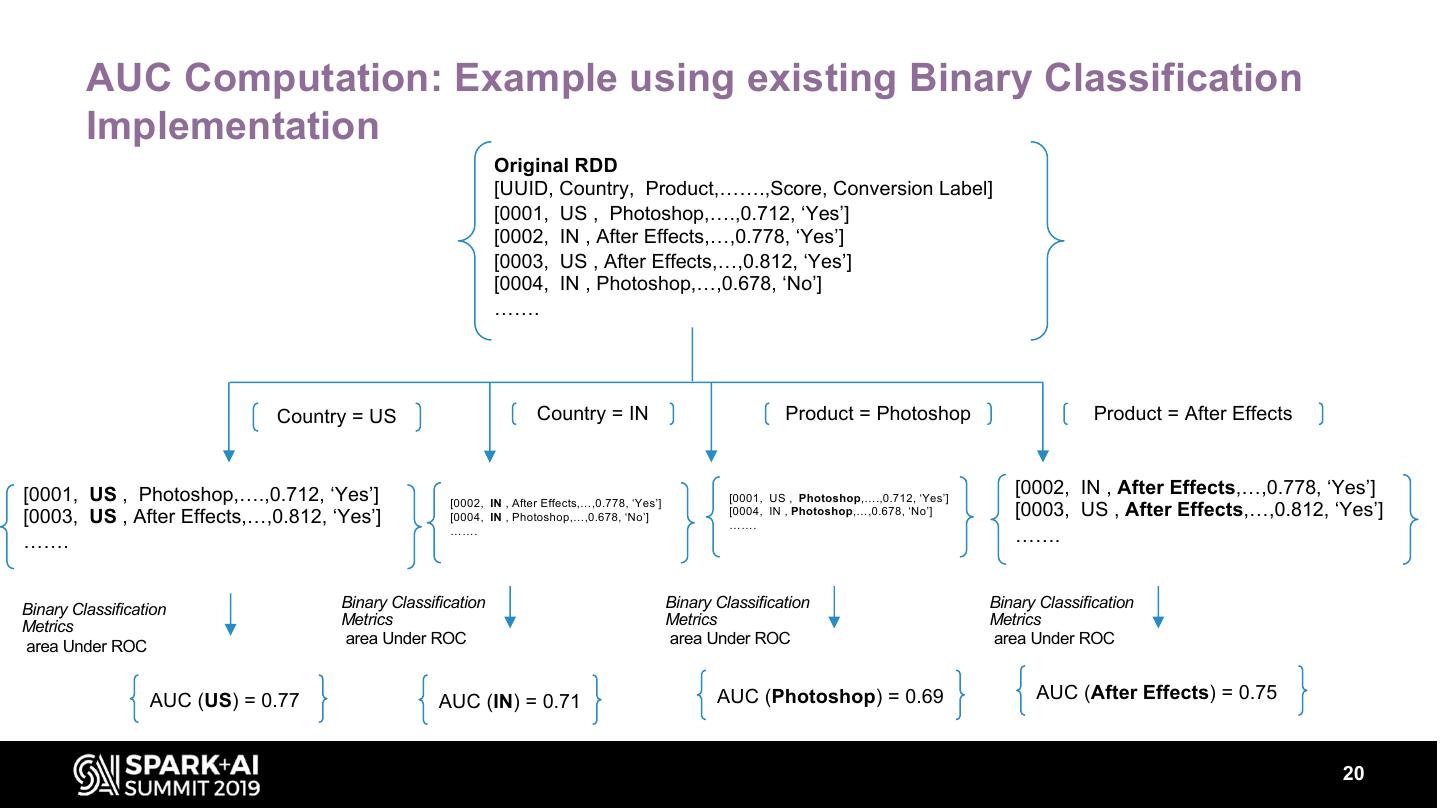
19 .AUC Computation: Challenges in existing implementation Ø Computing AUC for each feature value requires: • Filter data for each distinct feature value. e.g. Feature: Country, Values: [USA, IN, NL, FR,….] • Multiple calls to spark ML Lib AUC implementation. Ø Time complexity proportional to feature cardinality 19
20 . AUC Computation: Example using existing Binary Classification Implementation Original RDD [UUID, Country, Product,…….,Score, Conversion Label] [0001, US , Photoshop,….,0.712, ‘Yes’] [0002, IN , After Effects,…,0.778, ‘Yes’] [0003, US , After Effects,…,0.812, ‘Yes’] [0004, IN , Photoshop,…,0.678, ‘No’] ……. Country = US Country = IN Product = Photoshop Product = After Effects [0001, US , Photoshop,….,0.712, ‘Yes’] [0001, US , Photoshop,….,0.712, ‘Yes’] [0002, IN , After Effects,…,0.778, ‘Yes’] [0002, IN , After Effects,…,0.778, ‘Yes’] [0003, US , After Effects,…,0.812, ‘Yes’] [0004, IN , Photoshop,…,0.678, ‘No’] [0004, IN , Photoshop,…,0.678, ‘No’] [0003, US , After Effects,…,0.812, ‘Yes’] ……. ……. ……. ……. Binary Classification Binary Classification Binary Classification Binary Classification Metrics Metrics Metrics Metrics area Under ROC area Under ROC area Under ROC area Under ROC AUC (US) = 0.77 AUC (IN) = 0.71 AUC (Photoshop) = 0.69 AUC (After Effects) = 0.75 20
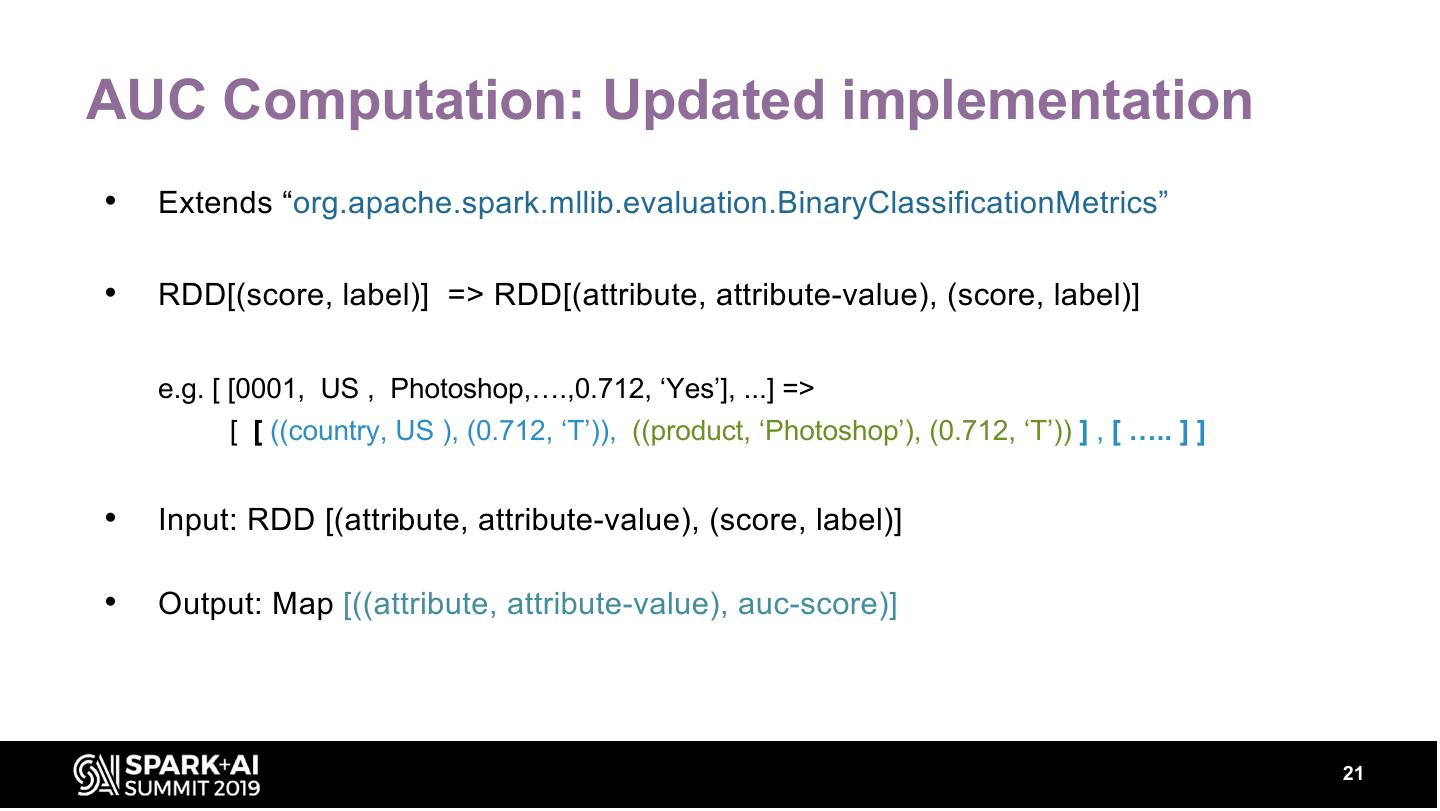
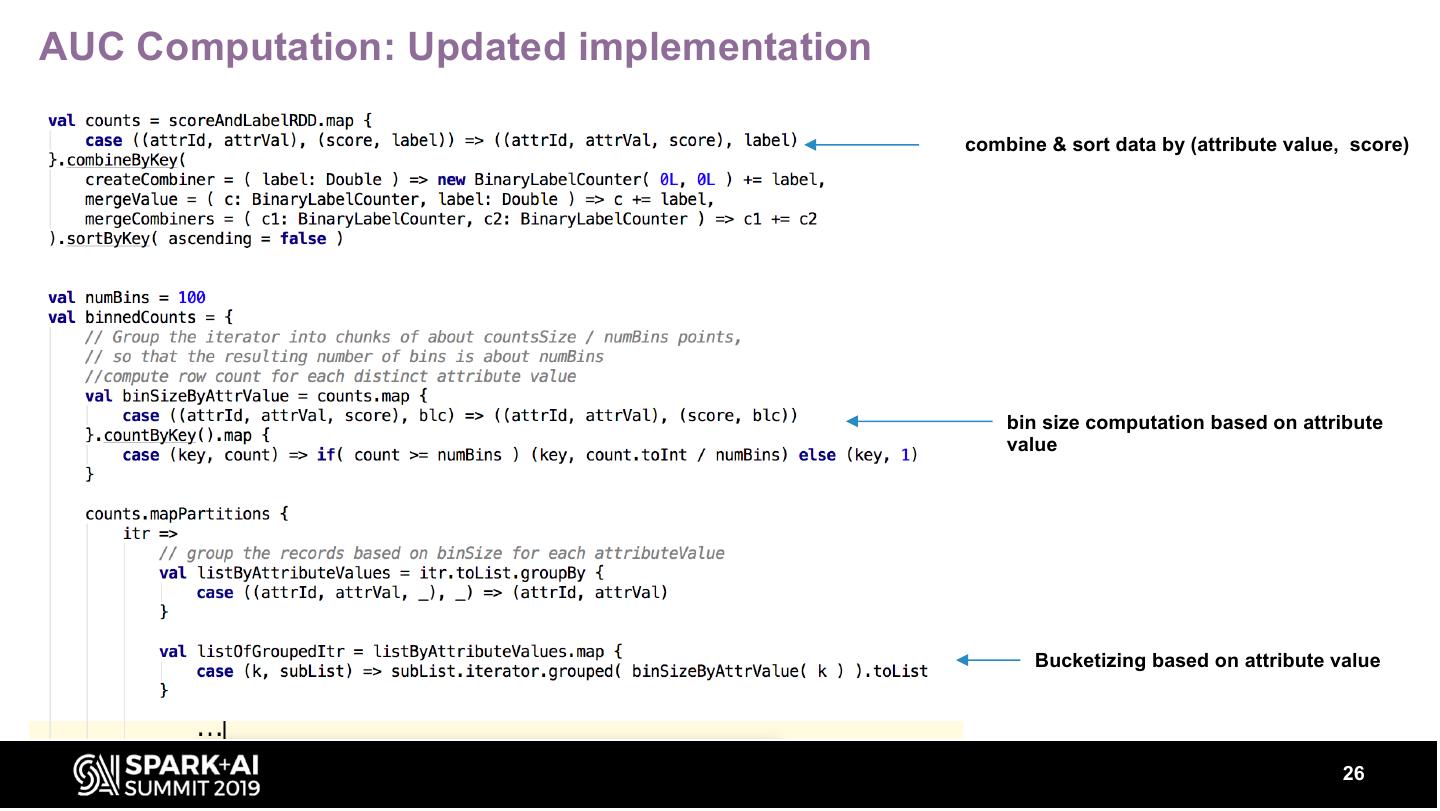
21 .AUC Computation: Updated implementation • Extends “org.apache.spark.mllib.evaluation.BinaryClassificationMetrics” • RDD[(score, label)] => RDD[(attribute, attribute-value), (score, label)] e.g. [ [0001, US , Photoshop,….,0.712, ‘Yes’], ...] => [ [ ((country, US ), (0.712, ‘T’)), ((product, ‘Photoshop’), (0.712, ‘T’)) ] , [ ….. ] ] • Input: RDD [(attribute, attribute-value), (score, label)] • Output: Map [((attribute, attribute-value), auc-score)] 21
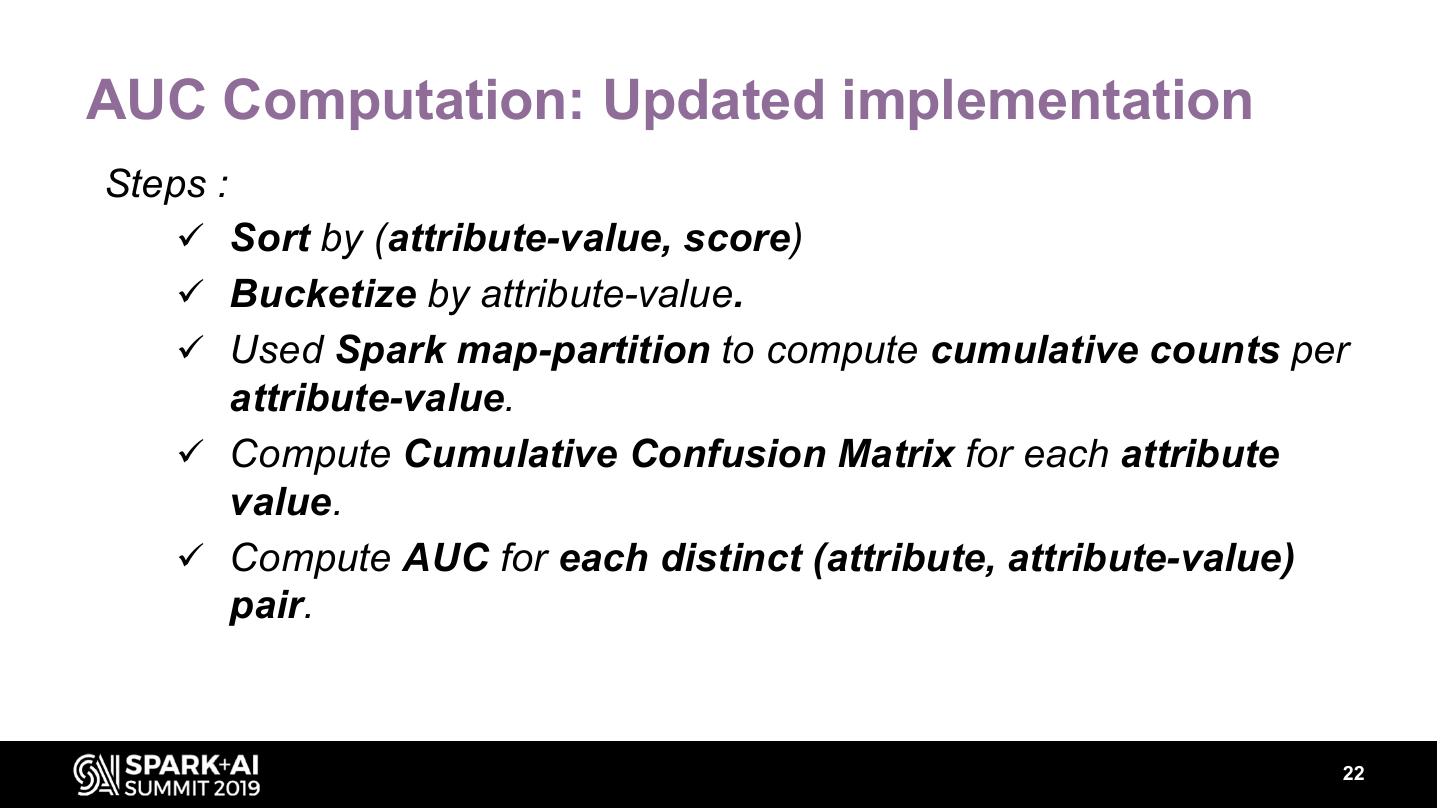
22 .AUC Computation: Updated implementation Steps : ü Sort by (attribute-value, score) ü Bucketize by attribute-value. ü Used Spark map-partition to compute cumulative counts per attribute-value. ü Compute Cumulative Confusion Matrix for each attribute value. ü Compute AUC for each distinct (attribute, attribute-value) pair. 22
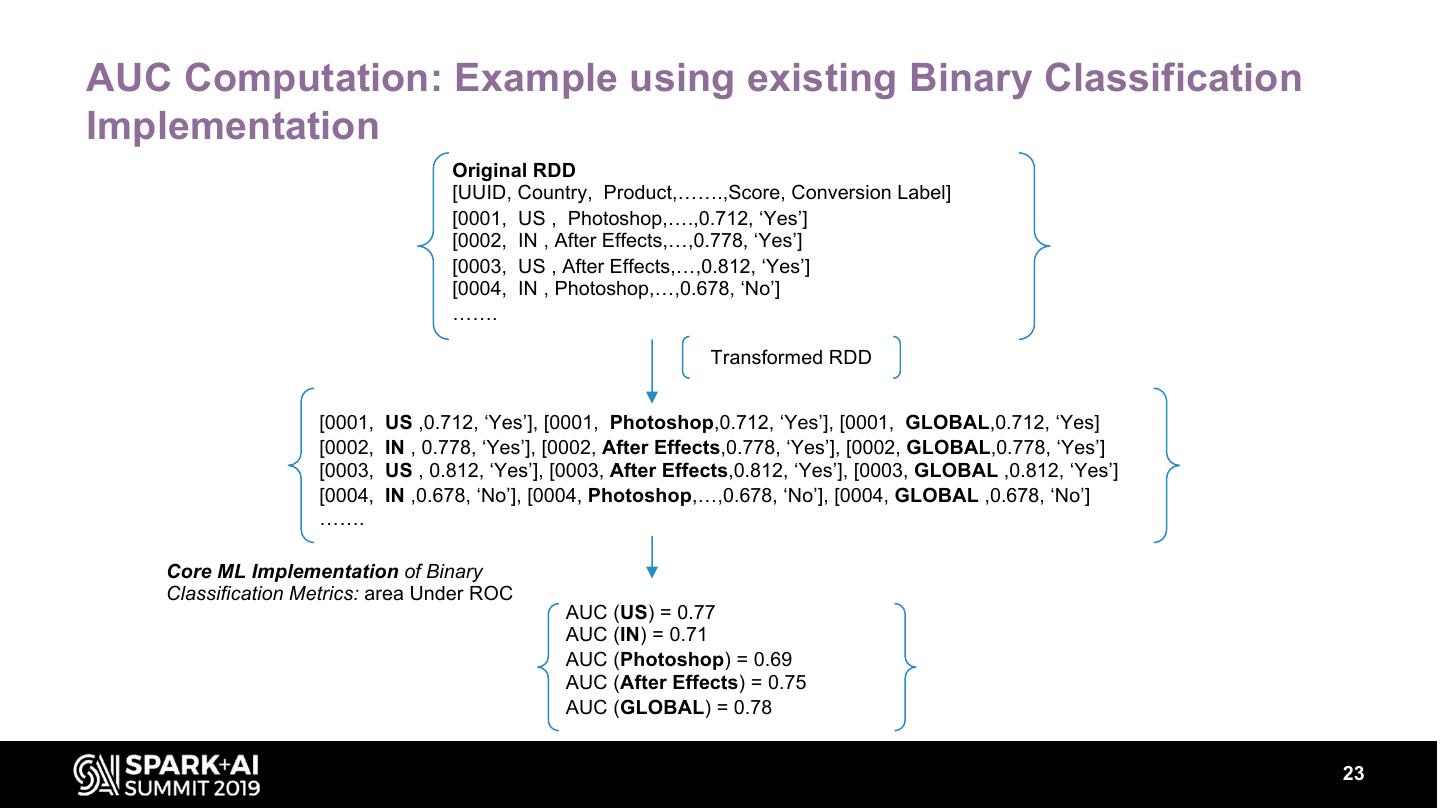
23 .AUC Computation: Example using existing Binary Classification Implementation Original RDD [UUID, Country, Product,…….,Score, Conversion Label] [0001, US , Photoshop,….,0.712, ‘Yes’] [0002, IN , After Effects,…,0.778, ‘Yes’] [0003, US , After Effects,…,0.812, ‘Yes’] [0004, IN , Photoshop,…,0.678, ‘No’] ……. Transformed RDD [0001, US ,0.712, ‘Yes’], [0001, Photoshop,0.712, ‘Yes’], [0001, GLOBAL,0.712, ‘Yes] [0002, IN , 0.778, ‘Yes’], [0002, After Effects,0.778, ‘Yes’], [0002, GLOBAL,0.778, ‘Yes’] [0003, US , 0.812, ‘Yes’], [0003, After Effects,0.812, ‘Yes’], [0003, GLOBAL ,0.812, ‘Yes’] [0004, IN ,0.678, ‘No’], [0004, Photoshop,…,0.678, ‘No’], [0004, GLOBAL ,0.678, ‘No’] ……. Core ML Implementation of Binary Classification Metrics: area Under ROC AUC (US) = 0.77 AUC (IN) = 0.71 AUC (Photoshop) = 0.69 AUC (After Effects) = 0.75 AUC (GLOBAL) = 0.78 23
24 .Spark ML BinaryClassificationMetrics: Original Code Snippet Input Create Curve Point using TPR and FPR Compute area under roc curve 24
25 . combine & sort data by score Bucketize data (binning) partition wise cumulative count Total count cumulative confusion matrix 25
26 .AUC Computation: Updated implementation combine & sort data by (attribute value, score) bin size computation based on attribute value Bucketizing based on attribute value 26
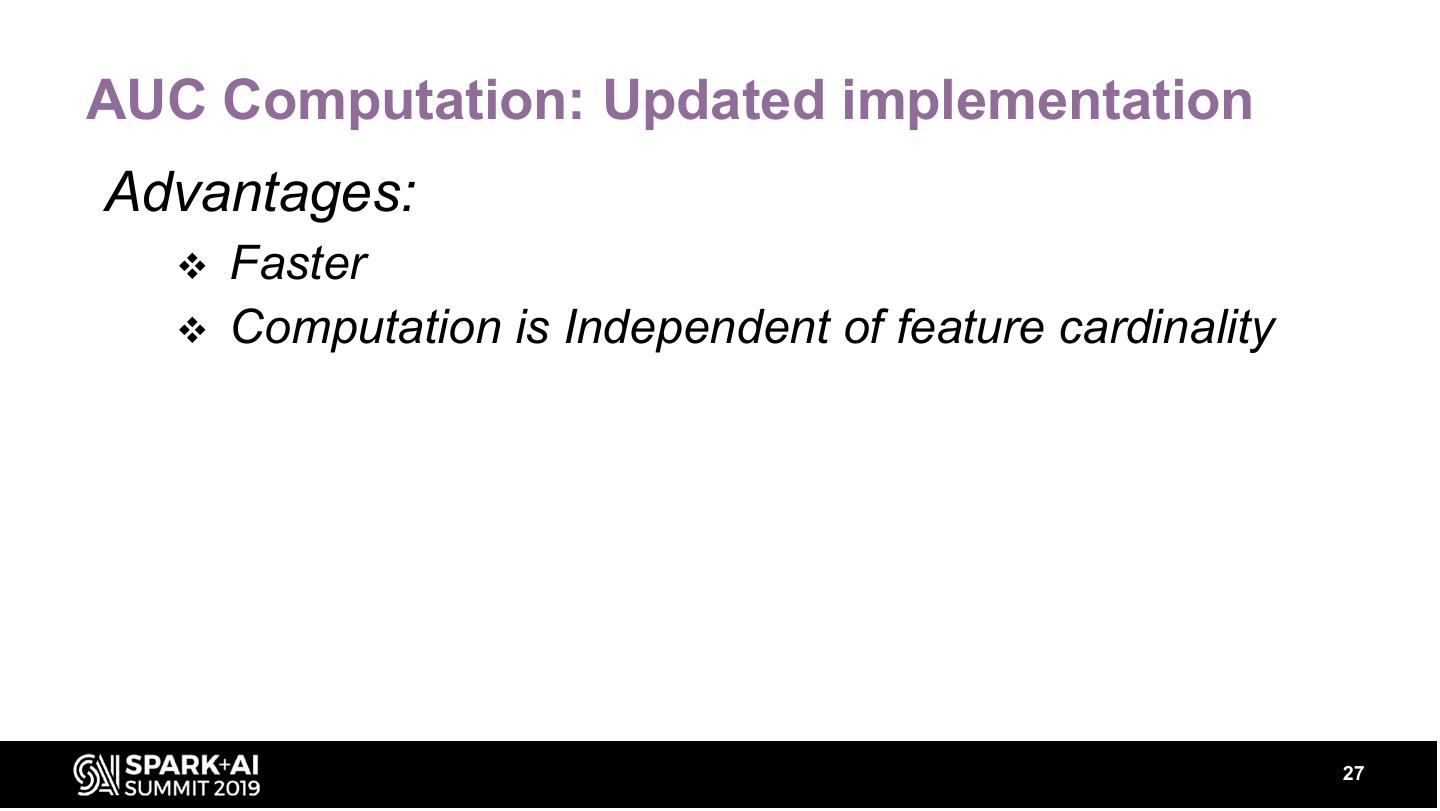
27 .AUC Computation: Updated implementation Advantages: v Faster v Computation is Independent of feature cardinality 27
28 .Future: • Adding support for other evaluation metrics(e.g. Root Mean Squared Error, LIFT etc.) • Contribute back to apache spark community by extending “BinaryClassificationMetrics” to support AUC computation sliced by feature value. 28
29 . THANKS! Contact: Vijay Srivastava <vijays@adobe.com> Credits: Staff Data Scientist Adobe Inc. Joshua Sweetkind-Singer Principal ML Architect Deepak Pai <dpai@adobe.com> Shankar Venkitachalam Manager, ML Core Services Data Scientist Adobe Inc.


