- 快召唤伙伴们来围观吧
- 微博 QQ QQ空间 贴吧
- 视频嵌入链接 文档嵌入链接
- 复制
- 微信扫一扫分享
- 已成功复制到剪贴板
Drug Discovery and Development Using AI
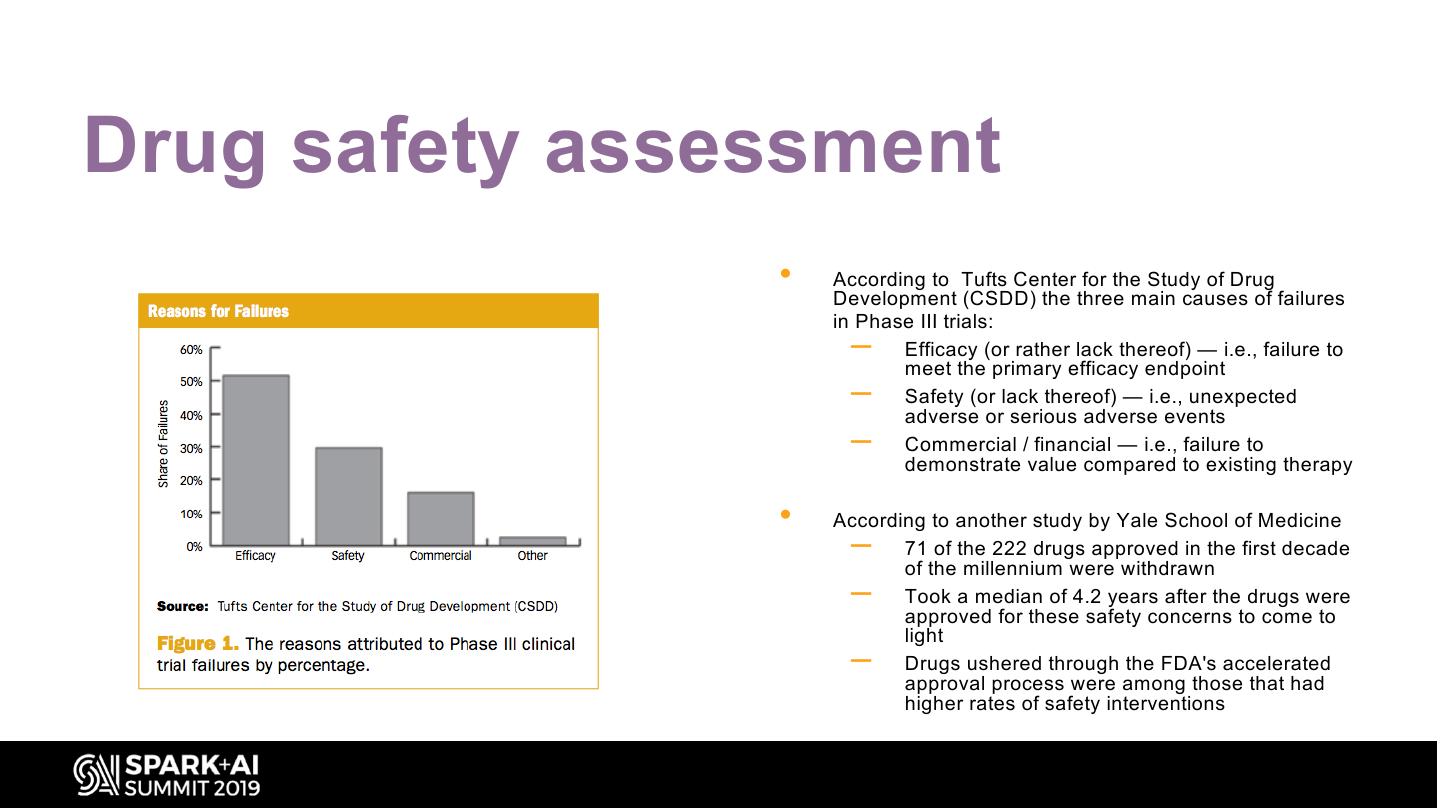
Drug discovery and development is a long and expensive process and over time has notoriously bucked Moore’s law that it now has its own law called Eroom’s Law named after it (the opposite of Moore’s). It is estimated that the attrition rate of drug candidates is up to 96% and the average cost to develop a new drug has reached almost $2.5 billion in recent years. One of the major causes for the high attrition rate is drug safety, which accounts for 30% of the failures.
Even if a drug is approved in market, it could be withdrawn due to safety problems. Therefore, evaluating drug safety extensively as early as possible is paramount in accelerating drug discovery and development. This talk provides a high-level overview of the current process of rational drug design that has been in place for many decades and covers some of the major areas where the application of AI, Deep learning and ML based techniques have had the most gains.
Specifically, this talk covers a variety of drug safety related AI and ML based techniques currently in use which can generally divided into 3 main categories:
- Discovery,
- Toxicity and Safety, and
- Post-Market Monitoring.
We will address the recent progress in predictive models and techniques built for various toxicities. It will also cover some publicly available databases, tools and platforms available to easily leverage them.
We will also compare and contrast various modeling techniques including deep learning techniques and their accuracy using recent research. Finally, the talk will address some of the remaining challenges and limitations yet to be addressed in the area of drug discovery and safety assessment.
展开查看详情
1 .WIFI SSID:Spark+AISummit | Password: UnifiedDataAnalytics
2 .Drug Discovery and Development using AI Vishnu Vettrivel, Wisecube AI #UnifiedDataAnalytics #SparkAISummit
3 .About me • Vishnu Vettrivel - vishnu@wisecube.ai • Data Science/AI platform Architect • NOT a Molecular Biologist or a Medicinal Chemist ! • Will be talking about things learnt mostly on the job • Have been working with a Molecular biologist in a Biotech research firm to help accelerate drug discovery using Machine learning
4 . • History ¡ Computer-aided Drug Design – Nature as Source – Recent efforts ¡ Molecular Representation • Rational drug ¡ Drug safety assessment discovery Agenda – Drug targeting ¡ Demo – Screening ¡ Tools and DBs – Drug Discovery ¡ Resources Cycle ¡ Summary • Economics
5 .History of drug discovery
6 . Ancient methods: Nature as a source • Search for Drugs not new: – Traditional Chinese medicine and Ayurveda both several thousand years old • Many compounds now being studied – Aspirin’s chemical forefather known to Hippocrates – Even inoculation at least 2000 years old – But also resulted in many ineffective drugs source: https://amhistory.si.edu/polio/virusvaccine/history.htm
7 .More recent efforts • In 1796, Jenner finds first vaccine: cowpox prevents smallpox • 1 century later, Pasteur makes vaccines against anthrax and rabies • Sulfonamides developed for antibacterial purposes in 1930s • Penicillin: the “miracle drug” • 2nd half of 20th century: use of modern chemical techniques to create explosion of medicines
8 . PROCESS OF FINDING NEW MOST COMMONLY AN ORGANIC INVOLVES THE DESIGN OF MEDICATIONS BASED ON THE SMALL MOLECULE THAT MOLECULES THAT ARE KNOWLEDGE OF A BIOLOGICAL ACTIVATES OR INHIBITS THE COMPLEMENTARY IN SHAPE AND TARGET. FUNCTION OF A PROTEIN CHARGE TO THE BIOMOLECULAR TARGET Rational drug discovery
9 . Drug target identification • Different approaches to look for drug targets – Phenotypic screening – gene association studies – chemo proteomics – Transgenetic organisms – Imaging – Biomarkers Source: https://www.roche.com/research_and_development/drawn_to_science/target_identification.htm
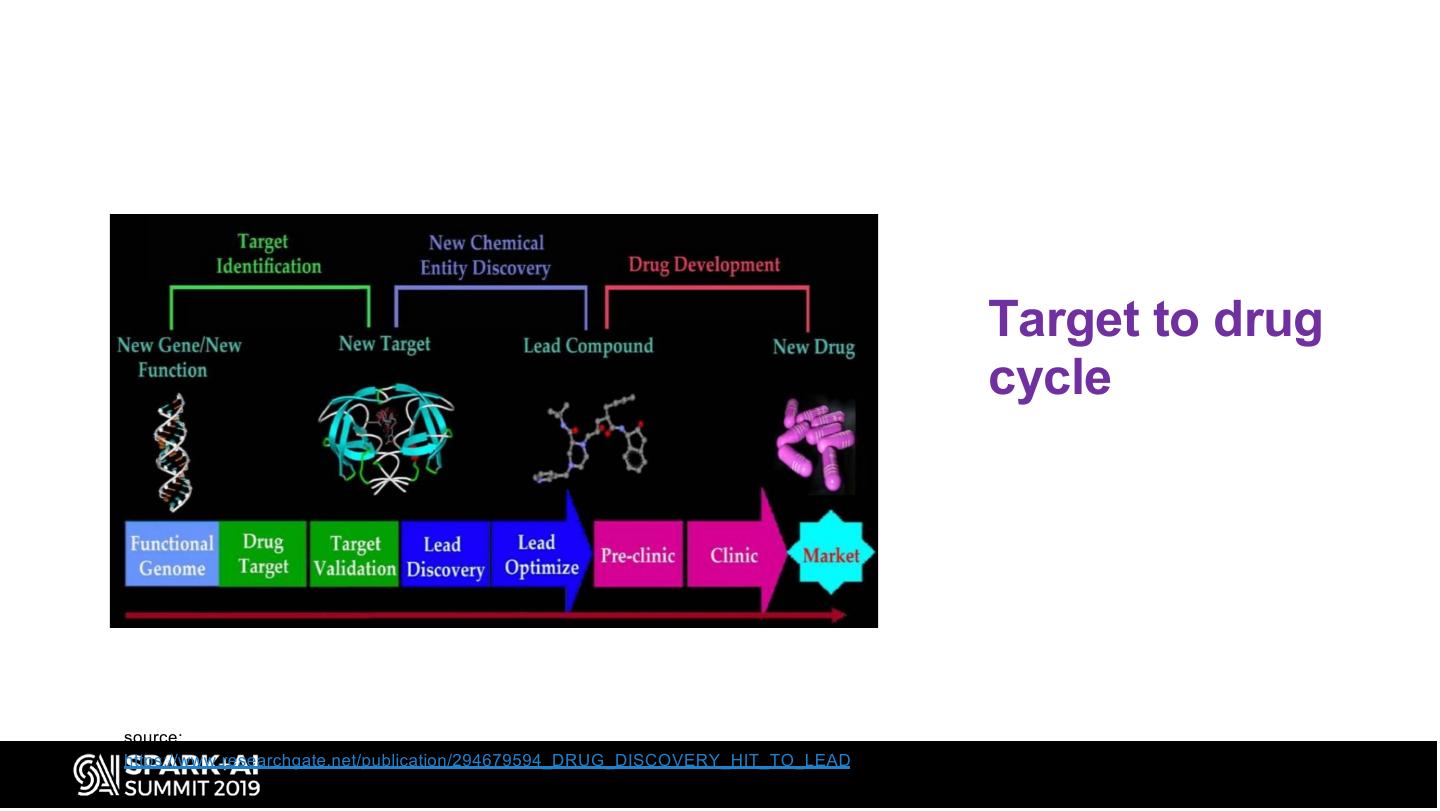
10 . Target to drug cycle source: https://www.researchgate.net/publication/294679594_DRUG_DISCOVERY_HIT_TO_LEAD
11 .Screening • High Throughput Screening – Implemented in 1990s, still going strong – Allows scientists to test 1000’s of potential targets – Library size is around 1 million compounds – Single screen program cost ~$75,000 – Estimated that only 4 small molecules with roots in combinatorial chemistry made it to clinical development by 2001 – Can make library even bigger if you spend more, but can’t get comprehensive coverage • Similarity paradox – Slight change can mean difference between active and inactive
12 . Hit to lead optimization source: http://www.sbw.fi/lead-optimization/
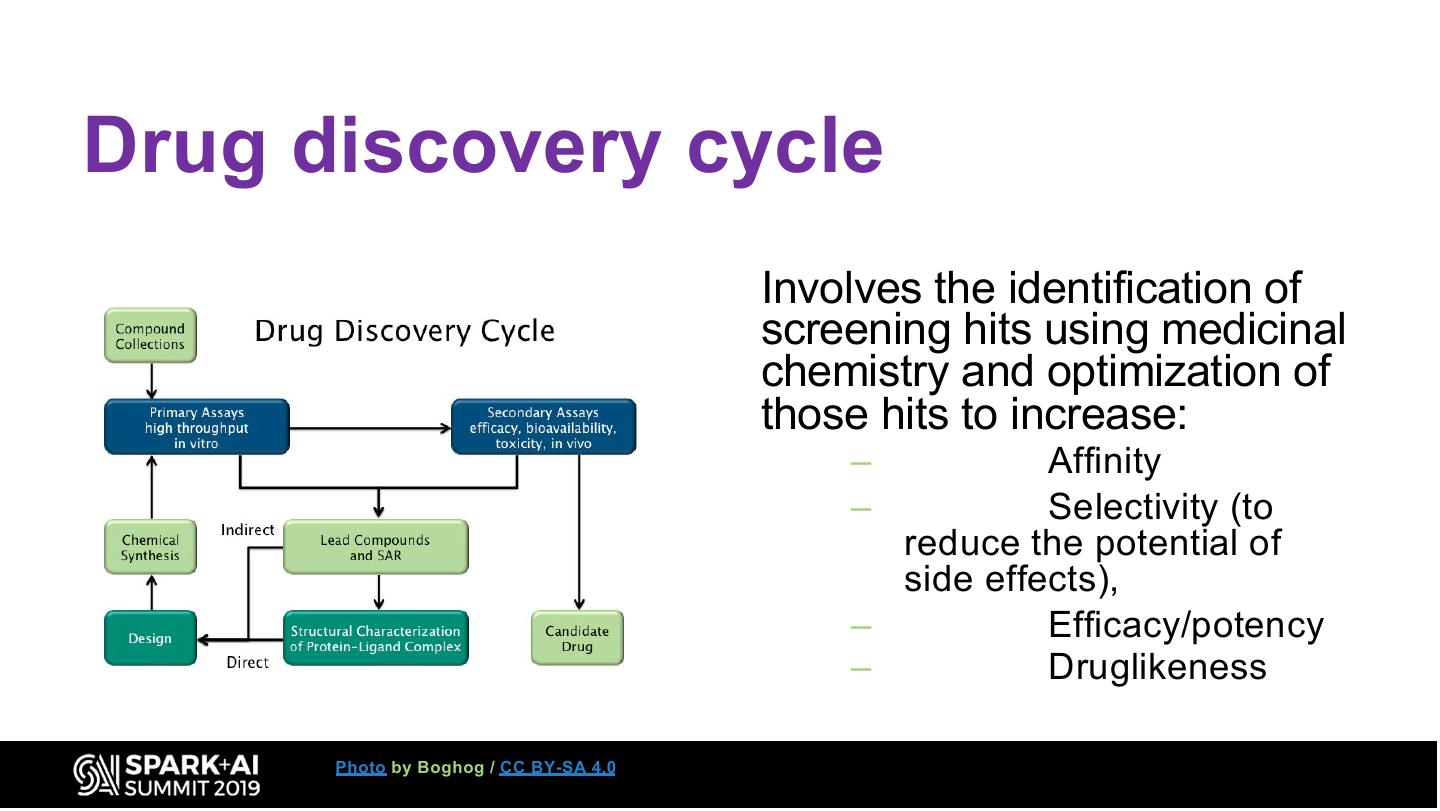
13 .Drug discovery cycle Involves the identification of screening hits using medicinal chemistry and optimization of those hits to increase: – Affinity – Selectivity (to reduce the potential of side effects), – Efficacy/potency – Druglikeness Photo by Boghog / CC BY-SA 4.0
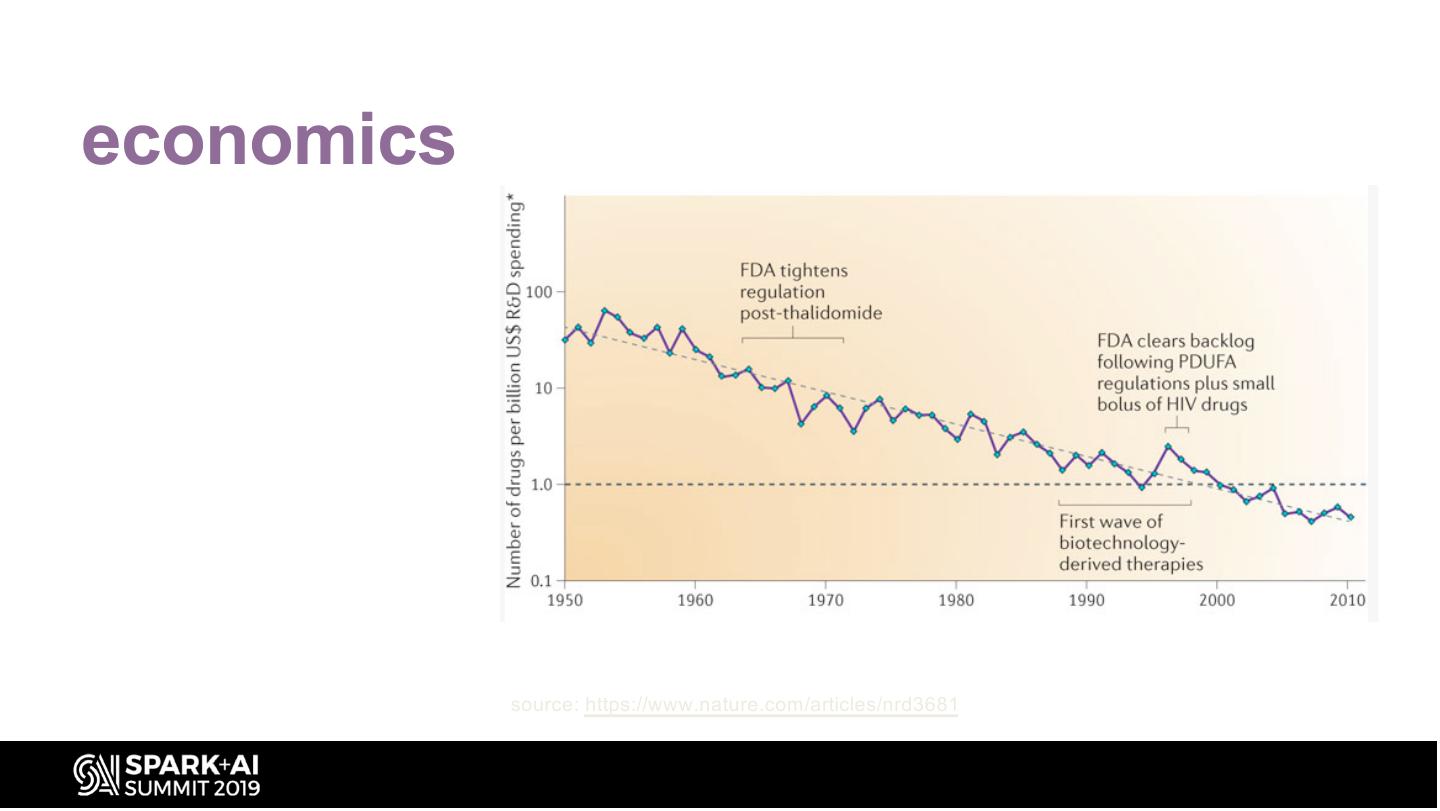
14 .economics Eroom’s Law: Opposite of Moore’s Law – Signals worrying trends in number and cost of Drugs to Market for the Pharma industry source: https://www.nature.com/articles/nrd3681
15 .Drug discovery timeline source: https://www.innoplexus.com/blog/five-reasons-to-embrace-data-driven-drug-development/
16 . Computer- Aided drug design source: http://poster123.info/?u=Pharmacological+Strategies+To+Contend+Against+Myocardial
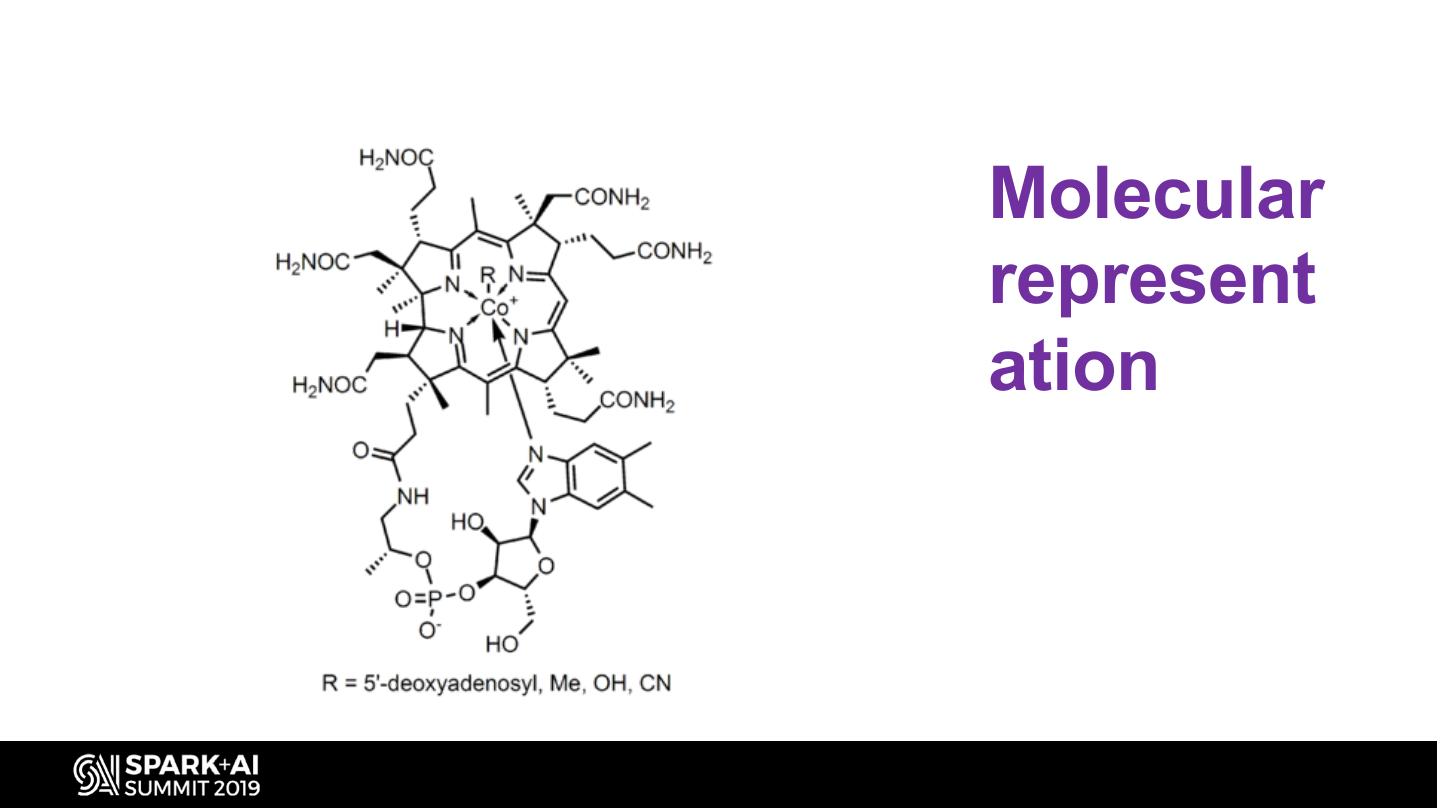
17 .Molecular represent ation
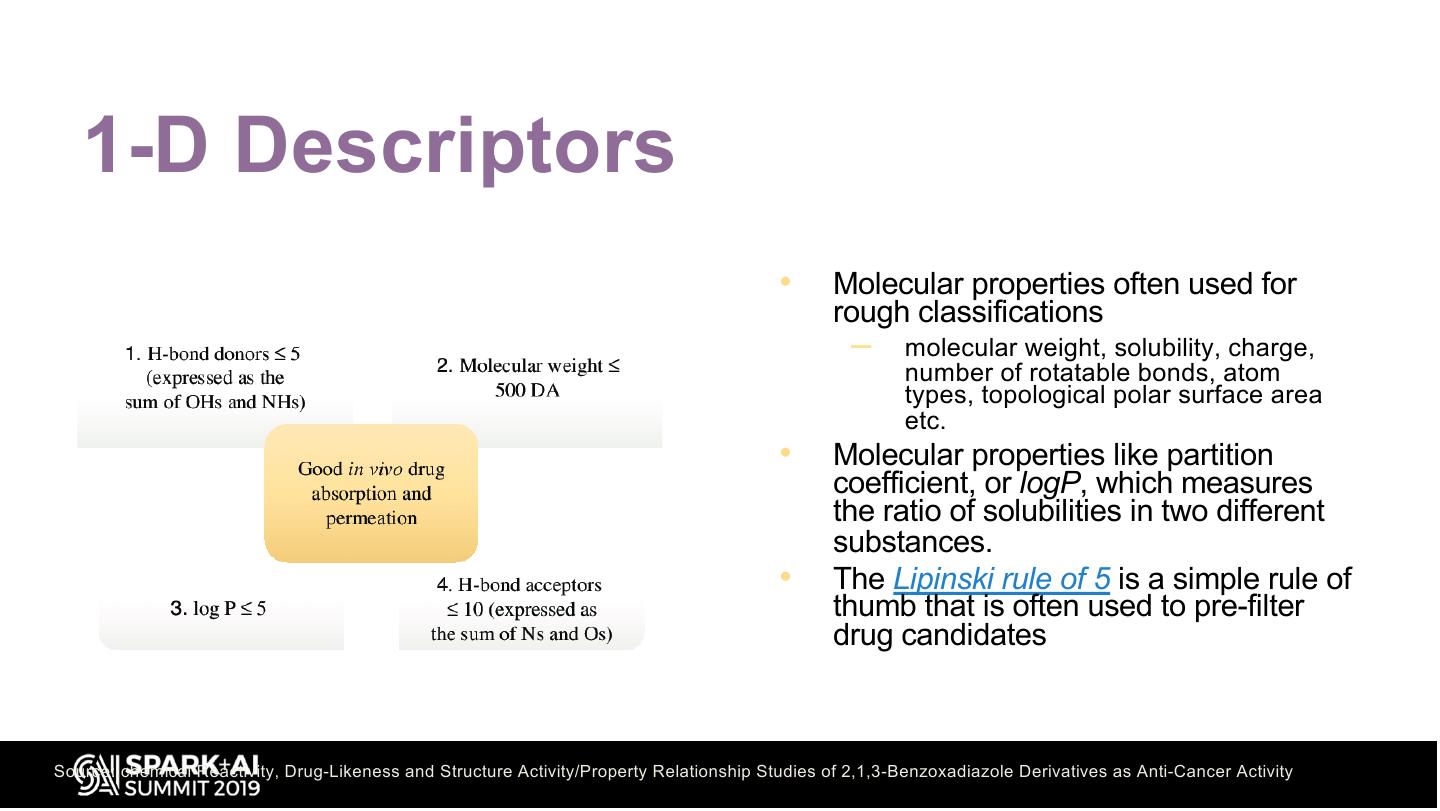
18 . 1-D Descriptors • Molecular properties often used for rough classifications – molecular weight, solubility, charge, number of rotatable bonds, atom types, topological polar surface area etc. • Molecular properties like partition coefficient, or logP, which measures the ratio of solubilities in two different substances. • The Lipinski rule of 5 is a simple rule of thumb that is often used to pre-filter drug candidates Source: chemical Reactivity, Drug-Likeness and Structure Activity/Property Relationship Studies of 2,1,3-Benzoxadiazole Derivatives as Anti-Cancer Activity
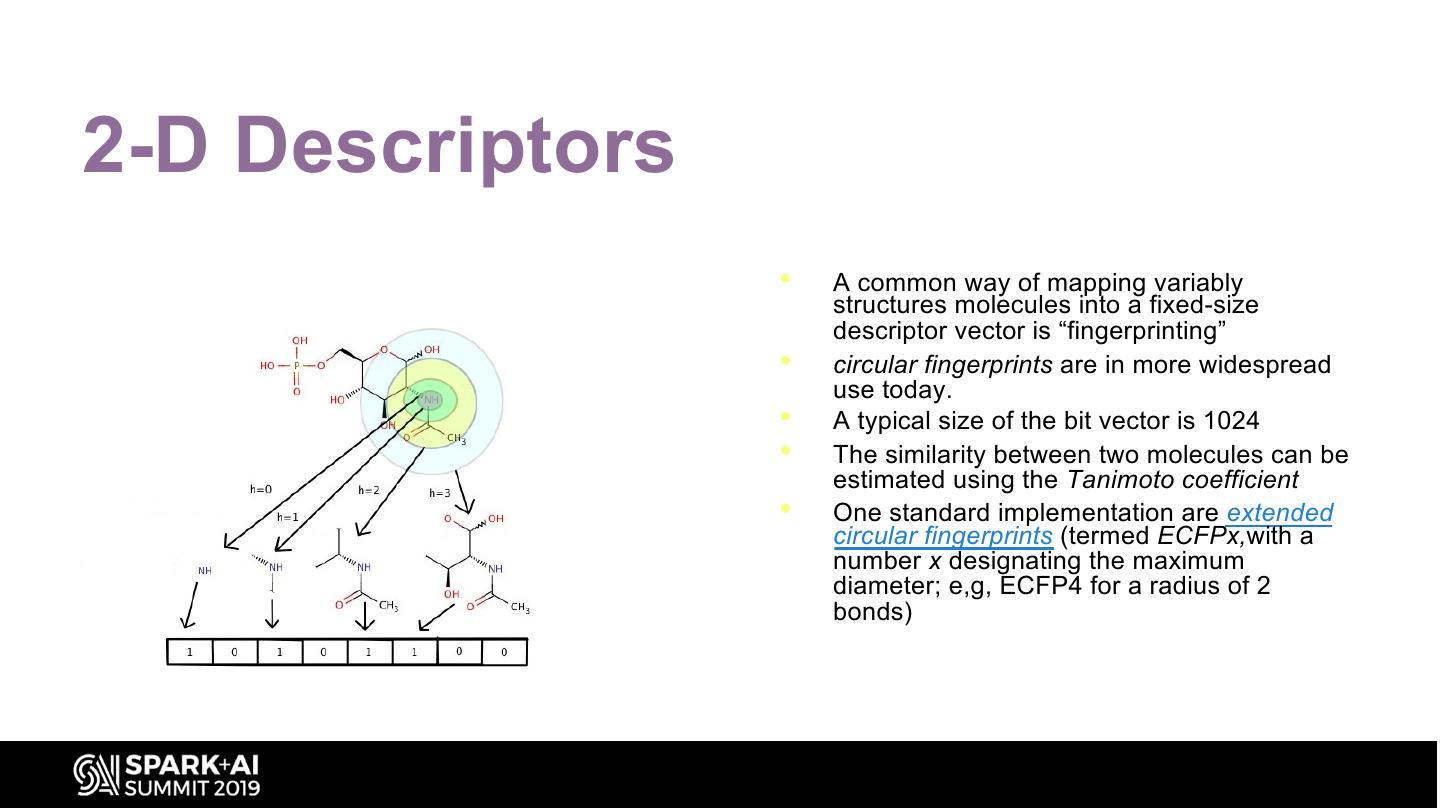
19 .2-D Descriptors • A common way of mapping variably structures molecules into a fixed-size descriptor vector is “fingerprinting” • circular fingerprints are in more widespread use today. • A typical size of the bit vector is 1024 • The similarity between two molecules can be estimated using the Tanimoto coefficient • One standard implementation are extended circular fingerprints (termed ECFPx,with a number x designating the maximum diameter; e,g, ECFP4 for a radius of 2 bonds)
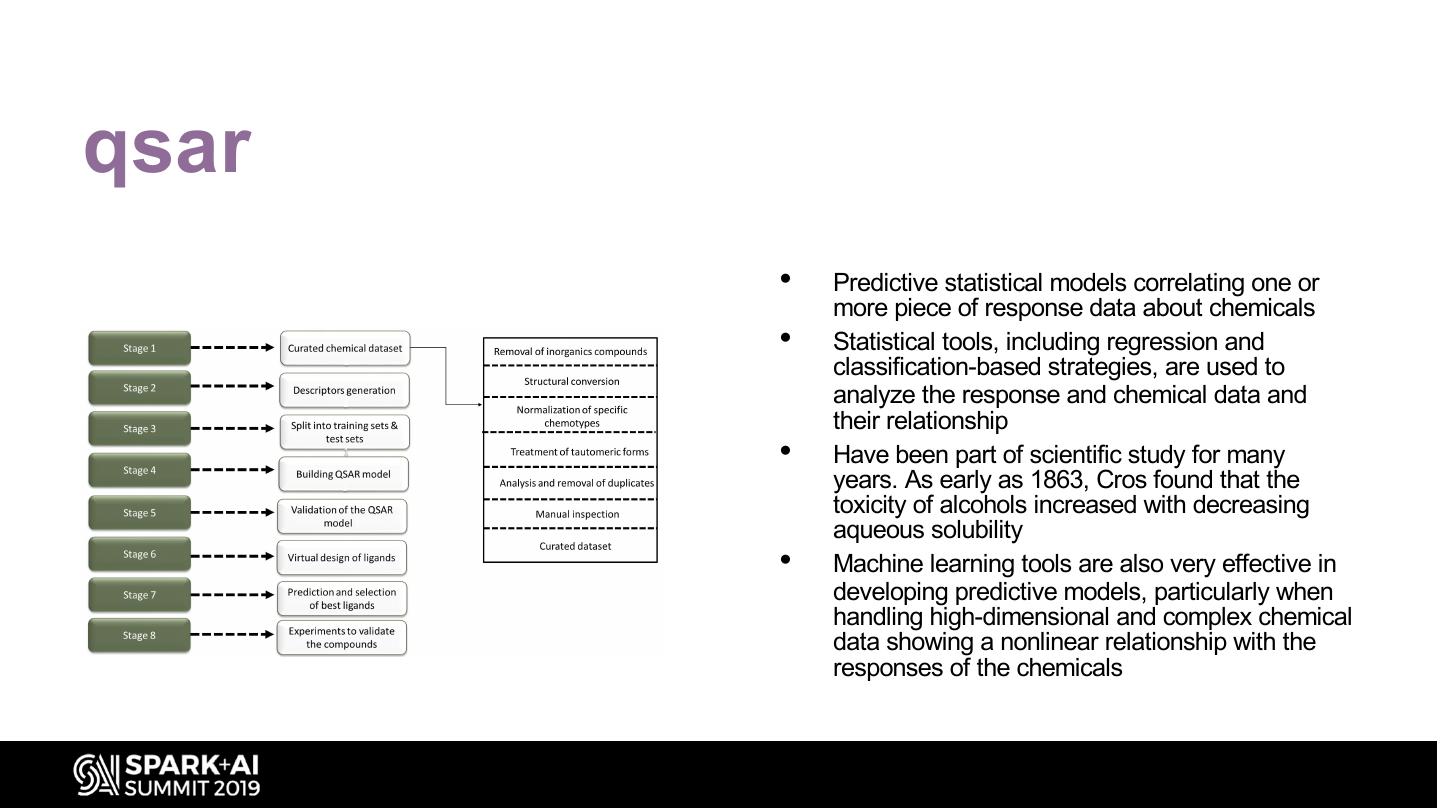
20 .qsar • Predictive statistical models correlating one or more piece of response data about chemicals • Statistical tools, including regression and classification-based strategies, are used to analyze the response and chemical data and their relationship • Have been part of scientific study for many years. As early as 1863, Cros found that the toxicity of alcohols increased with decreasing aqueous solubility • Machine learning tools are also very effective in developing predictive models, particularly when handling high-dimensional and complex chemical data showing a nonlinear relationship with the responses of the chemicals
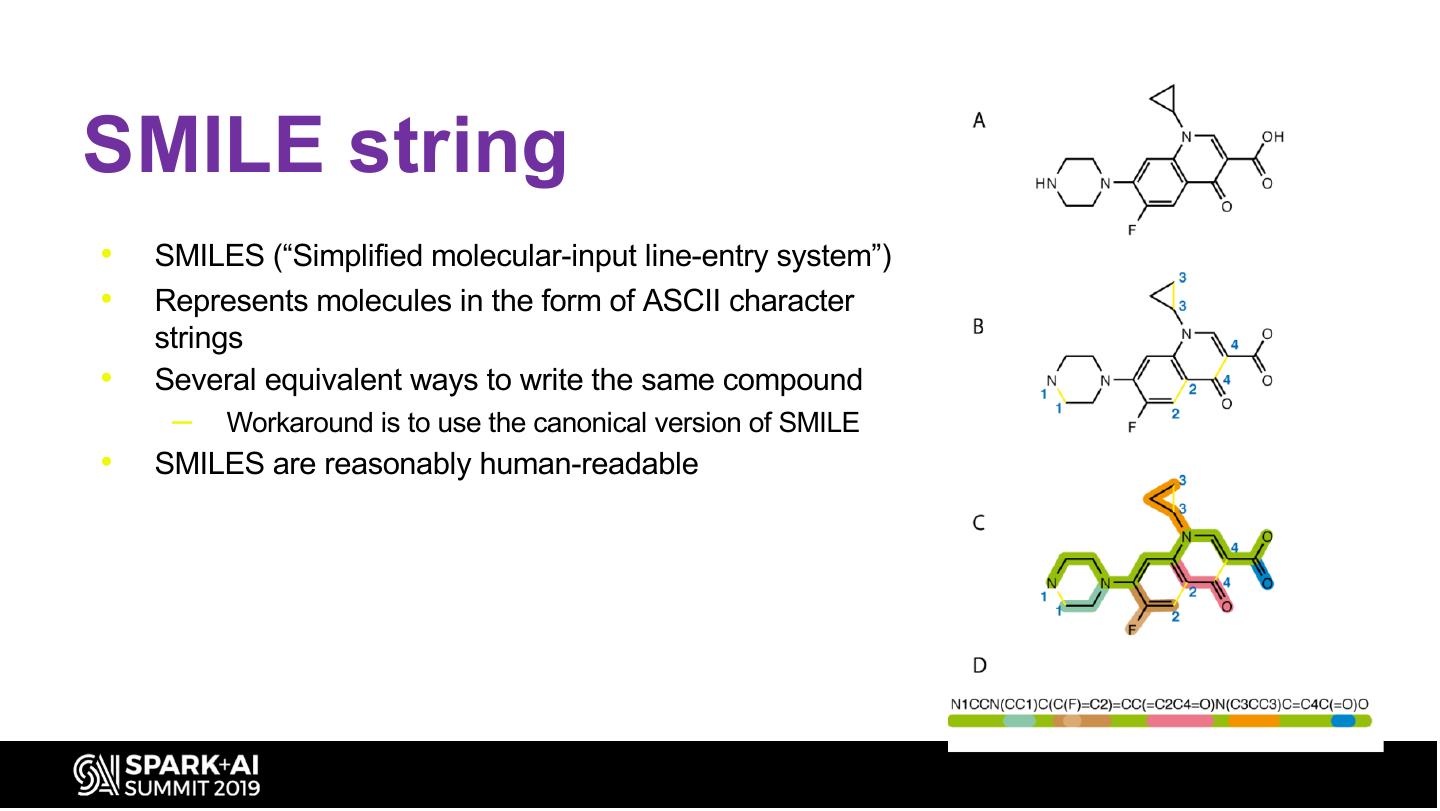
21 .SMILE string • SMILES (“Simplified molecular-input line-entry system”) • Represents molecules in the form of ASCII character strings • Several equivalent ways to write the same compound – Workaround is to use the canonical version of SMILE • SMILES are reasonably human-readable
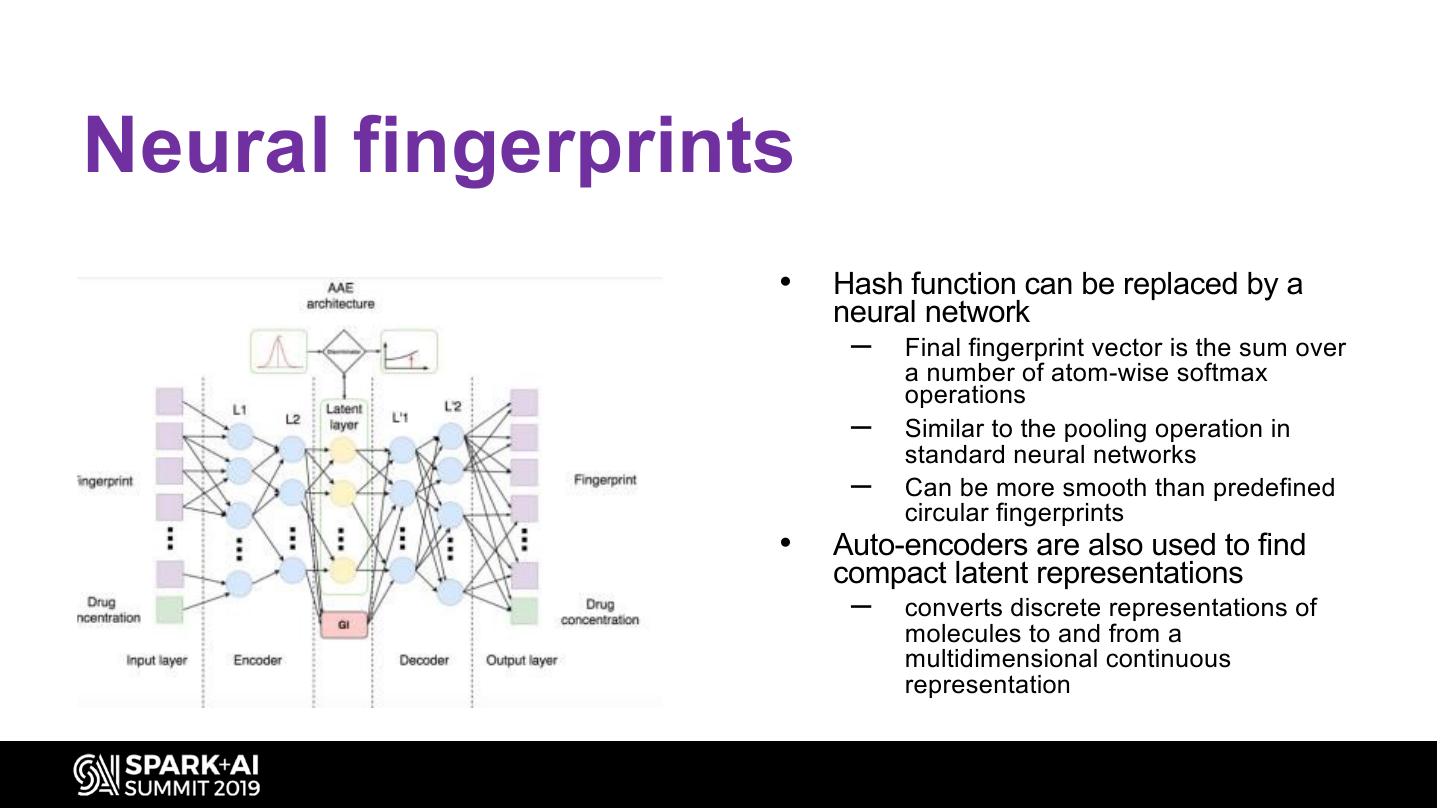
22 .Neural fingerprints • Hash function can be replaced by a neural network – Final fingerprint vector is the sum over a number of atom-wise softmax operations – Similar to the pooling operation in standard neural networks – Can be more smooth than predefined circular fingerprints • Auto-encoders are also used to find compact latent representations – converts discrete representations of molecules to and from a multidimensional continuous representation
23 .Drug safety assessment • According to Tufts Center for the Study of Drug Development (CSDD) the three main causes of failures in Phase III trials: – Efficacy (or rather lack thereof) — i.e., failure to meet the primary efficacy endpoint – Safety (or lack thereof) — i.e., unexpected adverse or serious adverse events – Commercial / financial — i.e., failure to demonstrate value compared to existing therapy • According to another study by Yale School of Medicine – 71 of the 222 drugs approved in the first decade of the millennium were withdrawn – Took a median of 4.2 years after the drugs were approved for these safety concerns to come to light – Drugs ushered through the FDA's accelerated approval process were among those that had higher rates of safety interventions
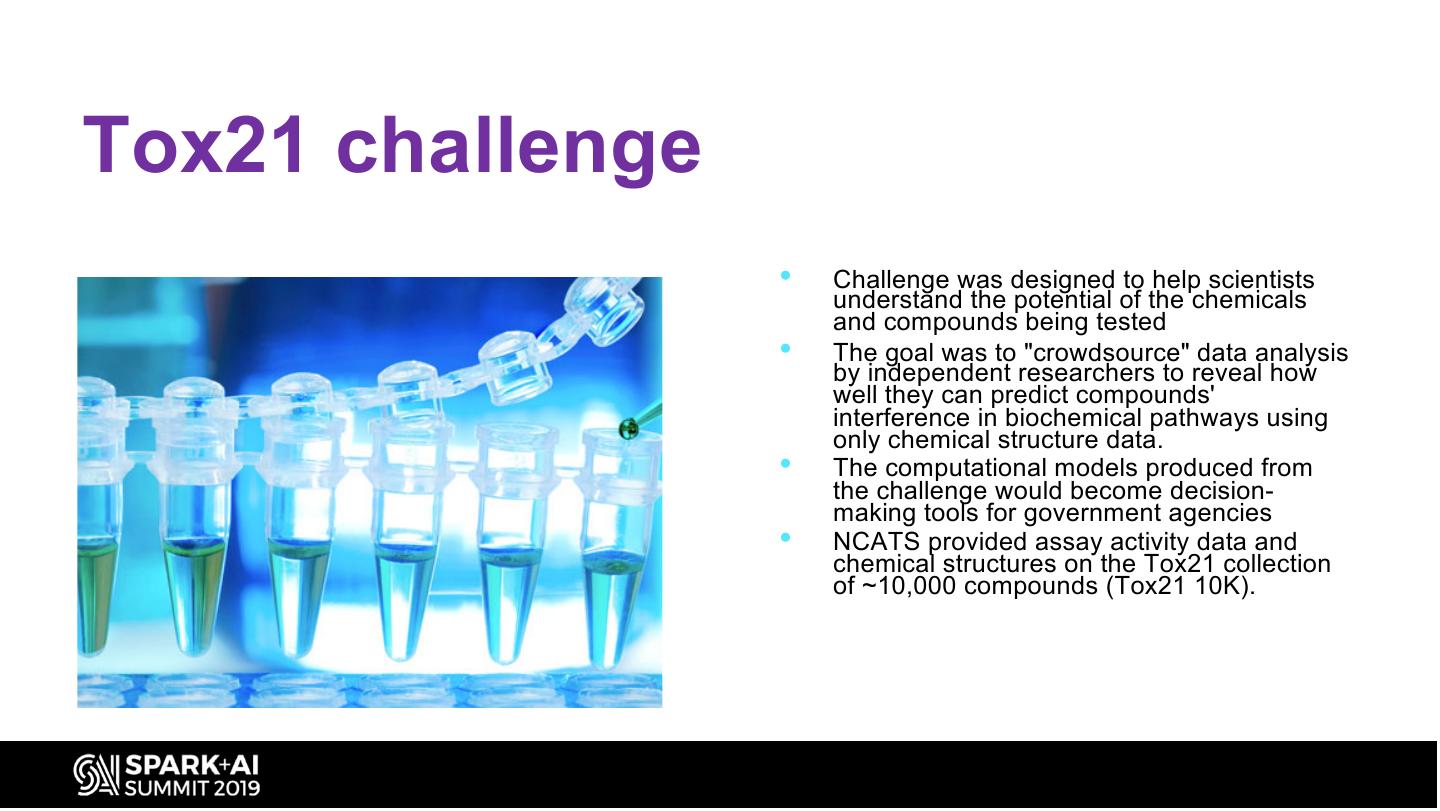
24 .Tox21 challenge • Challenge was designed to help scientists understand the potential of the chemicals and compounds being tested • The goal was to "crowdsource" data analysis by independent researchers to reveal how well they can predict compounds' interference in biochemical pathways using only chemical structure data. • The computational models produced from the challenge would become decision- making tools for government agencies • NCATS provided assay activity data and chemical structures on the Tox21 collection of ~10,000 compounds (Tox21 10K).
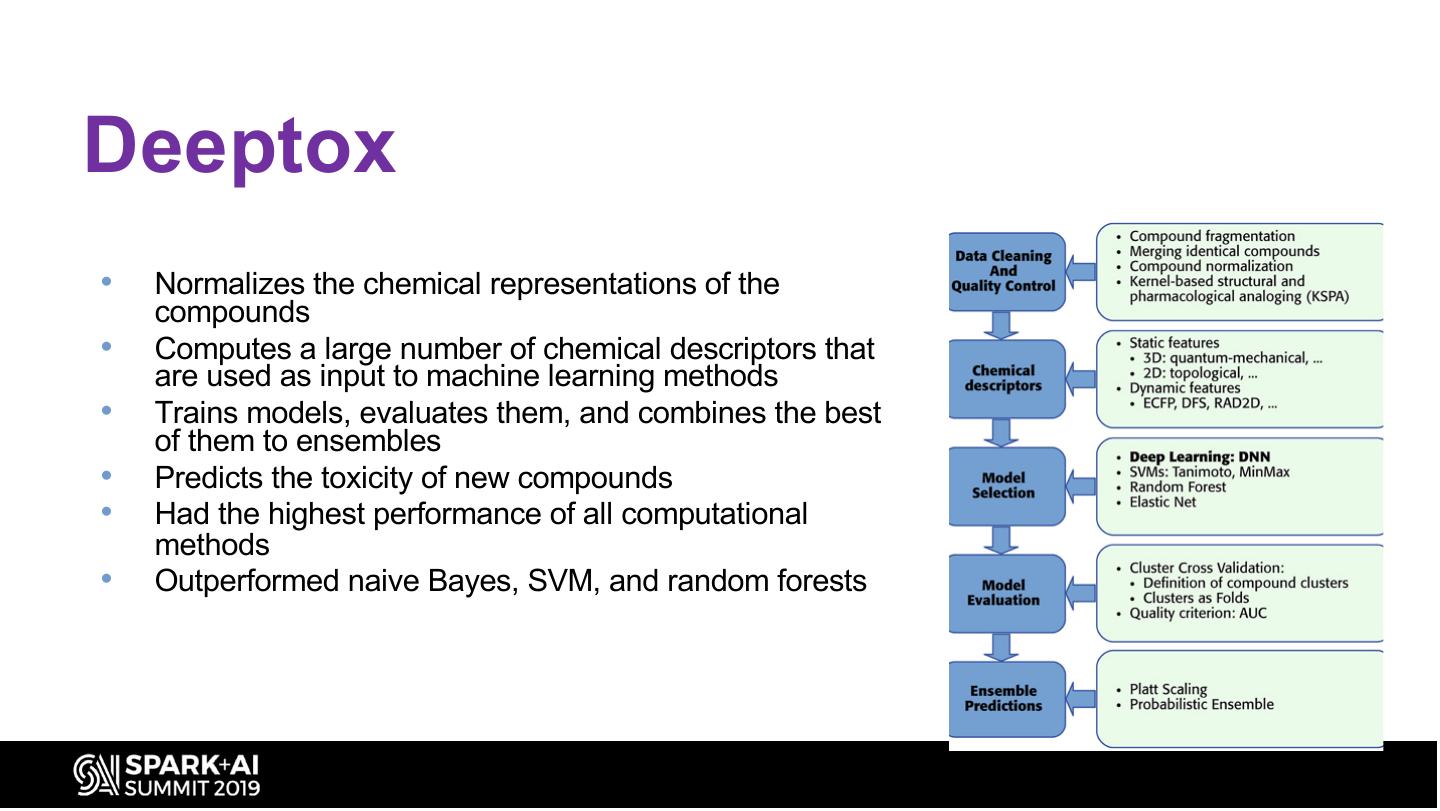
25 .Deeptox • Normalizes the chemical representations of the compounds • Computes a large number of chemical descriptors that are used as input to machine learning methods • Trains models, evaluates them, and combines the best of them to ensembles • Predicts the toxicity of new compounds • Had the highest performance of all computational methods • Outperformed naive Bayes, SVM, and random forests
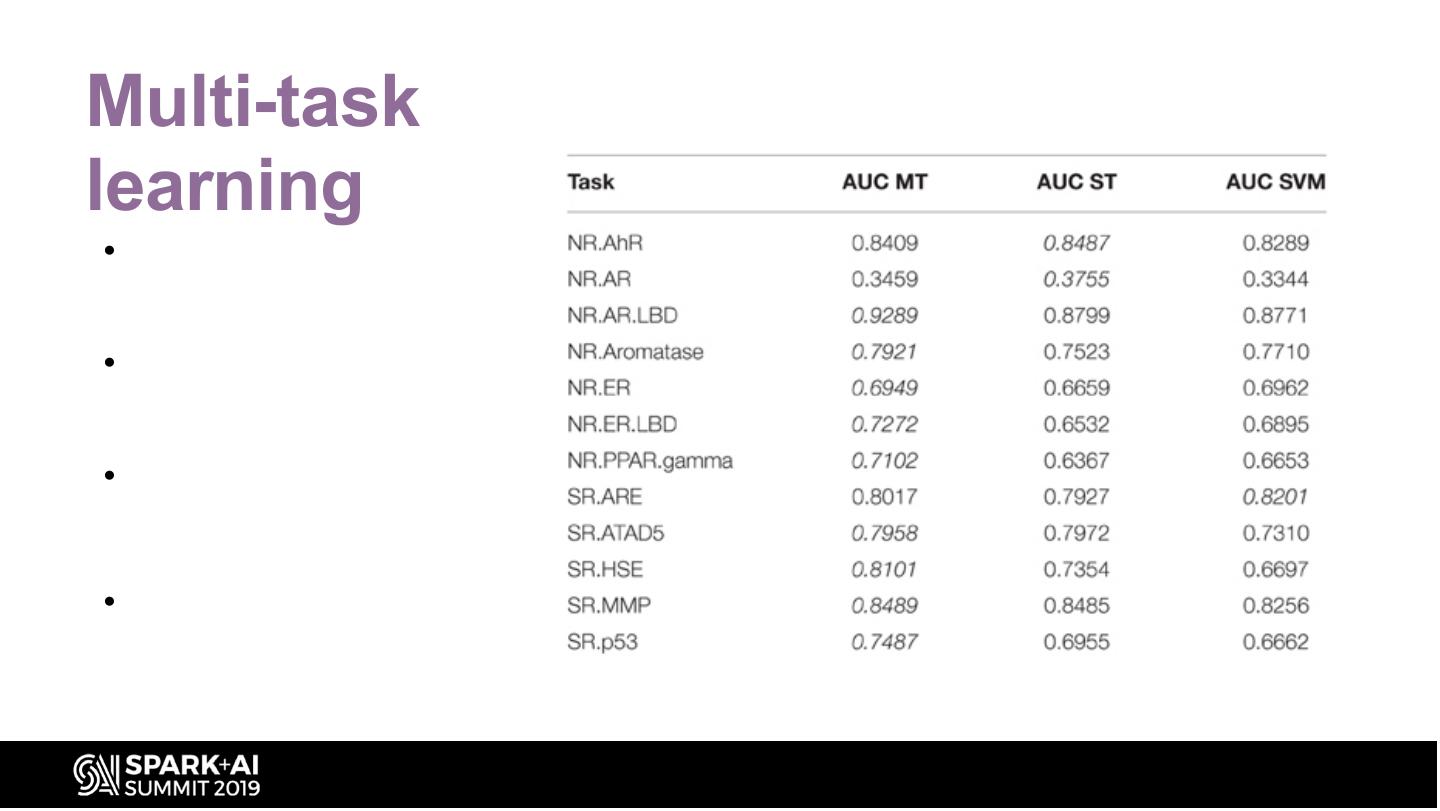
26 .Multi-task learning • They were able to apply multi- task learning in the Tox21 challenge because most of the compounds were labeled for several tasks • Multi-task learning has been shown to enhance the performance of DNNs when predicting biological activities at the protein level • Since the twelve different tasks of the Tox21 challenge data were highly correlated, they implemented multi-task learning in the DeepTox pipeline. •
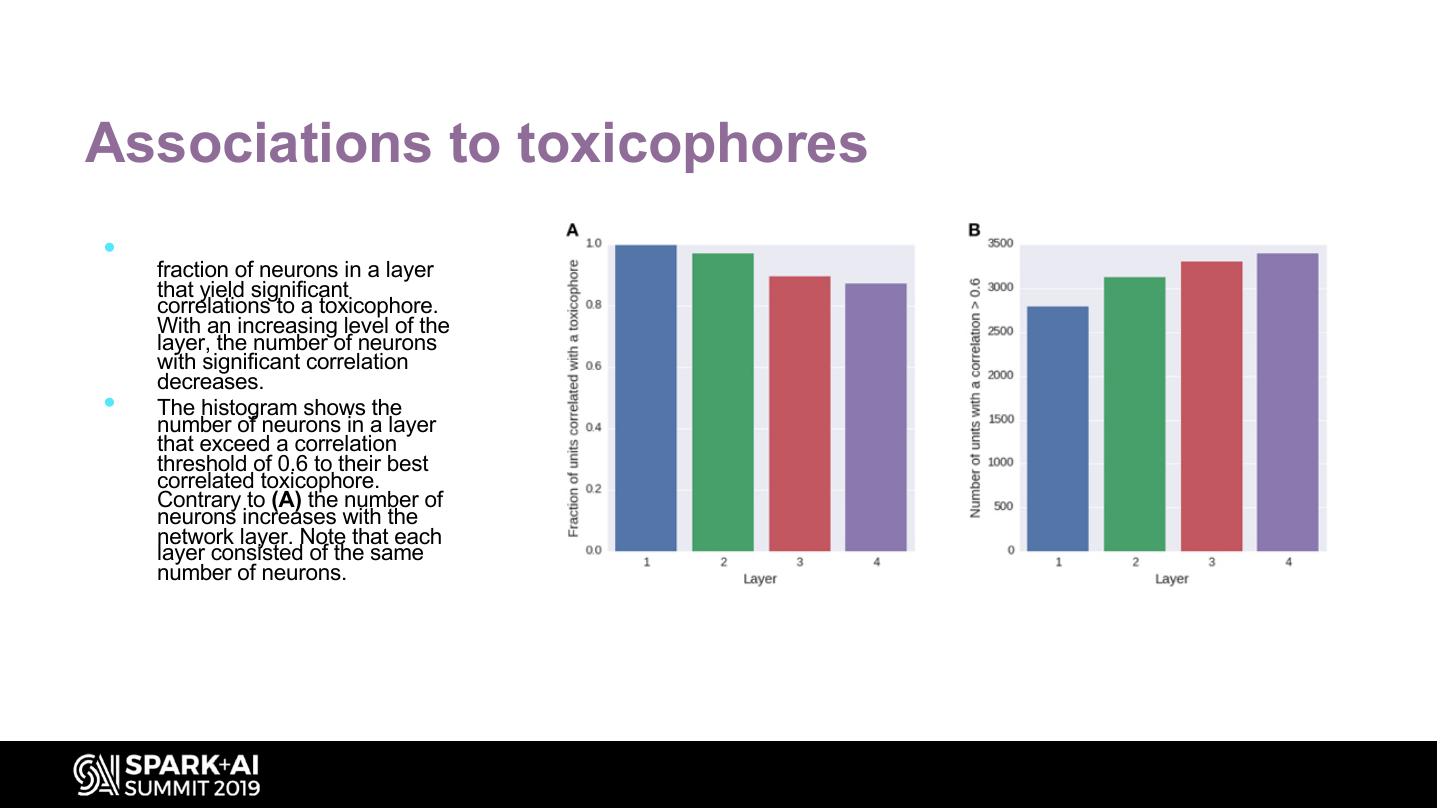
27 .Associations to toxicophores • The histogram (A) shows the fraction of neurons in a layer that yield significant correlations to a toxicophore. With an increasing level of the layer, the number of neurons with significant correlation decreases. • The histogram shows the number of neurons in a layer that exceed a correlation threshold of 0.6 to their best correlated toxicophore. Contrary to (A) the number of neurons increases with the network layer. Note that each layer consisted of the same number of neurons.
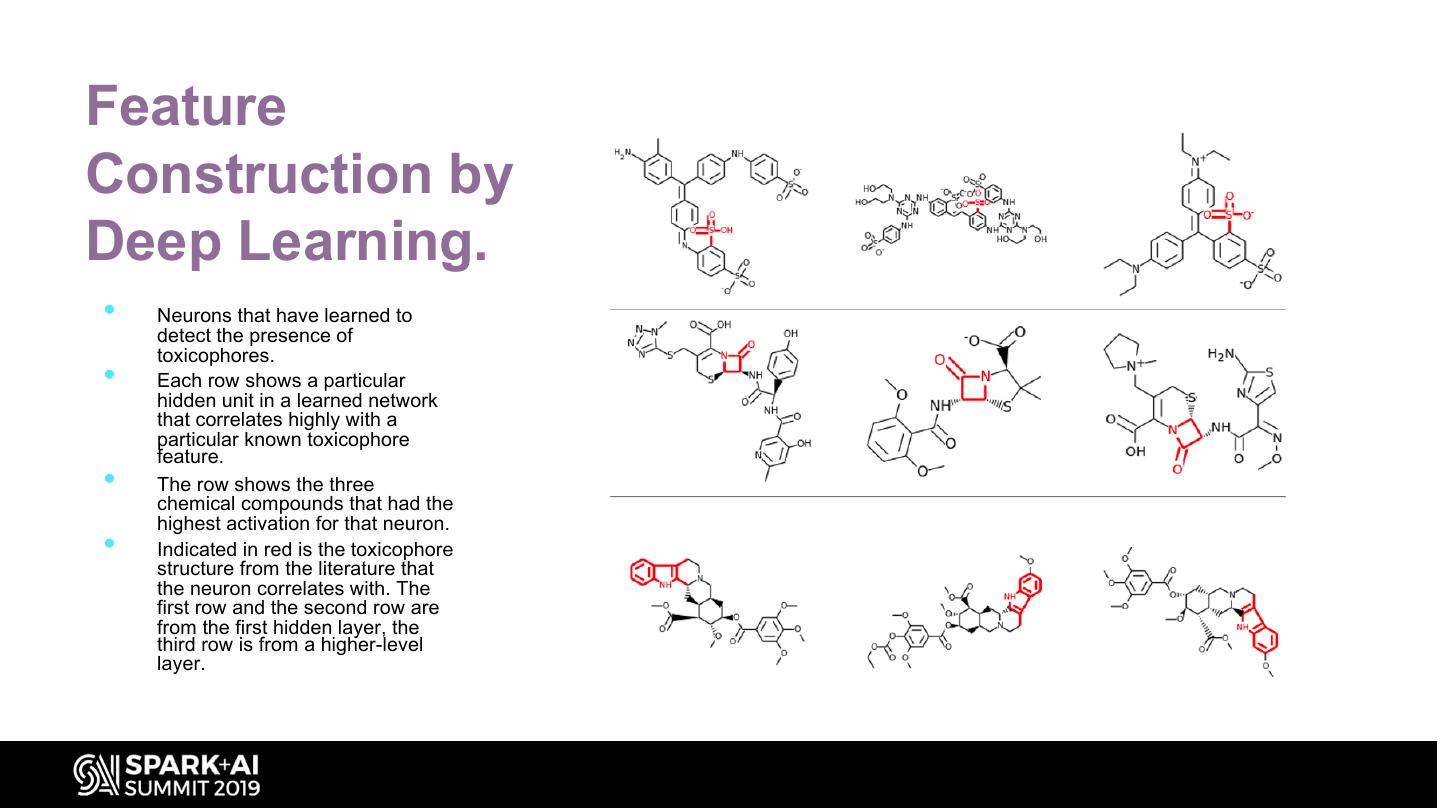
28 .Feature Construction by Deep Learning. • Neurons that have learned to detect the presence of toxicophores. • Each row shows a particular hidden unit in a learned network that correlates highly with a particular known toxicophore feature. • The row shows the three chemical compounds that had the highest activation for that neuron. • Indicated in red is the toxicophore structure from the literature that the neuron correlates with. The first row and the second row are from the first hidden layer, the third row is from a higher-level layer.
29 .Demo


