- 快召唤伙伴们来围观吧
- 微博 QQ QQ空间 贴吧
- 视频嵌入链接 文档嵌入链接
- 复制
- 微信扫一扫分享
- 已成功复制到剪贴板


Predicting Banking Customer Needs with an Agile Approach to Analytics in Cloud
Moneta has repeatedly been recognized as the most innovative bank on the Czech market. This is due in large part to their strategy of completely shifting to the cloud and using data and advanced analytics to innovate the customer experience with use cases ranging from real-time recommendations to fraud detection.
In this talk, we’ll share how we migrated to the cloud to create an agile environment for analytics and AI. From rapid prototyping machine learning use cases to moving models into production, core to this approach was building a unified platform for data and analytics on Apache Spark, Databricks and AWS. Discussion topics include:
Moneta’s strategy and roadmap for moving to the cloud and creation of the data squad
Overview of use cases including ATM/branch location optimization using geo-data, digital channel attribution, identify fraud detection, etc.
Deep dive into the use of digital behavioural data (web, mobile app, internet banking) and offline transactions to understand and predict customer needs in near-real time using Spark MLLib
Approach to building the agile analytics platform and the specific challenges of using the cloud in a financial institution
展开查看详情
1 .Predicting Banking Customer Needs with an Agile Approach to Analytics in the Cloud October 2019
2 .Who is presenting today … Jakub Mašek Milan Berka - Leader of DataSquad at MONETA - Machine learning engineer at - Experienced data science manager DataSentics, working for Moneta’s - Roles: DataSquad - Partnering with the different - Spark-certified developer departments across the bank - Roles: - Helping finding them the ML - Building the analytical platform opportunities - Productionalizing the usecases - Managing the process - Evangelize Spark across the company 2 jakub.masek@moneta.cz milan.berka@datasentics.com www.linkedin.com/in/jakub-mašek- www.linkedin.com/in/milan-berka/ 19631155
3 .Agenda Background: • Who is MONETA Money Bank a what is the role of Datasentics • Moneta’s journey into the cloud • Creation of Data Squad Building the analytical platform: • Setting up an analytical environment in the cloud fully utilizing AWS and Databricks • Hurdles along the way Use-cases: • Utilizing online data in digital marketing and customer value management • Optimization of branches/ATM Next steps, Q&A
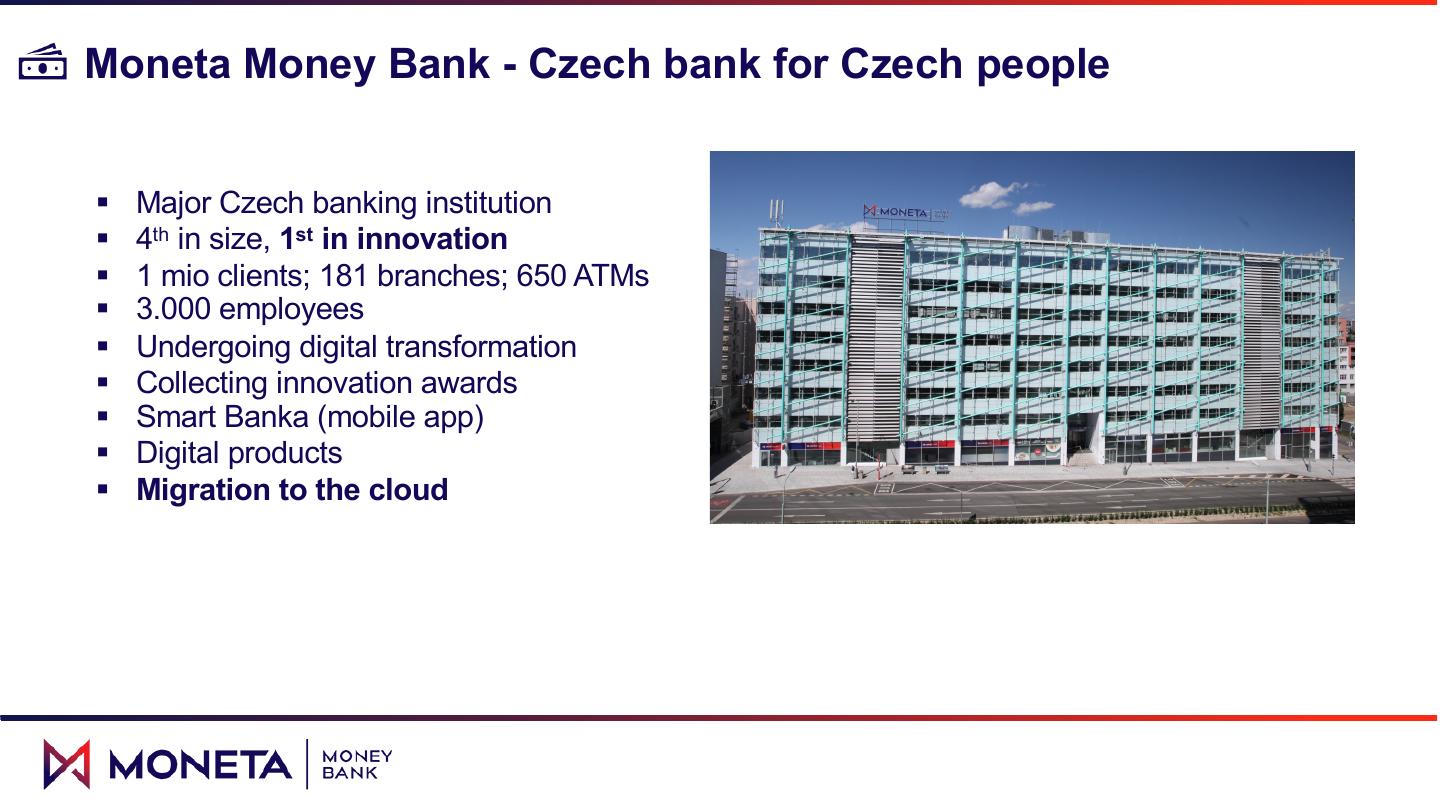
4 .Moneta Money Bank - Czech bank for Czech people § Major Czech banking institution § 4th in size, 1st in innovation § 1 mio clients; 181 branches; 650 ATMs § 3.000 employees § Undergoing digital transformation § Collecting innovation awards § Smart Banka (mobile app) § Digital products § Migration to the cloud
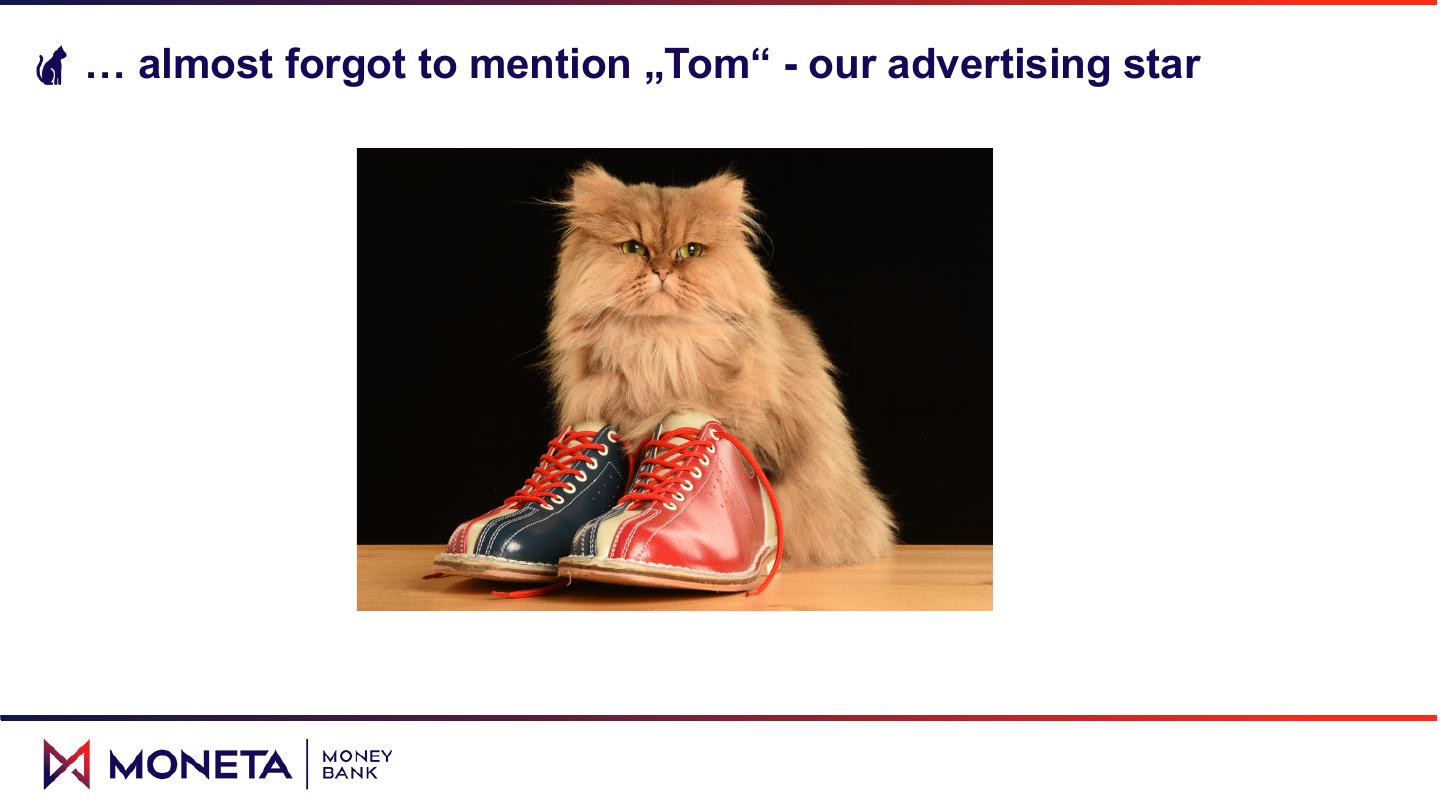
5 .… almost forgot to mention „Tom“ - our advertising star
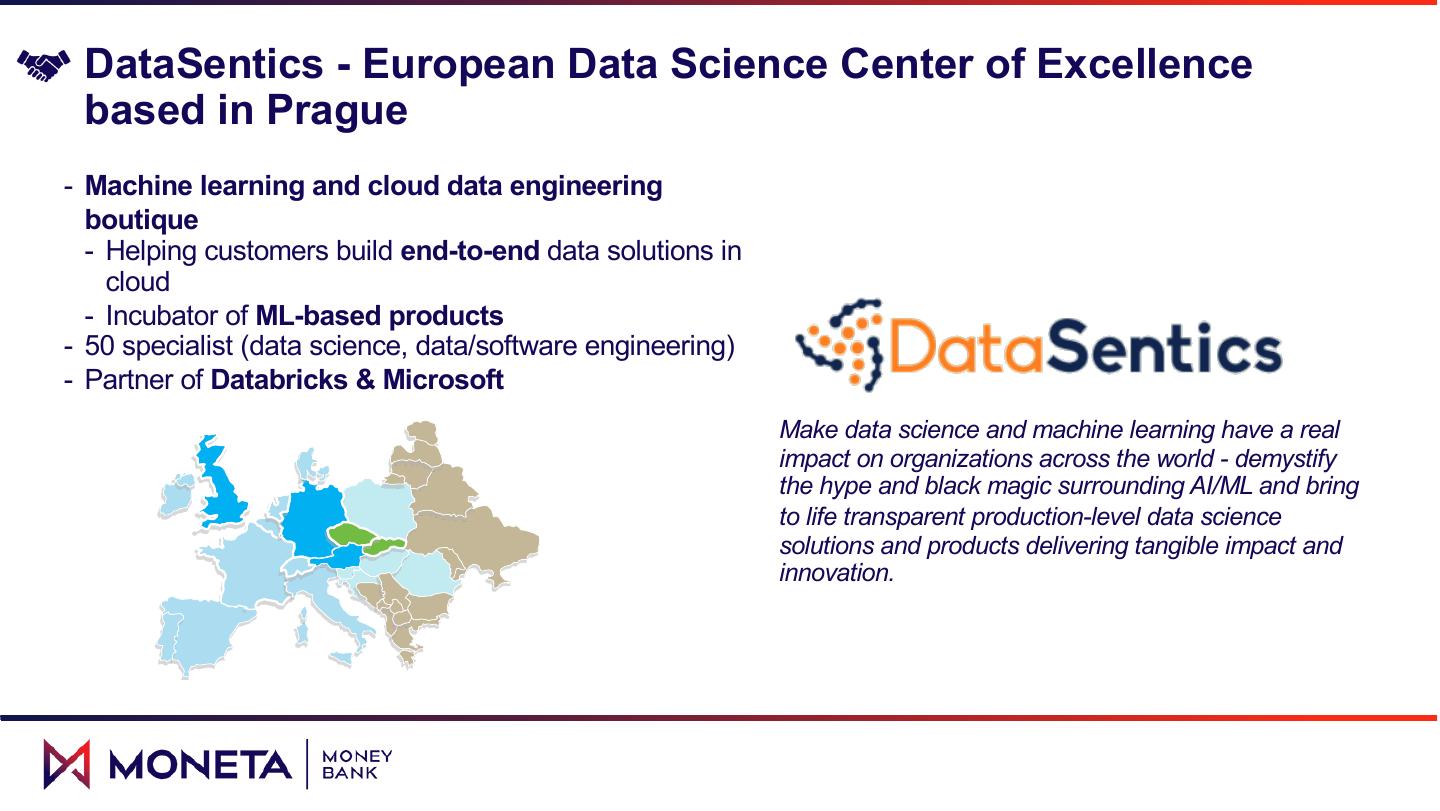
6 . DataSentics - European Data Science Center of Excellence based in Prague - Machine learning and cloud data engineering boutique - Helping customers build end-to-end data solutions in cloud - Incubator of ML-based products - 50 specialist (data science, data/software engineering) - Partner of Databricks & Microsoft Make data science and machine learning have a real impact on organizations across the world - demystify the hype and black magic surrounding AI/ML and bring to life transparent production-level data science solutions and products delivering tangible impact and innovation.
7 .Moneta and it’s journey to the cloud 2021 2020 Optimal cloud hosting 2019 50+% cloud-based Growing Platform 2018 as a Service 30+% cloud-based 10% cloud-based • Primary Datacenter • PaaS, SaaS and • Software and • Use the most optimal migration Containers Infrastructure hosting strategy for each • Cloud design & initiation • Automation embedded harmonization application • First set of application into the key processes • Platform as a Service, • Further infrastructure and migrated to Amazon • Second Datacenter implemented for the application optimization Cloud migration selected capabilities • Hosted fixed telephony • AS400 refresh/hosting • Software as a Service implemented for the selected capabilities
8 .Birth of Datasquad as a new analytical DNA supporting the cloud journey and making „digital“ into real Old analytical world New analytical world -Tools: - Cloud-based, elastic and scalable – -Tools: unlimited resources -On-premise Oracle data warehouse - Data in Datalake with limited computational power - Spark, Python, R -On-premise SAS for modelling -Data: -Data: Mainly offline (transactions, …) - offline (internal data) - online (web-browsing data, digital marketing data, …)
9 .Datasquad is pioneering the new analytical world DATALAKE DATA TEAM DATA SCIENCE EVANGELIZATION PLATFORM SOLUTIONS & SERVICE - POC; MVP - onboarding - Products - Evangelize Spark - Frameworks and new technologies
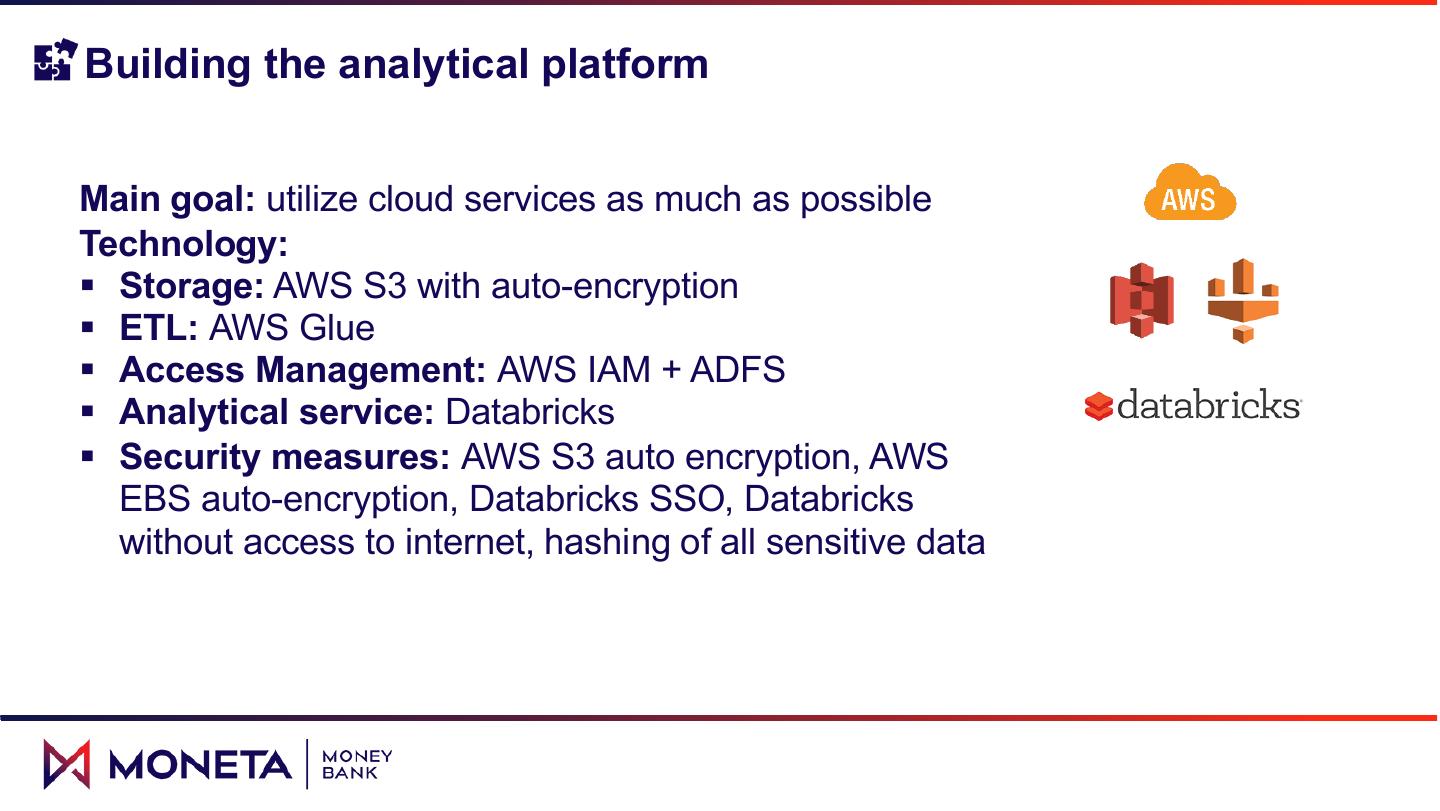
10 .Building the analytical platform Main goal: utilize cloud services as much as possible Technology: § Storage: AWS S3 with auto-encryption § ETL: AWS Glue § Access Management: AWS IAM + ADFS § Analytical service: Databricks § Security measures: AWS S3 auto encryption, AWS EBS auto-encryption, Databricks SSO, Databricks without access to internet, hashing of all sensitive data
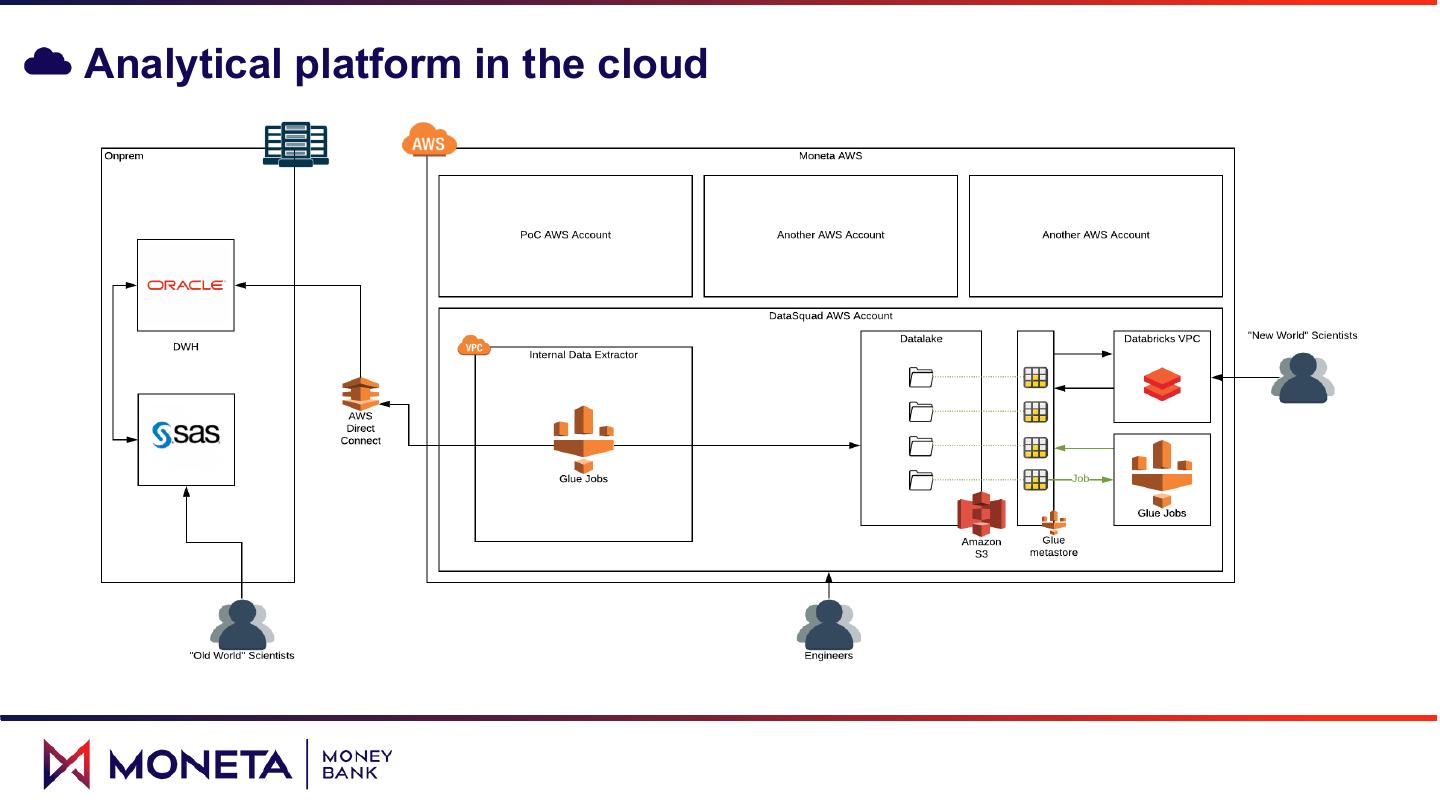
11 .Analytical platform in the cloud
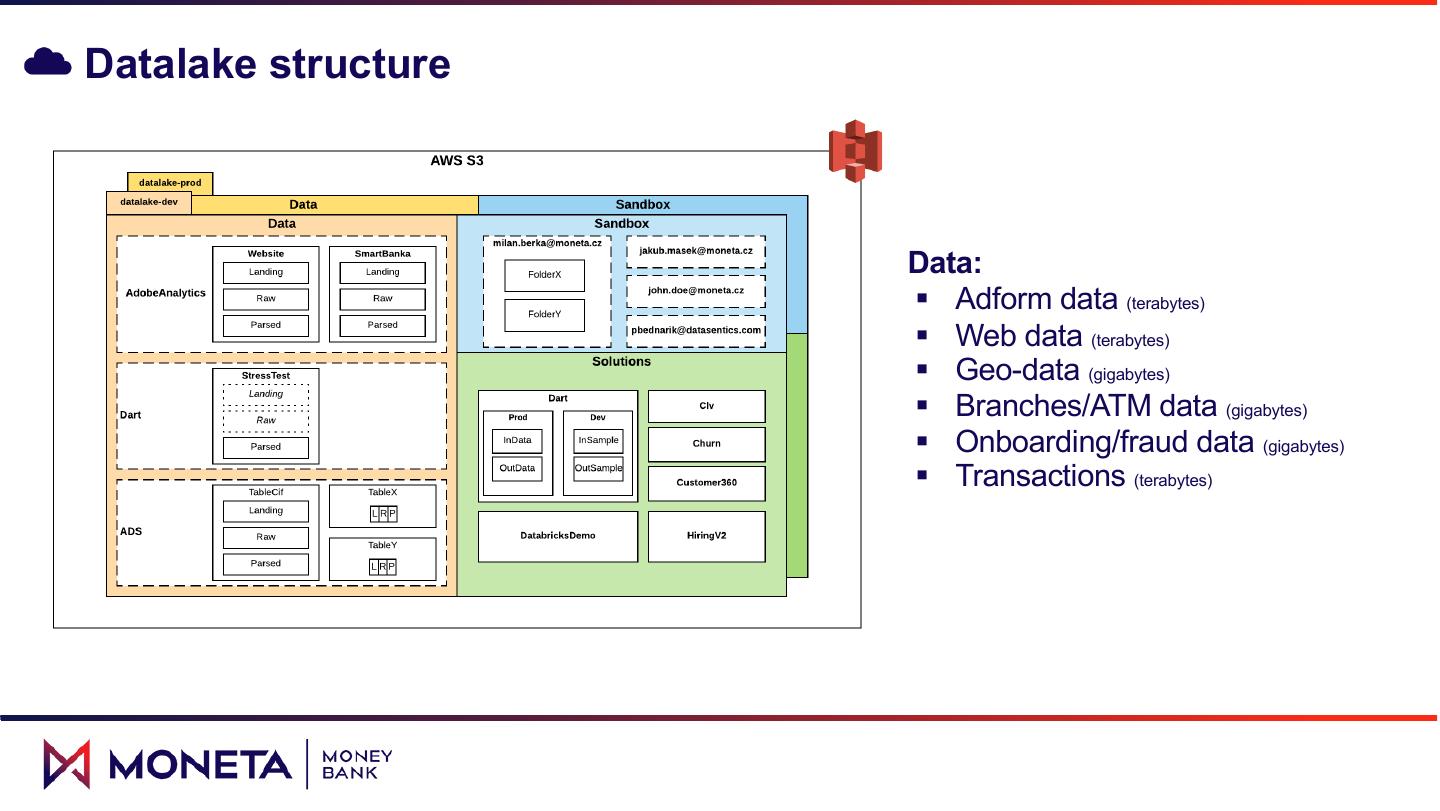
12 .Datalake structure Data: § Adform data (terabytes) § Web data (terabytes) § Geo-data (gigabytes) § Branches/ATM data (gigabytes) § Onboarding/fraud data (gigabytes) § Transactions (terabytes)
13 .Use-cases “Online” data Web analytics data DIGITAL STORY (AdobeAnalytics/GA) Campaign data (Adform) BRANCH / ATM STORY Real estate market data Feature Store CVM STORY “Offline” data RISK STORY Branch/ATM performance Sales data Onboarding data FRAUD / AML STORY CVM data
14 .Use-cases “Online” data Web analytics data DIGITAL STORY (AdobeAnalytics/GA) Campaign data (Adform) BRANCH / ATM STORY Real estate market data Feature Store CVM STORY “Offline” data RISK STORY Branch/ATM performance Sales data Onboarding data FRAUD / AML STORY CVM data
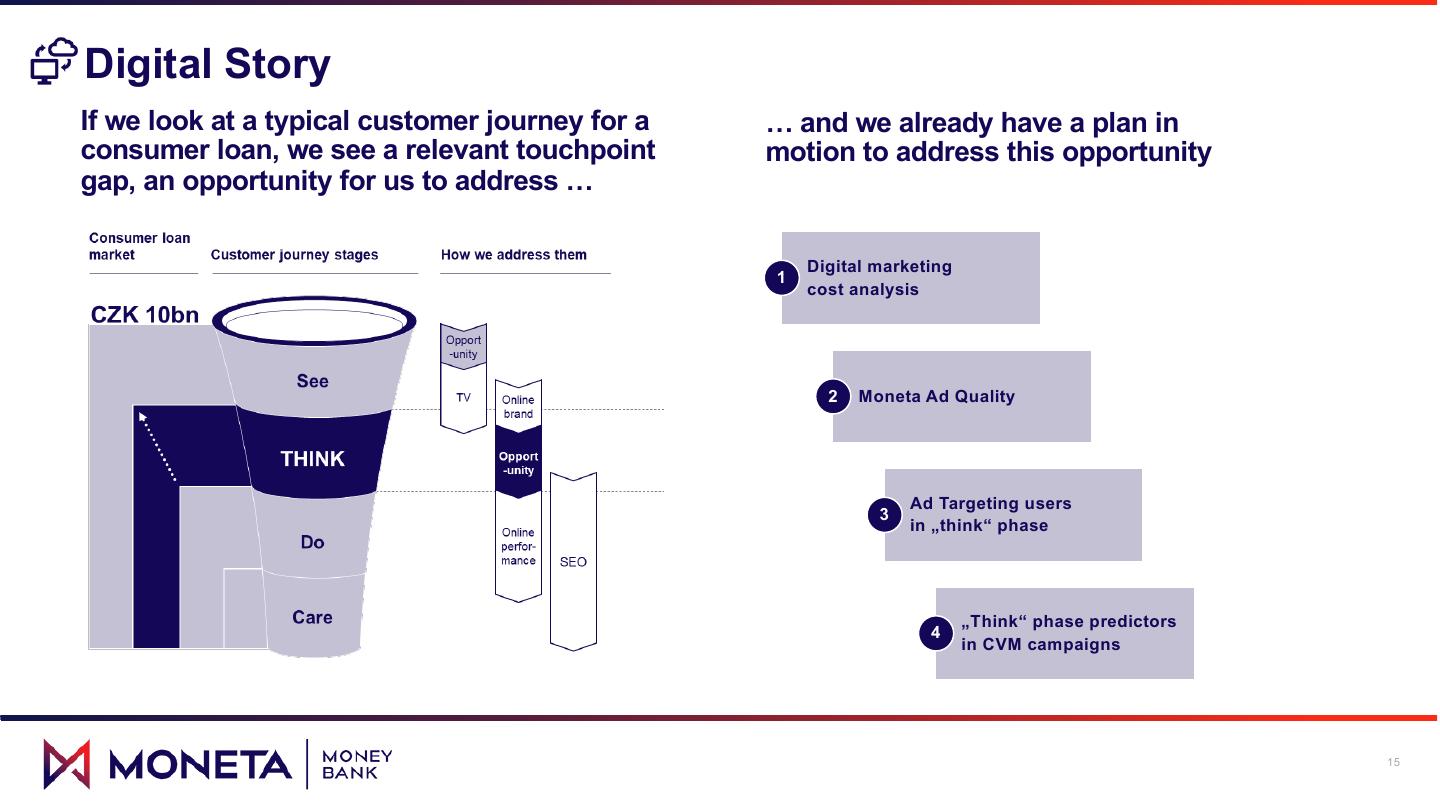
15 .Digital Story If we look at a typical customer journey for a … and we already have a plan in consumer loan, we see a relevant touchpoint motion to address this opportunity gap, an opportunity for us to address … Digital marketing 1 cost analysis 2 Moneta Ad Quality Ad Targeting users 3 in „think“ phase „Think“ phase predictors 4 in CVM campaigns 15
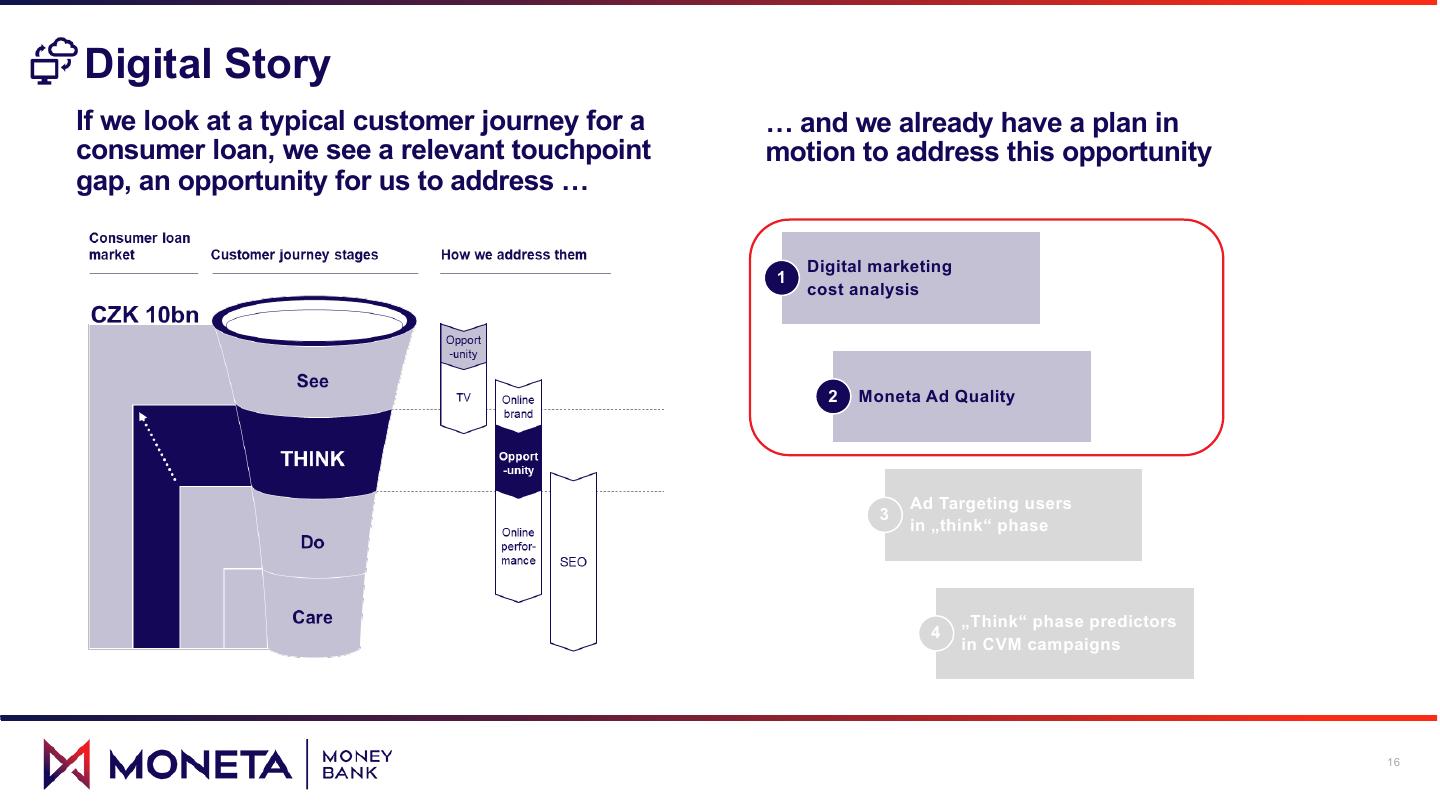
16 .Digital Story If we look at a typical customer journey for a … and we already have a plan in consumer loan, we see a relevant touchpoint motion to address this opportunity gap, an opportunity for us to address … Digital marketing 1 cost analysis 2 Moneta Ad Quality Ad Targeting users 3 in „think“ phase „Think“ phase predictors 4 in CVM campaigns 16
17 .1 USE CASE: Digital marketing cost analysis THERE IS OBVIOUS POTENTIAL IN THE „THINK“ PHASE → WE HAVE PROVEN, THAT DISPLAY ADS DRIVE SALES INDIRECTLY WHAT WE DID • We implemented an attribution model to prove how online ad Marketing channel Costs (units) Cost efficiency impressions (not clicks!) drive sales. An attribution model shows how each market channel drives conversions. Here we Performance - Adform 1 11,3 wanted to see what contribution each channel makes to closing consumer loans. Brand - Adform 17 6,6 DATA WE USED Performance - remarketing 23 2,4 • Advertising data (what user, on which specific website/page/context, for how long has seen or interacted with Performance - display 26 1,2 our Ads, for how much) • Moneta Website behavior Performance – search 1 115 1 • Marketing costs Performance - social 0,75 0,5 NEXT STEPS • Incrementally start to reallocate more budget to Online Ads Brand – youtube 0,4 0,18 (upper funnel – think phase) and evaluate impact on efficiency 1 Performance – search chosen as a reference with cost effeciency ratio 1 BUSINESS CASE • Increase digital sales for the same media spending. By better split between Online Ads and Search 17
18 . 2 USE CASE – Moneta Ad Quality WE CAN INCREASE AD VISIBILITY TO USERS IN → DIFFERENT COST PER VISIBLE MINUTE → ADJUSTING ADFORM BY DISADVANTAGING THINK PHASE ACROSS DIFFERENT WEBSITES DOMAINS WITH EXPENSIVE VISIBLE MINUTES WHAT WE DID • We see an ENORMOUS difference in visible time Analytical output - Cost per visible minute Adform implementation – multipliers of online Ads. Cost per 1 visible minute in Online .. differs from 15 to 35 CZK in . autoweb.cz 0.75 autozine.cz 0.8 DATA WE USED autozive.cz 0.9 • Advertising data (what user, on which specific avizo.cz 0.85 website/page/context, for how long has seen or babinet.cz 0.95 babyweb.cz 0.65 interacted with our Ads, for how much) Quality banger.cz 0.85 banky.cz 0.85 API model bazarbox.cz 0.7 NEXT STEPS behani.cz 0.85 • Create engine to optimize Online Ads buying bejvavalo.cz 0.85 bezrealitky.cz 0.65 (buy more visible ads) biatlonmag.cz 0.8 biginzerce.cz 0.7 bike-mania.cz 0.85 BUSINESS CASE .. • We should be able to buy at least 20% more . media time for the same budget 18
19 . Branch Story Moneta needs to independently evaluate every single locality or branch network cross the country … v Assumption v Approach v Target variable Locality (L) attractiveness is given by To measure attractiveness, weights of individual MONETA wants to compare localities in terms of surrounded points of interests points of interests need to be set business KPI - possible bank performance • Total attractiveness of the measured point is given by the sum of partial weights • Two possible scenarios how to set the weights: 20 0 m et er s By expert (e.g. Bank 50; Bus station 15 …) having dimensionless index L Data Science approach (machine learnig) - using 1 2 181 internal data to set KPI and having interpretable resuls 19
20 . Branch Story use case WE CAN PREDICT PERFORMANCE IN ANY LOCALITY IN CZ → PRAGUE – EXPOSED AREAS BY PREDICTED PERFORMANCE INDEX WHAT WE DID • We wanted to evaluate every single location in CZ in terms of footfall. The closest equivalent to footfall is visitors' rate which is measured only for 15% of our network. But visitors' rate is strongly corelated with business KPI - performance rate - which was finally used as a proxy variable for our model. We are now able to predict possible banking performance of any observed location. DATA WE USED • Geospatial data - points of interests • Population statistics • Internal data – performance of our existing branches; costs; # FTEs; ATM performance MODEL VARIABLES • # of transportation in 200m • # of food in 200m • # of competitors and highly exposed areas • City population 20
21 .Use-case deep dive: DSID = Enabler for the Digital attribution model Problem: we have many identifiers (internal id, phone, website cookie, Adform cookie) of a person/client, which shows at different times at different places – how do we connect all these into a single ID? W1 W3 I1 A1 W2 A3 I3 A2 I2 W4 W5
22 .Use-case deep dive: DSID = Enabler for the Digital attribution model Answer: GraphFrames!
23 . Use-case deep dive: DSID = Enabler for the Digital attribution model WebsiteID InternalID WebsiteID AdformID InternalD Phone W1 I1 W1 A1 I1 999999 W2 I1 W2 A2 I2 999999 W3 NULL W3 A3 I3 019645 df3.filter(not_fake(col(‘Phone’)) df1.withColumn(‘src’, ‘WebsiteId’) df2.withColumn(‘src’, ‘WebsiteId’) df3.withColumn(‘src’, ‘InternalId’) df1.withColumn(‘dst’, ‘InternalId’) df2.withColumn(‘dst’, ‘AdformId’) df3.withColumn(‘dst’, ‘Phone’) df = df1 .union(df2) .union(df3) .distinct()
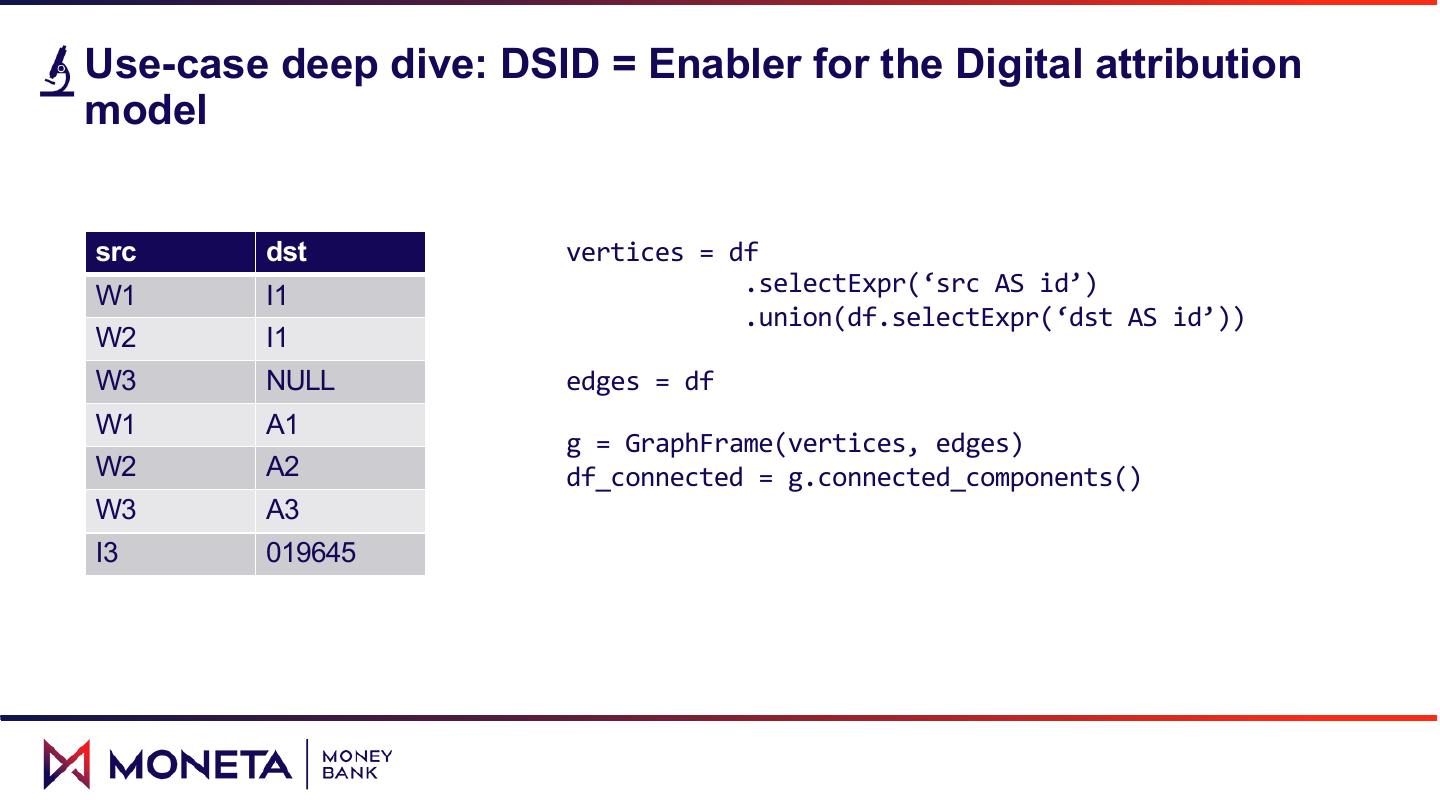
24 .Use-case deep dive: DSID = Enabler for the Digital attribution model src dst vertices = df W1 I1 .selectExpr(‘src AS id’) .union(df.selectExpr(‘dst AS id’)) W2 I1 W3 NULL edges = df W1 A1 g = GraphFrame(vertices, edges) W2 A2 df_connected = g.connected_components() W3 A3 I3 019645
25 .Use-case deep dive: DSID = Enabler for the Digital attribution model id Component plus further adjustements: W1 1 • filter business clients W2 1 • disjoint the groups with two or more internal ids • … W3 2 = DSID I3 3 I1 1 A1 1 Statistics: A2 1 - Number of vertices (ids): 14 969 170 A3 2 - Number of edges: 30 029 363 019645 3 - Running time: ~20 min
26 .Next steps - Major goal: Continue with democratizing of the platform, the ultimate goal is to have a self-serving data platform - Continue with the use-cases and moving them to production - Implement company-wide feature store - Employ new technologies (in particular - Spark Structured Streaming) 26
27 . Question How many members does Data Squad have?
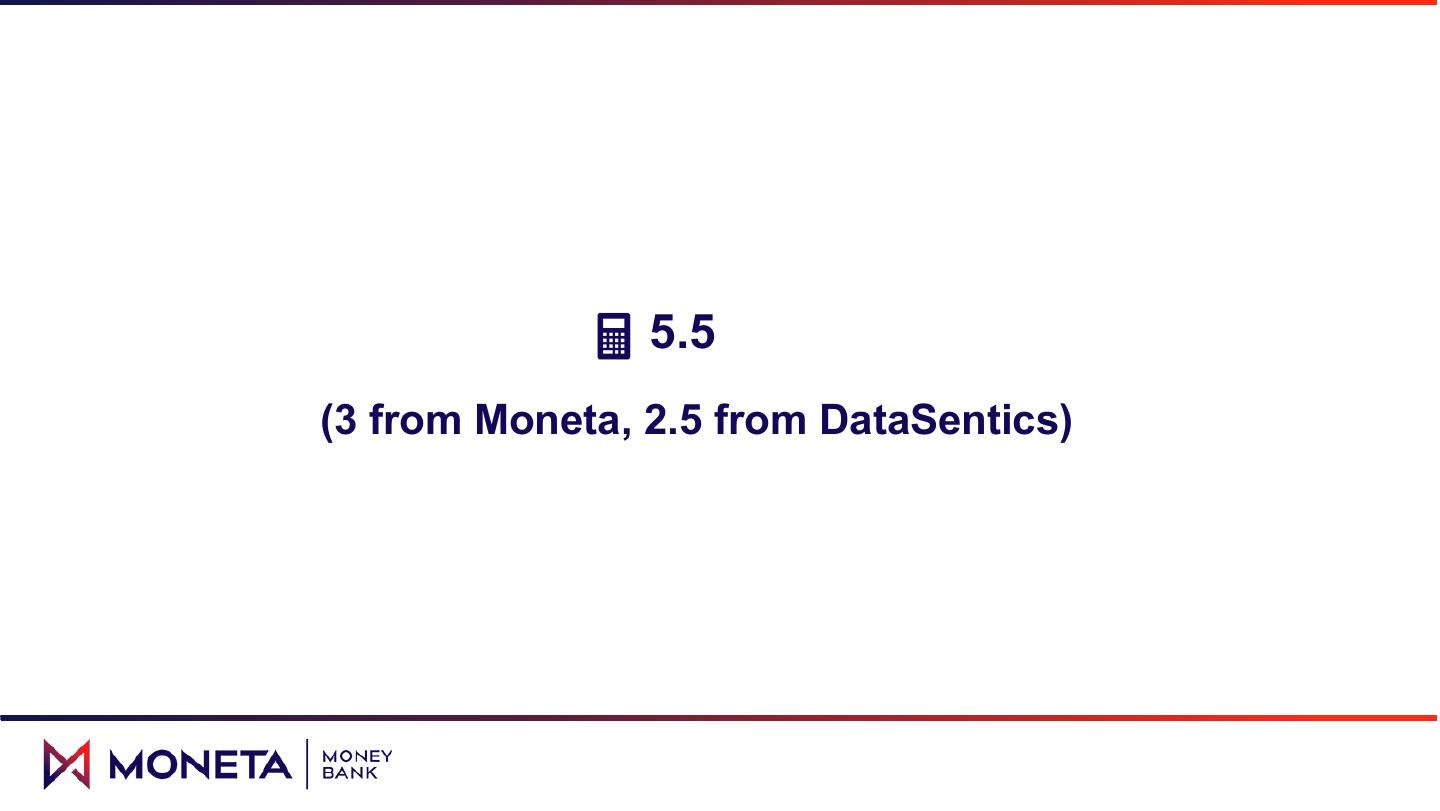
28 . 5.5 (3 from Moneta, 2.5 from DataSentics)
29 .Wrap up Even with the small team you can do big things … Achieving this - you need to have supportive environment and you need to be disruptive to drive changes and show the added value to prove that: … „data is really the new oil for your company“ Safety always first Data science is about data AND science – doing science is always linked with blind paths – be patient and keep going! 29


