- 快召唤伙伴们来围观吧
- 微博 QQ QQ空间 贴吧
- 视频嵌入链接 文档嵌入链接
- <iframe src="https://www.slidestalk.com/Spark/ScalableTimeSeriesForecastingandMonitoringusingApacheSparkandElasticSearch?embed&video" frame border="0" width="640" height="360" scrolling="no" allowfullscreen="true">复制
- 微信扫一扫分享


Scalable Time Series Forecasting and Monitoring using Apache Spark and ElasticSearch
Adyen enables integrating companies to accept payments from their customers using any payment method over any sales channel. We have designed and implemented a time series forecasting algorithm that allows us to predict the volume for each integration with confidence and thus be able to flag anomalies such as traffic drop or abnormally low traffic. We are using Apache Spark as our computational engine both to make this data available to the training process as well as to train over years of data in a scalable way. The prediction performances are benchmarked and the models are served in production through custom real-time monitoring and alerting infrastructure that uses ElasticSearch as hot storage. With this state-of-the-art solution, Adyen knows whether a problem happened and can alert the operational teams accordingly in a record time.
‘This presentation will cover the journey we took with focus on the mathematical concepts, the present time constraints, the prediction performances, and the architecture needed to make this happen. We’ll go over lessons learned, pitfalls, and best practices discovered on modeling time series datasets with Apache Spark. Data Scientists would be able to gain insights on applying effective and real-life seasonality modeling techniques. We’ll share our approaches used for sub-millisecond model serving that would inspire Data Engineers who work on related problems.
展开查看详情
1 .WIFI SSID:Spark+AISummit | Password: UnifiedDataAnalytics
2 .Time series forecasting and monitoring with Apache Spark and ElasticSearch Andreu Mora, Adyen #UnifiedDataAnalytics #SparkAISummit
3 .Adyen Payments Processor Tech company International customers (aka merchants) Omnichannel
4 .Back in the day… The legacy monitor was based on a SQL query that would compute an average for the hour of the week and compare to a threshold.
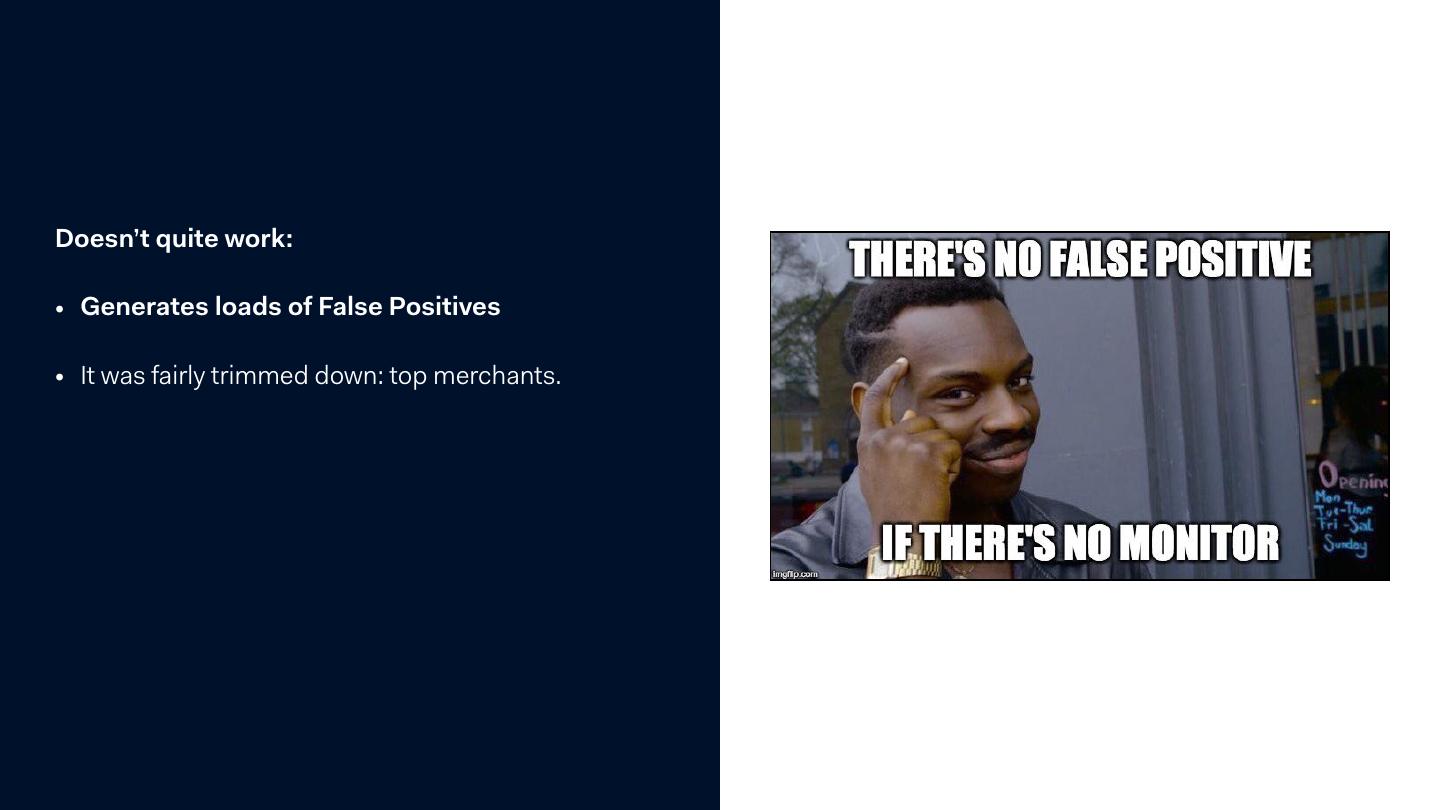
5 .Doesn’t quite work: • Generates loads of False Positives • It was fairly trimmed down: top merchants.
6 .Reduce False Positives
7 .Catch anomalies
8 .Do that at scale
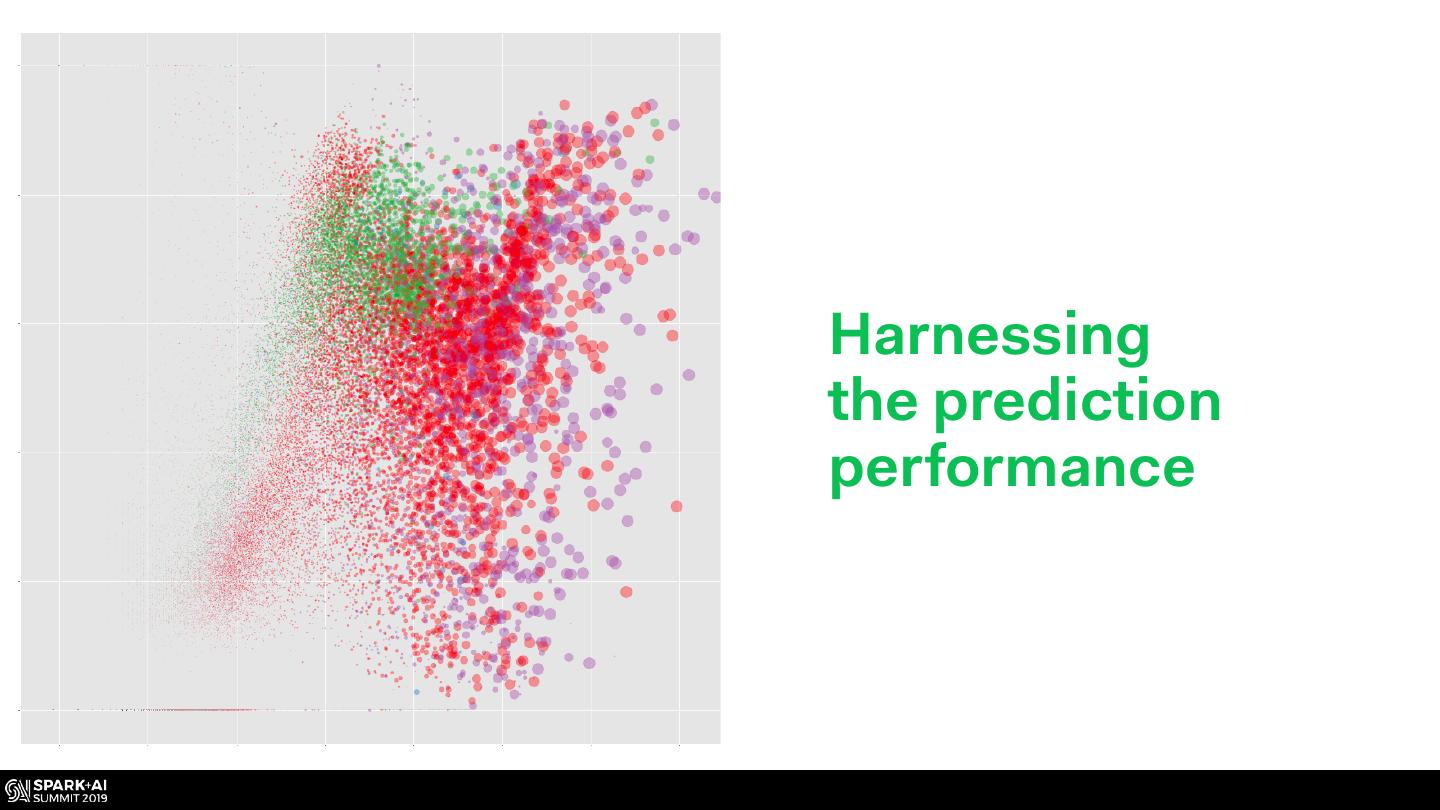
9 .Harness the detection performance
10 .Connect to a live platform
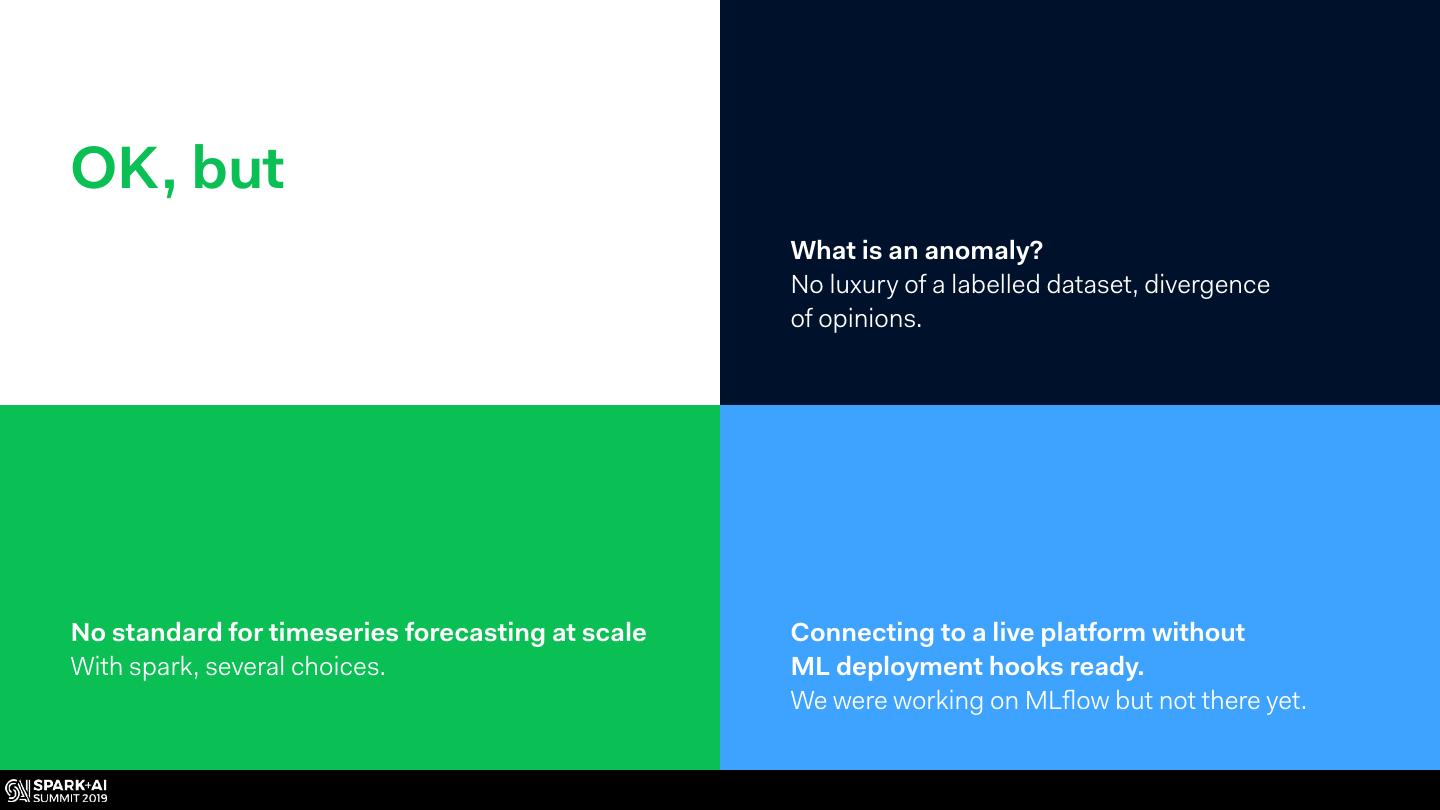
11 .OK, but What is an anomaly? No luxury of a labelled dataset, divergence of opinions. No standard for timeseries forecasting at scale Connecting to a live platform without With spark, several choices. ML deployment hooks ready. We were working on MLflow but not there yet.
12 . Considerations when dealing with Big Data Big Technology Big diversity Big consequences Leverage on mature Tech to Many different topologies for 1000 merchants * 10 min * 95% solve the problem (hello Spark). our merchants and yet one accuracy = 50400 emails/week algorithm to track them all.
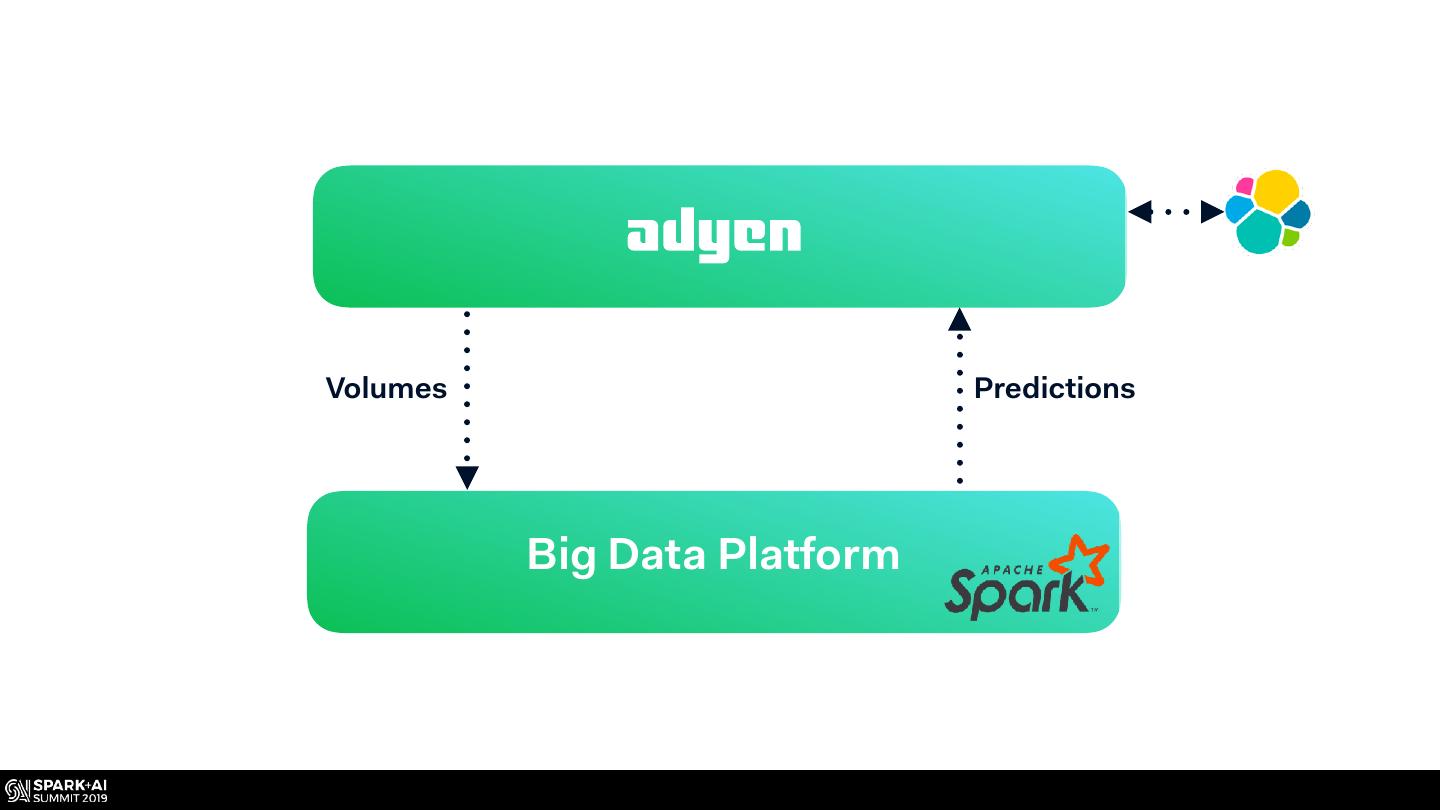
13 .Volumes Predictions Big Data Platform
14 .Volumes Predictions Big Data Platform
15 . TimeSeries Ecosystem Flint FB Prophet Spark-ts Stats models
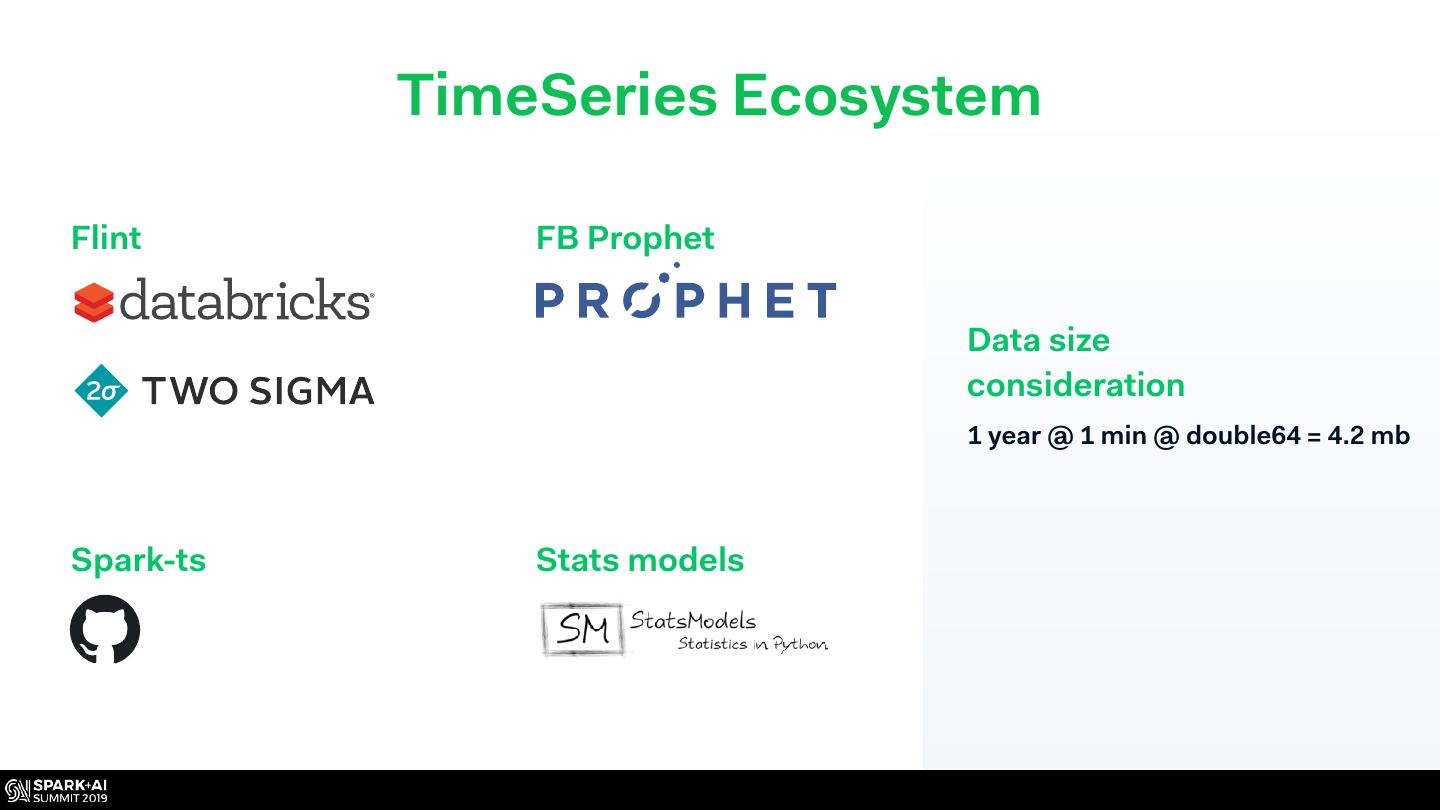
16 . TimeSeries Ecosystem Flint FB Prophet Data size consideration 1 year @ 1 min @ double64 = 4.2 mb Spark-ts Stats models
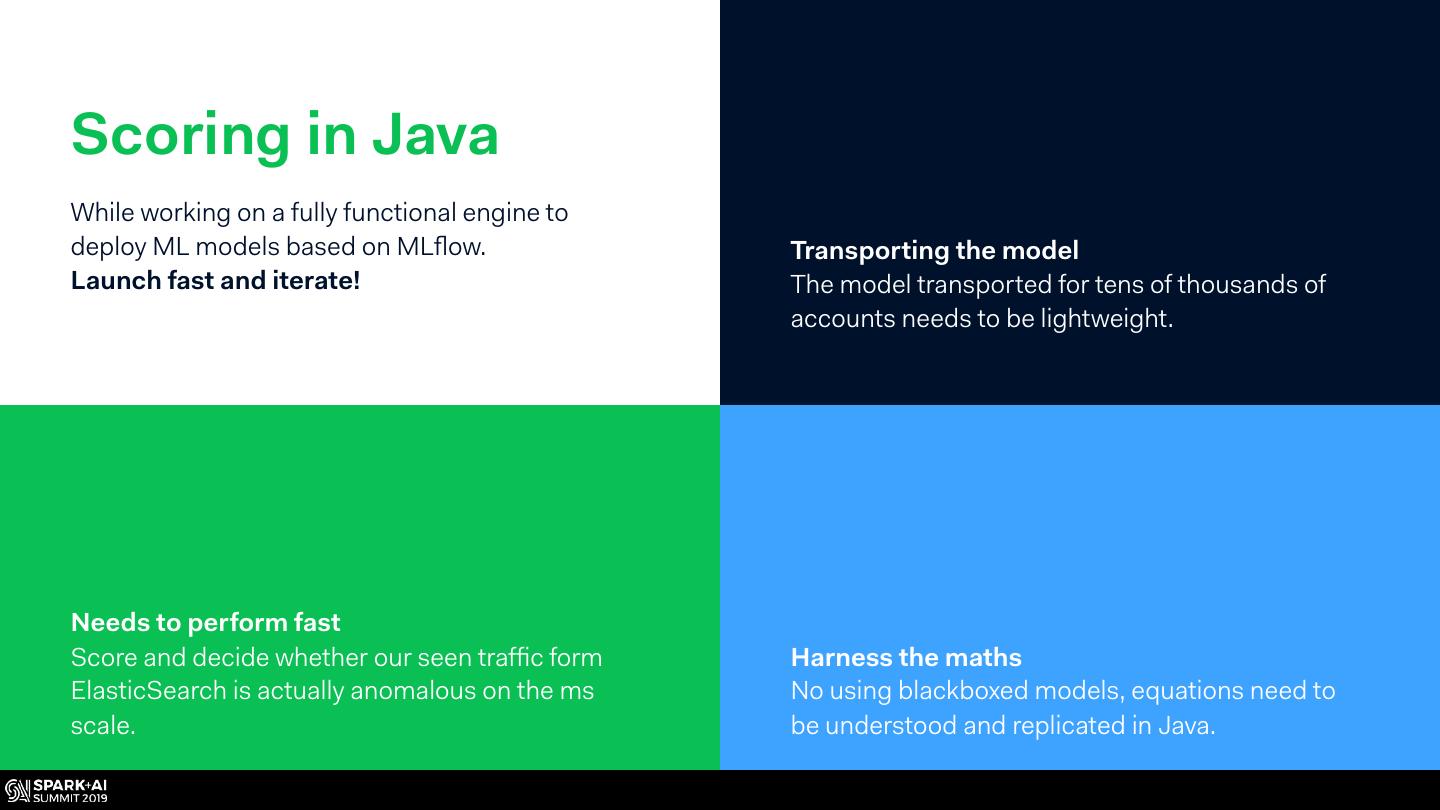
17 .Scoring in Java While working on a fully functional engine to deploy ML models based on MLflow. Transporting the model Launch fast and iterate! The model transported for tens of thousands of accounts needs to be lightweight. Needs to perform fast Score and decide whether our seen traffic form Harness the maths ElasticSearch is actually anomalous on the ms No using blackboxed models, equations need to scale. be understood and replicated in Java.
18 .Volumes Predictions Big Data Platform
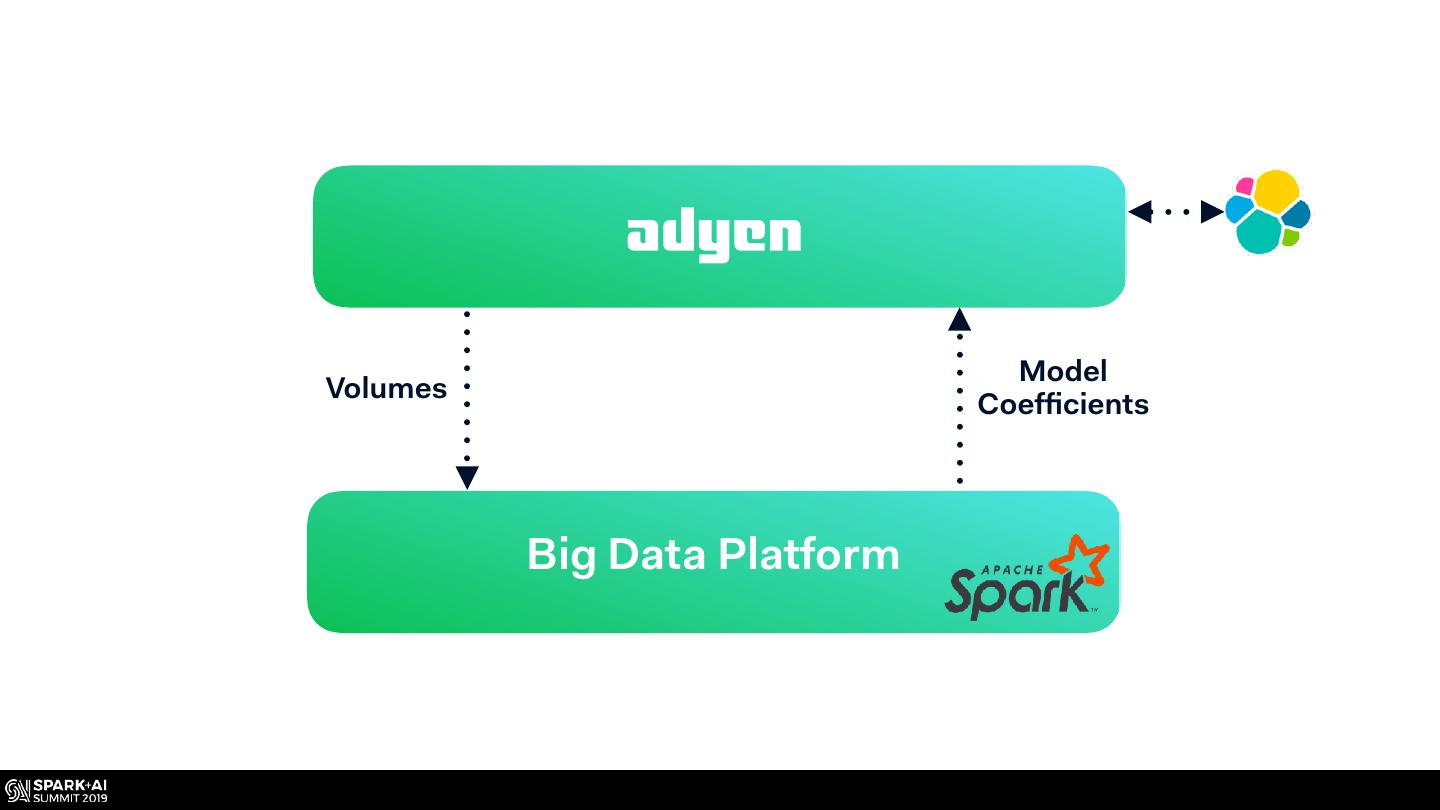
19 . Model Volumes Coefficients Big Data Platform
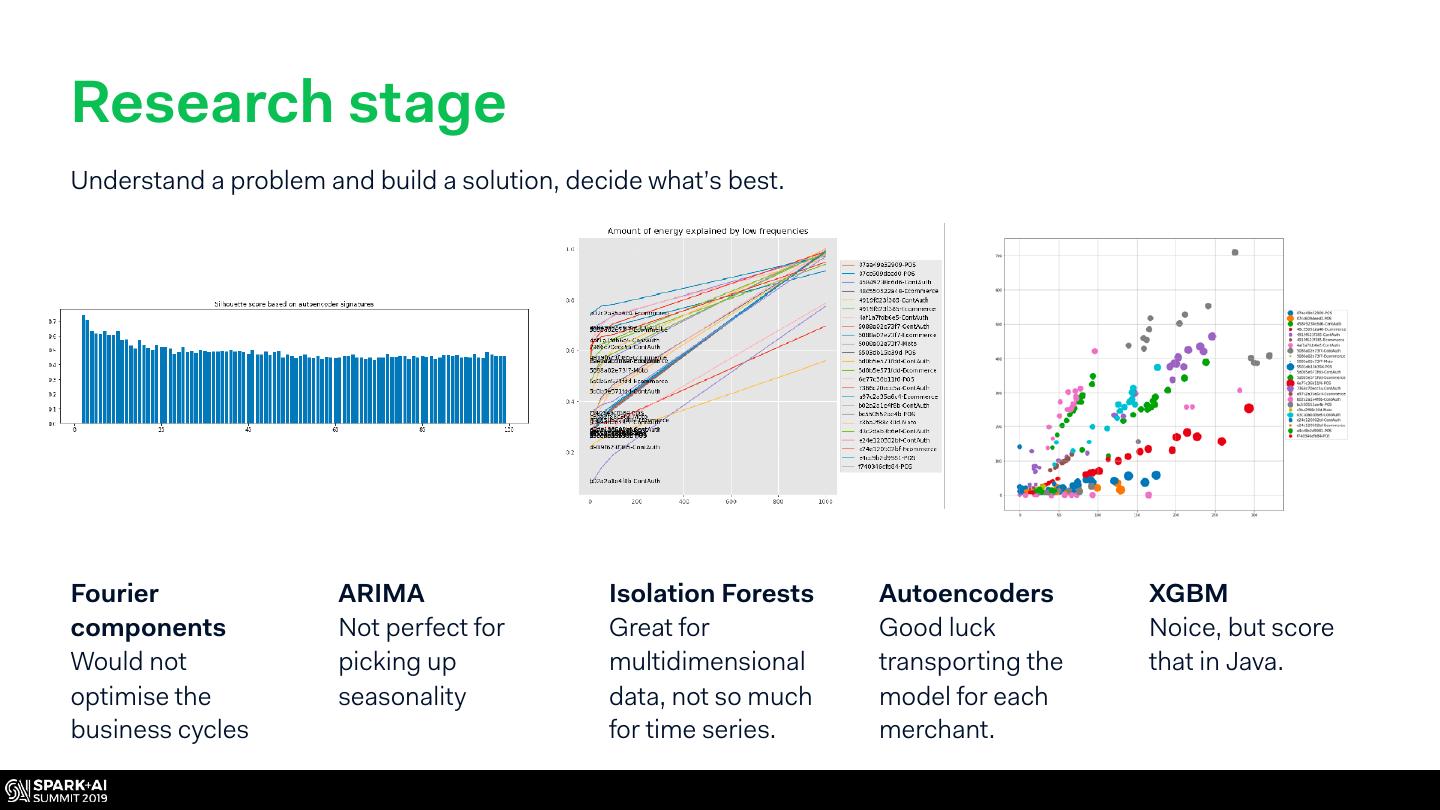
20 .Research stage Understand a problem and build a solution, decide what’s best. Fourier ARIMA Isolation Forests Autoencoders XGBM components Not perfect for Great for Good luck Noice, but score Would not picking up multidimensional transporting the that in Java. optimise the seasonality data, not so much model for each business cycles for time series. merchant.
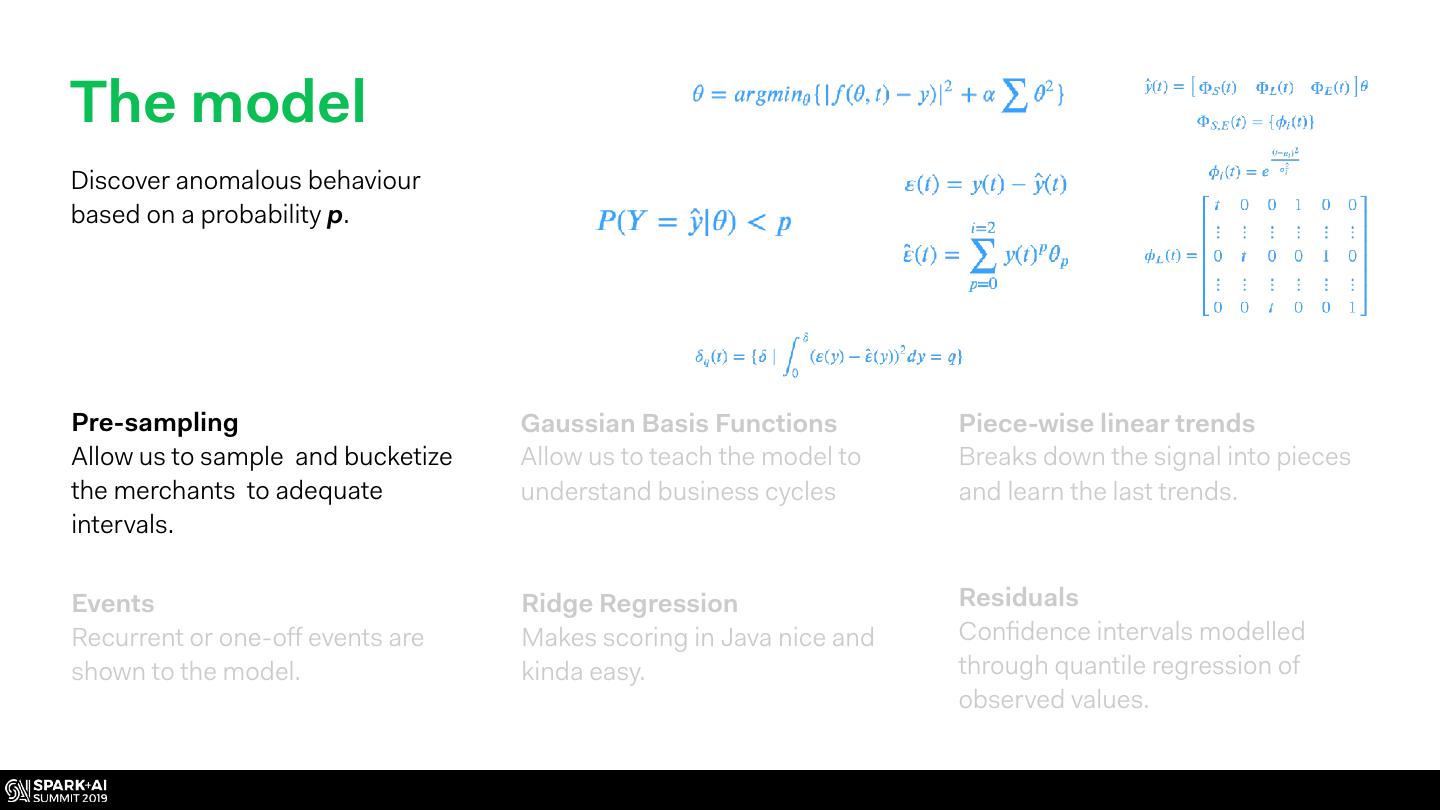
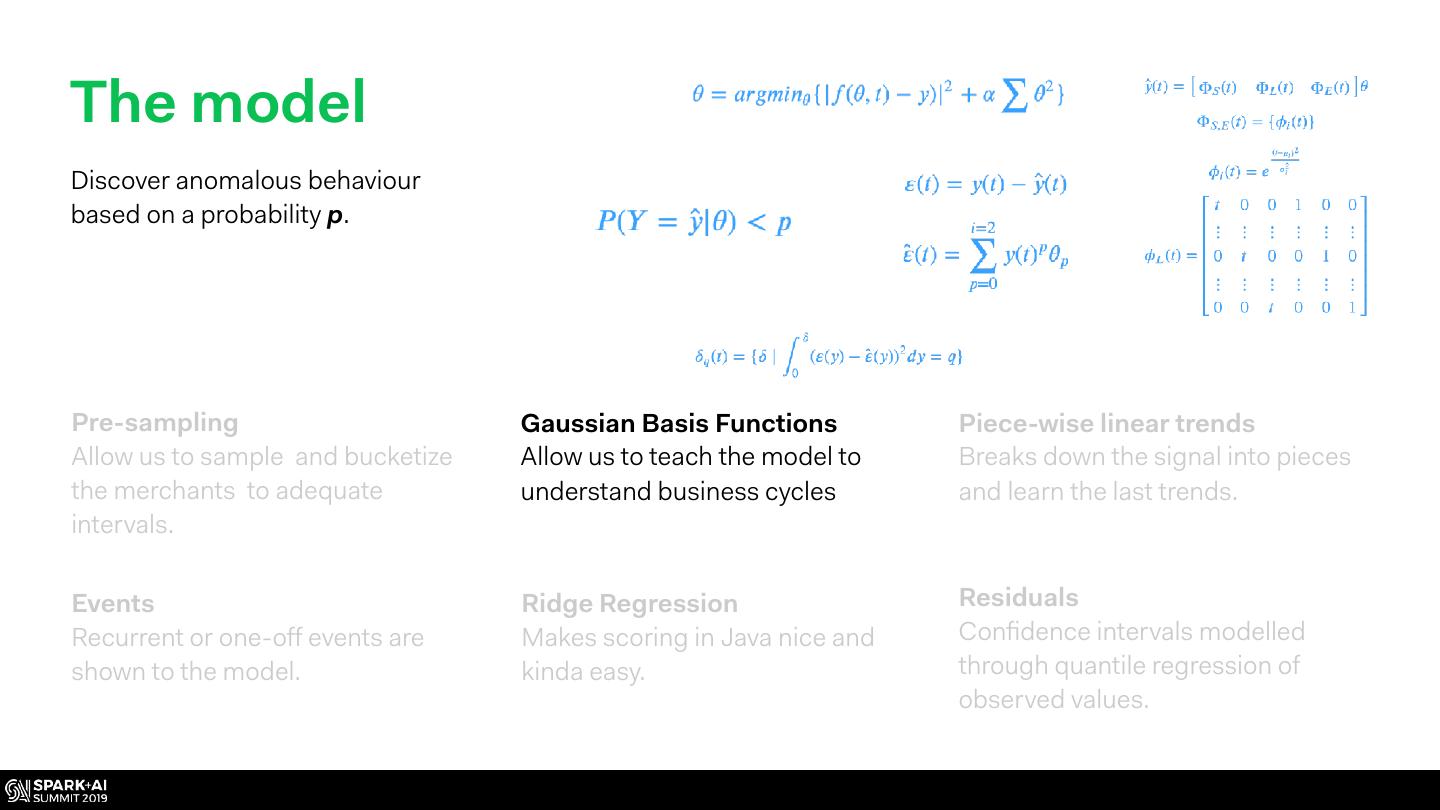
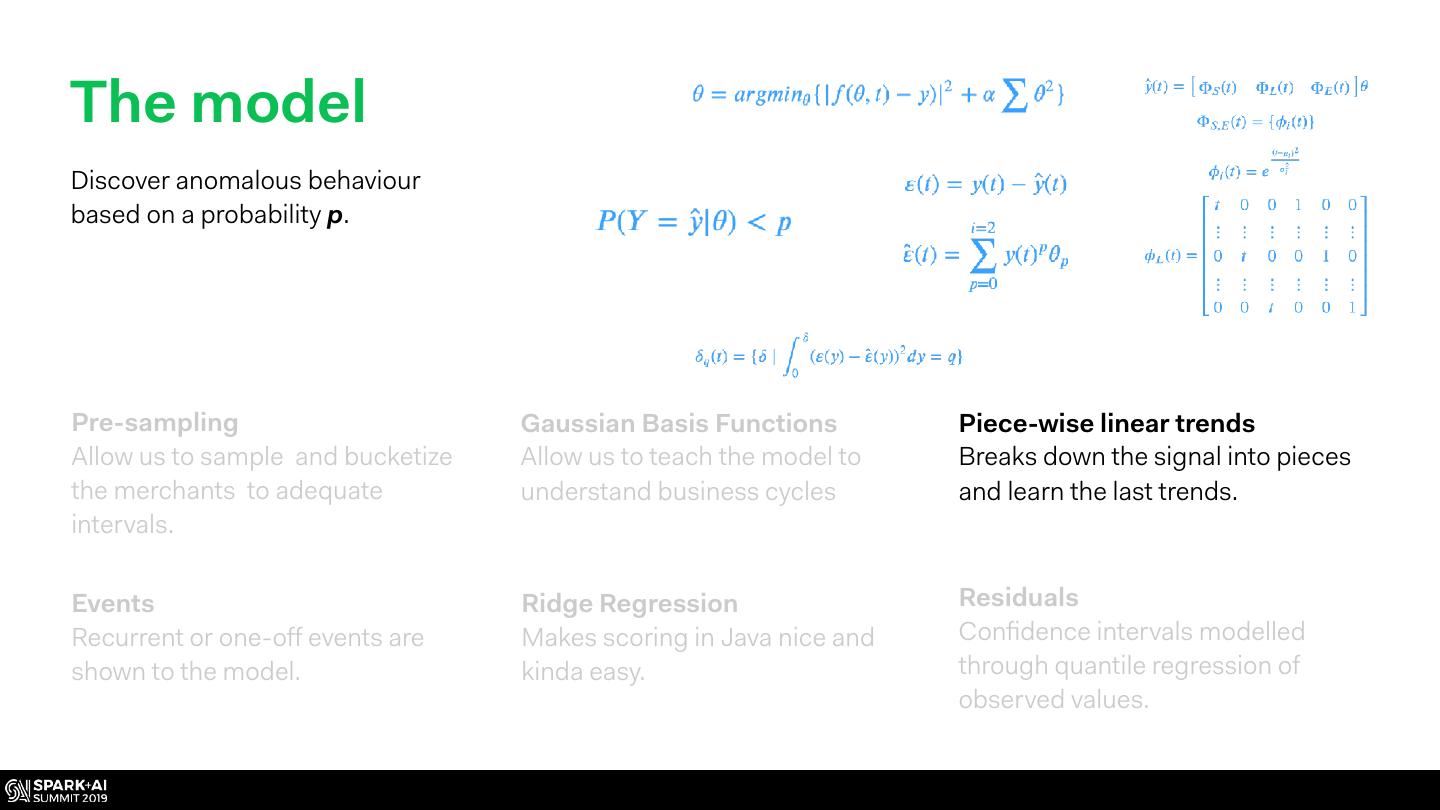
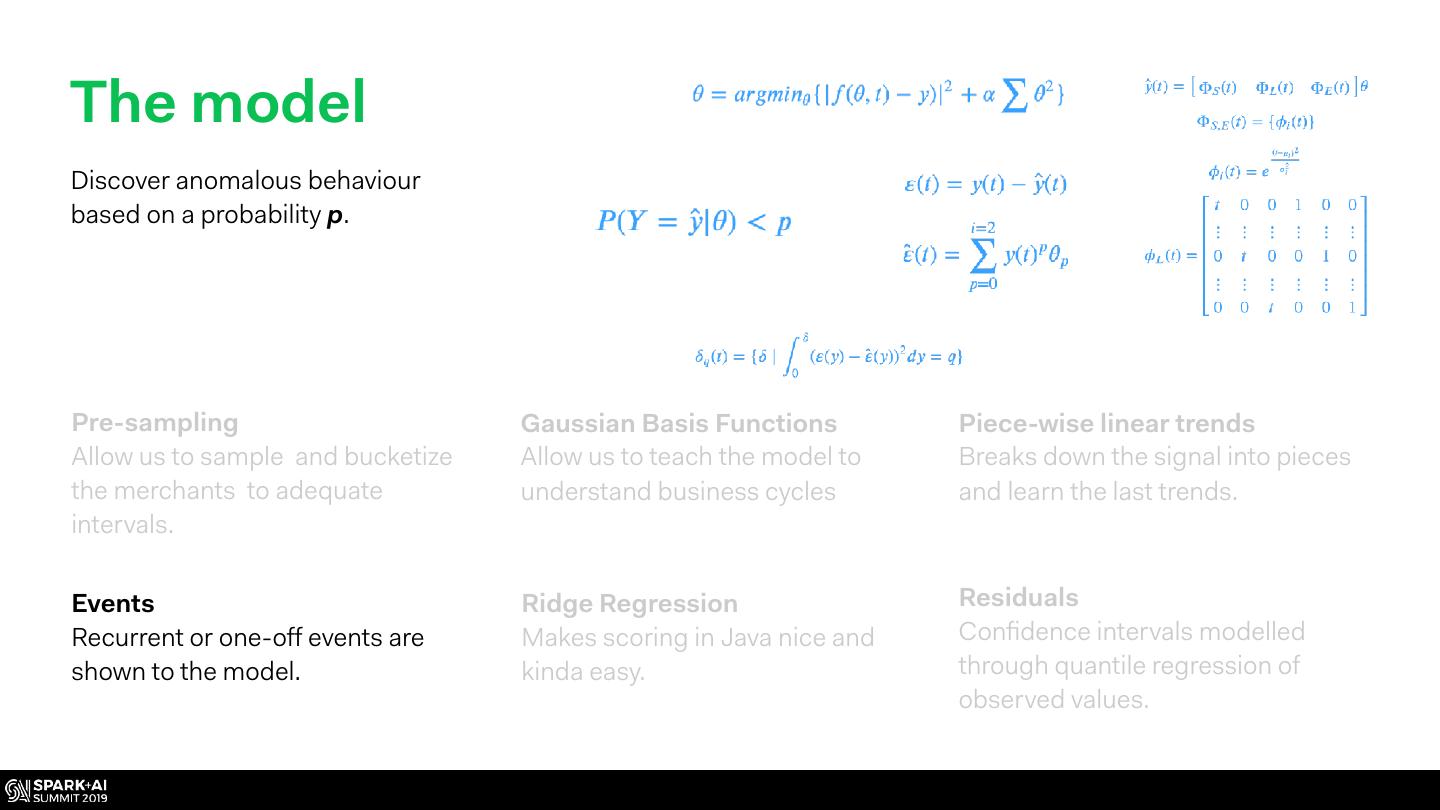
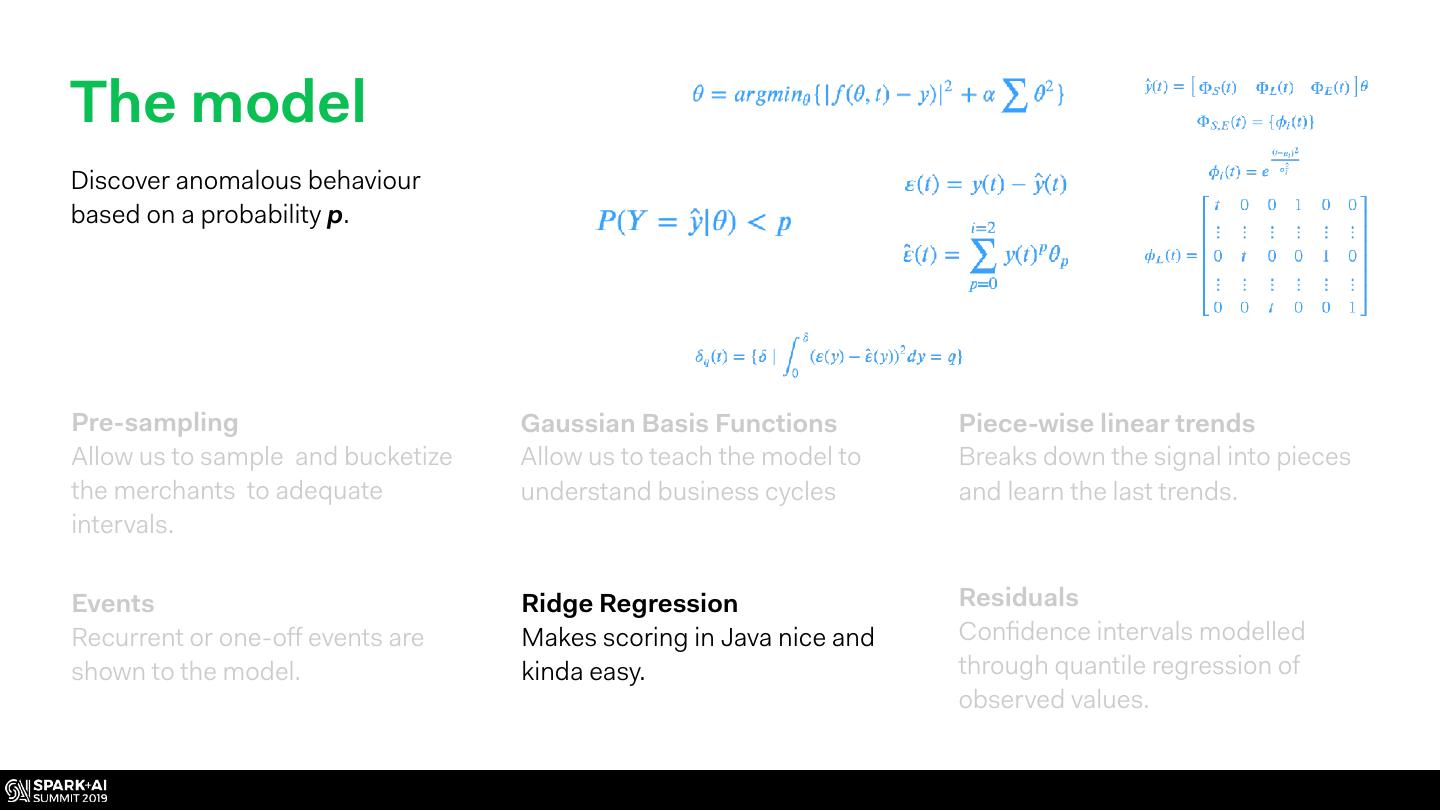
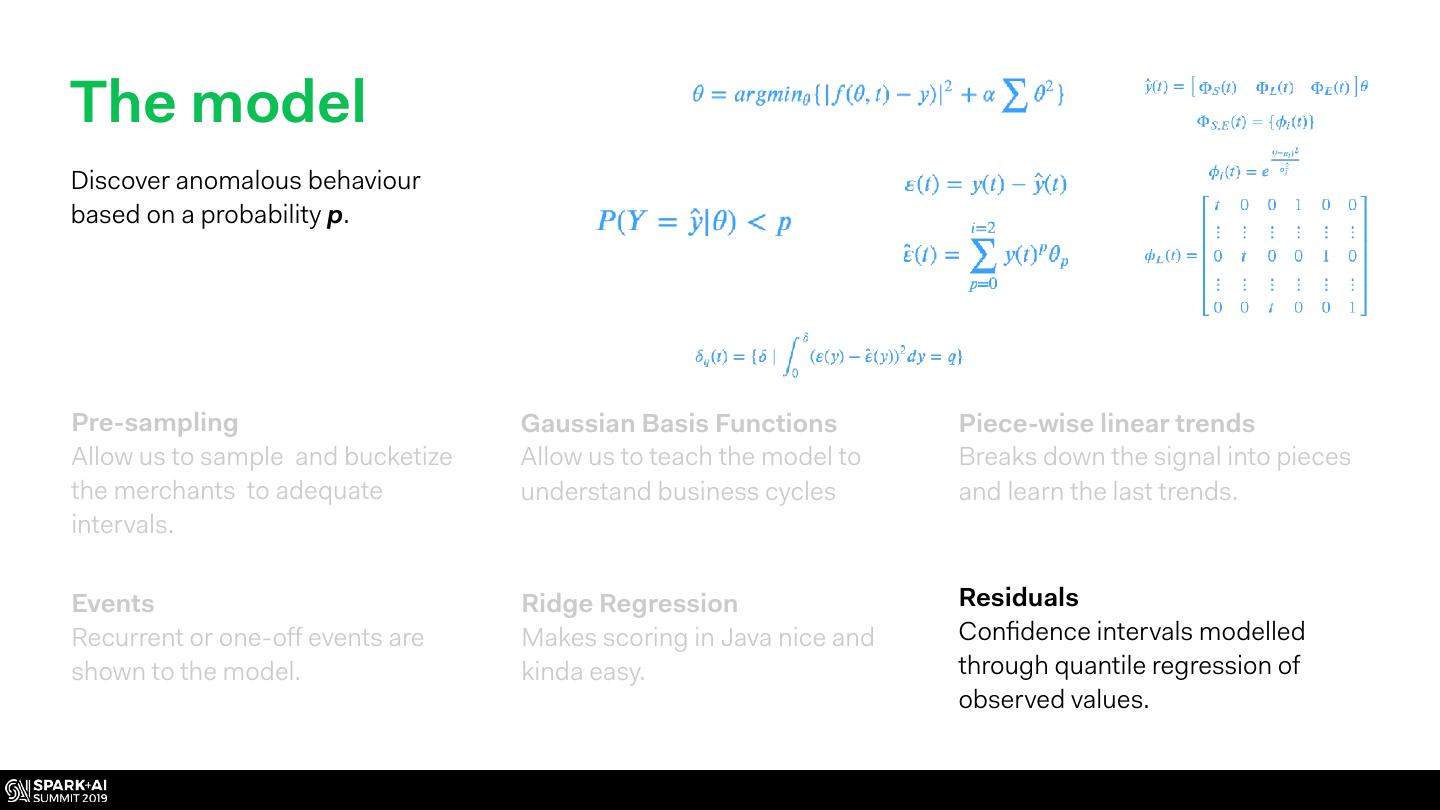
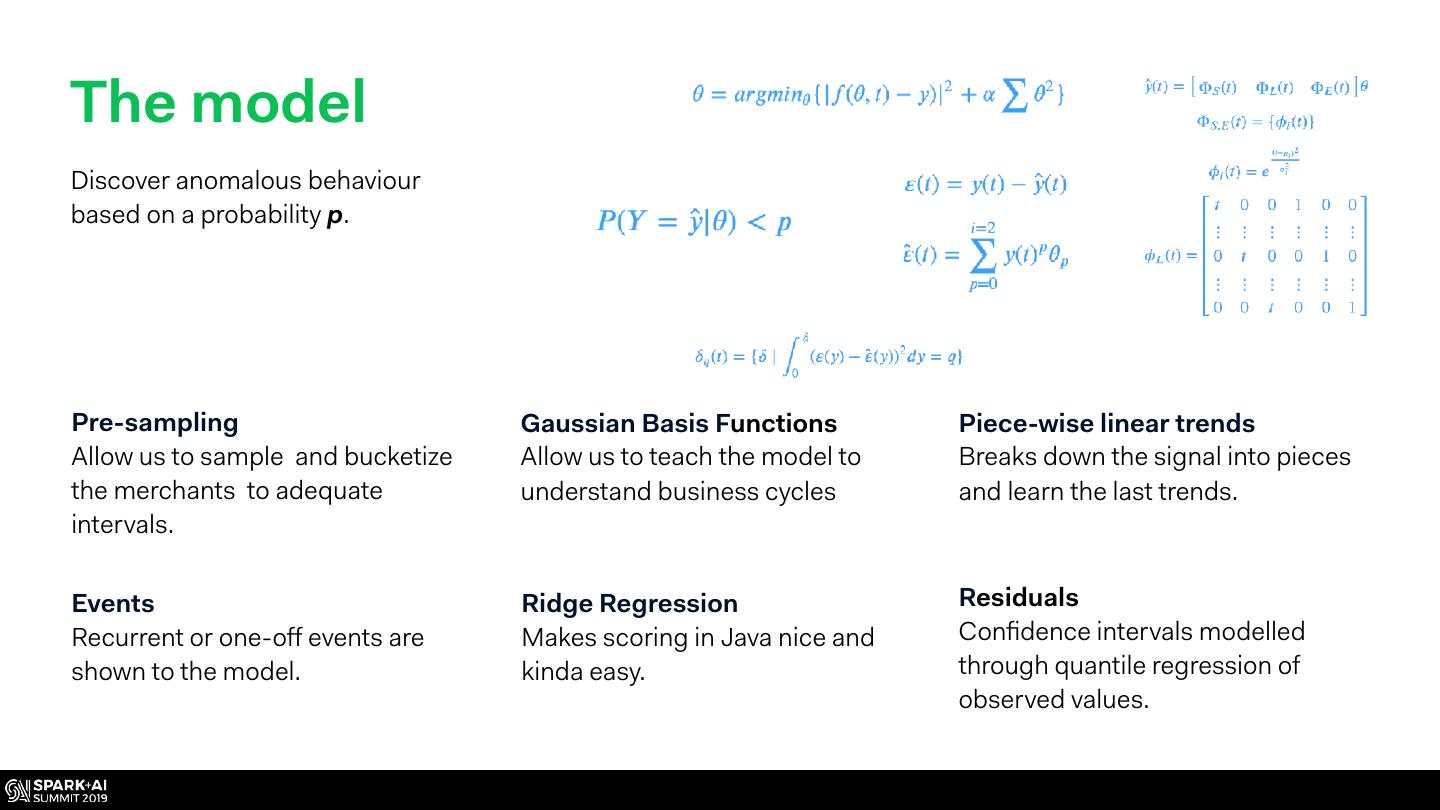
21 .The model Discover anomalous behaviour based on a probability p. Pre-sampling Gaussian Basis Functions Piece-wise linear trends Allow us to sample and bucketize Allow us to teach the model to Breaks down the signal into pieces the merchants to adequate understand business cycles and learn the last trends. intervals. Events Ridge Regression Residuals Recurrent or one-off events are Makes scoring in Java nice and Confidence intervals modelled shown to the model. kinda easy. through quantile regression of observed values.
22 .The model Discover anomalous behaviour based on a probability p. Pre-sampling Gaussian Basis Functions Piece-wise linear trends Allow us to sample and bucketize Allow us to teach the model to Breaks down the signal into pieces the merchants to adequate understand business cycles and learn the last trends. intervals. Events Ridge Regression Residuals Recurrent or one-off events are Makes scoring in Java nice and Confidence intervals modelled shown to the model. kinda easy. through quantile regression of observed values.
23 .The model Discover anomalous behaviour based on a probability p. Pre-sampling Gaussian Basis Functions Piece-wise linear trends Allow us to sample and bucketize Allow us to teach the model to Breaks down the signal into pieces the merchants to adequate understand business cycles and learn the last trends. intervals. Events Ridge Regression Residuals Recurrent or one-off events are Makes scoring in Java nice and Confidence intervals modelled shown to the model. kinda easy. through quantile regression of observed values.
24 .The model Discover anomalous behaviour based on a probability p. Pre-sampling Gaussian Basis Functions Piece-wise linear trends Allow us to sample and bucketize Allow us to teach the model to Breaks down the signal into pieces the merchants to adequate understand business cycles and learn the last trends. intervals. Events Ridge Regression Residuals Recurrent or one-off events are Makes scoring in Java nice and Confidence intervals modelled shown to the model. kinda easy. through quantile regression of observed values.
25 .The model Discover anomalous behaviour based on a probability p. Pre-sampling Gaussian Basis Functions Piece-wise linear trends Allow us to sample and bucketize Allow us to teach the model to Breaks down the signal into pieces the merchants to adequate understand business cycles and learn the last trends. intervals. Events Ridge Regression Residuals Recurrent or one-off events are Makes scoring in Java nice and Confidence intervals modelled shown to the model. kinda easy. through quantile regression of observed values.
26 .The model Discover anomalous behaviour based on a probability p. Pre-sampling Gaussian Basis Functions Piece-wise linear trends Allow us to sample and bucketize Allow us to teach the model to Breaks down the signal into pieces the merchants to adequate understand business cycles and learn the last trends. intervals. Events Ridge Regression Residuals Recurrent or one-off events are Makes scoring in Java nice and Confidence intervals modelled shown to the model. kinda easy. through quantile regression of observed values.
27 .The model Discover anomalous behaviour based on a probability p. Pre-sampling Gaussian Basis Functions Piece-wise linear trends Allow us to sample and bucketize Allow us to teach the model to Breaks down the signal into pieces the merchants to adequate understand business cycles and learn the last trends. intervals. Events Ridge Regression Residuals Recurrent or one-off events are Makes scoring in Java nice and Confidence intervals modelled shown to the model. kinda easy. through quantile regression of observed values.
28 .The model Discover anomalous behaviour based on a probability p. Pre-sampling Gaussian Basis Functions Piece-wise linear trends Allow us to sample and bucketize Allow us to teach the model to Breaks down the signal into pieces the merchants to adequate understand business cycles and learn the last trends. intervals. Events Ridge Regression Residuals Recurrent or one-off events are Makes scoring in Java nice and Confidence intervals modelled shown to the model. kinda easy. easy through quantile regression of observed values.
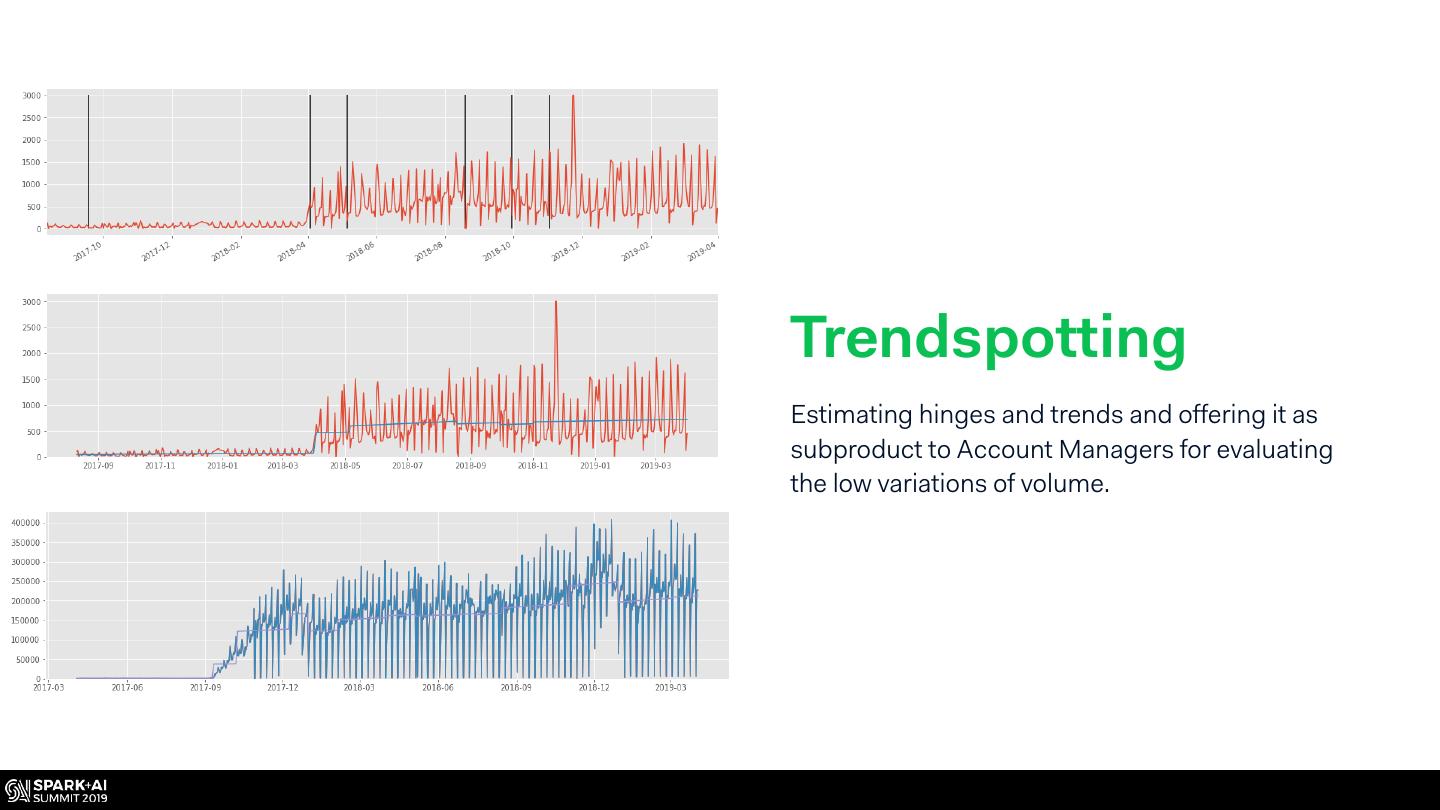
29 .Trendspotting Estimating hinges and trends and offering it as subproduct to Account Managers for evaluating the low variations of volume.


